
Abstract
Introduction
People with severe and persistent mental illness (SPMI)have high rates of social isolation, impairments in daily living and decreased quality of life (Jablensky et al., 2000). To improve social functioning and quality of life, clinical treatment should be provided alongside community support (Kopelowicz and Liberman, 2003) as part of a ‘tripod’ of services: clinical care, psychosocial support and housing (Whiteford, 1994).
In Australia, clinical services are provided by the public and private mental health sectors, with services in the non-clinical mental health community support sector delivered mostly, but not exclusively, by non-governmental organisations (NGOs) (Department of Health and Ageing, 2007). Services provided by the mental health community support sector range from programs targeted at the individual, such as living skills training and supported accommodation, and group programs such as clubhouses, to broader community programs, such as carer support and community mental health awareness. There is increasing evidence of the effectiveness of supported accommodation (Leff et al., 2009; Lloyd-Evans et al., 2009) personalised support (Siskind et al., 2012) and clubhouse services (Anon, 1999).
Following deinstitutionalisation, clinical services were expanded, while community support services languished (Rosen, 2006). The 1992 National Mental Health Policy identified the need for increased mental health community support sector services but did not require the development of planning targets for the sector. After nearly 20 years of mental health reform in Australia, these non-clinical services remain inadequately funded (Townsend et al., 2006). For Australia to shift to funding arrangements which reflect services currently delivered, and to adequately resource the sector for current and future needs, planning targets need to be set (Pirkis et al., 2007). In recognition of this need, the Fourth National Mental Health Plan calls for ‘targets for the mix and level of the full range of mental health services’ across the clinical and community support sectors (Department of Health and Ageing, 2009).
There are relatively few published examples of planning estimates for the mental health community support sector, with most focusing solely on supported accommodation. The majority of estimates on supported accommodation are in government planning documents (Centre for Mental Health, New South Wales Department of Health, 2001; Ireland Expert Group on Mental Health Policy, 2006; New Zealand Mental Health Commission, 1998; Queensland Government, 2008; South Australian Social Inclusion Board 2007), with the remainder in independent planning models (Andrews et al., 2006; Boardman and Parsonage, 2007) and the academic literature (Lesage et al., 2003; Lesage et al., 2008). There are relatively few planning estimates for other components of the mental health community support sector (Boardman and Parsonage, 2007; Centre for Mental Health, New South Wales Department of Health, 2001; Ireland Expert Group on Mental Health Policy, 2006). The extent to which planning estimates can be generated and used depends on several factors including: how the services are defined; the roles and responsibilities of the various service providers involved; the comparability of output and planning units; and the clarity in description of underpinning assumptions.
The paucity of enumerated planning estimates and the variations in how the few existing estimates are developed and expressed creates barriers for jurisdictions such as Queensland in adopting sector-wide planning estimates. The research presented here was part of a larger project designed to create planning estimates for Queensland across the broad range of services provided in the community mental health support sector. This paper represents the views of the authors and does not necessarily represent the position of the Queensland Government. The scope of the work was focused on services funded by the Queensland State Government. In Australia, the Commonwealth Government funds employment and training programs. As these are not funded by the State Government, they were out of scope. We have therefore not calculated planning estimates for this core service component. Future research is required to explore planning estimates for this service component.
Materials and methods
We used a three-step process to calculate planning estimates. These steps are consistent with principles for service development planning for the ideal scenario, as described by Thornicroft and Tansella (1999), which involve examining epidemiological needs, service provision and service use.
Step 1: Quantifying the need for services
The first stage in planning for service provision was to identify and quantify the population requiring mental health community support services. We based our estimates on three assumptions. First, that the majority of mental health community support services in Australia are targeted at working age adults. Second, that the mental health community support sector provides a variety of services for people with different levels of service need, and third, that mental illness severity could be used as a proxy measure of level of need.
We began by deriving estimates of community prevalence of mental disorders, split by severity, among adults aged 18–65 years in Queensland for 2009. The estimated resident population of Queensland as at June 2009 was drawn from the Australian Bureau of Statistics data (Australian Bureau of Statistics, 2008). As there are no current estimates of the size and characteristics of the population with mental illness in Queensland, this data was extrapolated from the New South Wales Mental Health Clinical Care and Prevention (MH-CCP) model (version 1.11; Centre for Mental Health, New South Wales Department of Health, 2001). MH-CCP version 1.11 derives ‘best estimates’ based on international epidemiological evidence combined with local data, including the Australian Survey of Mental Health and Well-being (Andrews et al., 2001).
Severity was stratified into three levels – mild, moderate and severe – based on definitional and epidemiological criteria developed by the US National Advisory Mental Health Council which takes into account diagnosis, disability and duration (chronicity) (Centre for Mental Health, New South Wales Department of Health, 2001). The severe group were estimated to included 54% meeting the criteria for schizophrenia (1.5% of the population); 39% for major depression (1.1% of the population); 36% bipolar disorder (1.0% of the population); 21% obsessive–compulsive disorder (0.6% of the population); and 14% panic disorder (0.4% of the population) (Centre for Mental Health, New South Wales Department of Health, 2001). These conditions may be co-morbid. As the majority of services are targeted at the severe group, and as the level of need within this group varies, a more detailed examination of this group was required. The severe group was stratified into SPMI, and severe and episodic mental illness. The severe and persistent group was further stratified into three groups based on severity and needs estimates from Australia (Australian Bureau of Statistics, 2004) and the UK (Sainsbury Centre for Mental Health, 1998): first, SPMI requiring long-term institutional care; second, SPMI capable of independent living in the community; and a third group, SPMI living in the community but with complex needs requiring multiple supports. The third group, SPMI with multi-agency needs is characterised by people who have lost social or family support networks and rely extensively on multiple health and community services for assistance to maintain their lives outside of institutional care.
Step 2: Creating a framework for planning
A taxonomy of the services in scope was required to set the bounds of the mental health community support sector and to classify services into appropriate groups for deriving planning estimates. We reviewed the existing taxonomies (Australian Institute of Health and Welfare, 2002; Australian Institute of Health and Welfare, 2003; Barton, 1999; Mental Health Coordinating Council, 2000; Penrose-Wall and Bateman, 2007; Victorian Government Department of Human Services, 2008; Wood and Pennebaker, 2004) and consulted with the funding agency (Queensland Department of Communities) over which components were in scope. We created a new taxonomy, designed to encompass all services in scope divided into the smallest practical number of components. Services included reflected policy priorities and best practice models. Each component was designed to have a coherent set of output and planning units and reflect the intent, function and focus (individual or group) of the services provided. Six core service components were identified:
Psychosocial support (one-on-one activities ranging from low intensity support such as assistance with shopping and recreation to intensive assistance with daily living activities);
Supported accommodation (short- and long-term residential and housing-based services with psychosocial support);
Group support programs (groups that aim to improve quality of life and psychosocial functioning);
Mutual support and self-help (carer support and peer support services that assist individuals to share life experiences and develop support networks with people who have similar experiences);
Employment and training (programs designed to assist patients in returning to the workforce or gain further education); and
Community development (programs that operate on a societal scale and aim to reduce stigma and raise awareness of mental health issues).
For each component, we mapped the service components to the target population. Target groups were identified through discussion with government disability and health service funding agencies and non-governmental service providers. We partitioned the relevant population groups in terms of broad types of need for community mental health support services. Estimates of the size of target groups for each component were formulated.
Step 3: Setting resource targets
We evaluated the necessary parameters for making planning estimates and selected output and planning units for each component of the taxonomy. Output units were defined as a measure of the product being delivered in each core service component. Where possible, these were given as the number of patients supported and the number of contact hours or residential days. A planning unit is a measure of the number of patient service units provided per head of the total population. These were given as beds or places per 100,000 population or as a proportion of total community mental health support sector budget. A pragmatic approach was chosen for selecting output counting units and planning units. Output planning units were guided by two principles: areas in which most evidence existed and ability to be converted to planning units.
Resource targets were set for each core component of the mental health community support sector. The exact approach for each component differed based on the evidence base for services, data available and the underlying planning assumptions. A general approach to each component was to: define and quantify the target population; generate guiding assumptions; calculate output and planning units based on the available data and evidence and convert the planning units into resource targets per 100,000 population. Where possible, staffing resource targets of full-time equivalents (FTEs) per 100,000 population were derived. Data and evidence were drawn from state and national mental health planning documents, government program evaluation reports, independent planning models and the published literature. Specific references used for each component are listed in the relevant results sections.
Results
Quantifying the needs for services
Community prevalence of mental disorders in Queensland in 2009
A total of 496,603 adults or 17.8% of the adult population (aged 18–65) in Queensland were estimated to have experienced a mental disorder in 2009 (Table 1). This group is stratified by severity into mild (10.8% of the adult population), moderate (4.2%) and severe (2.8%).
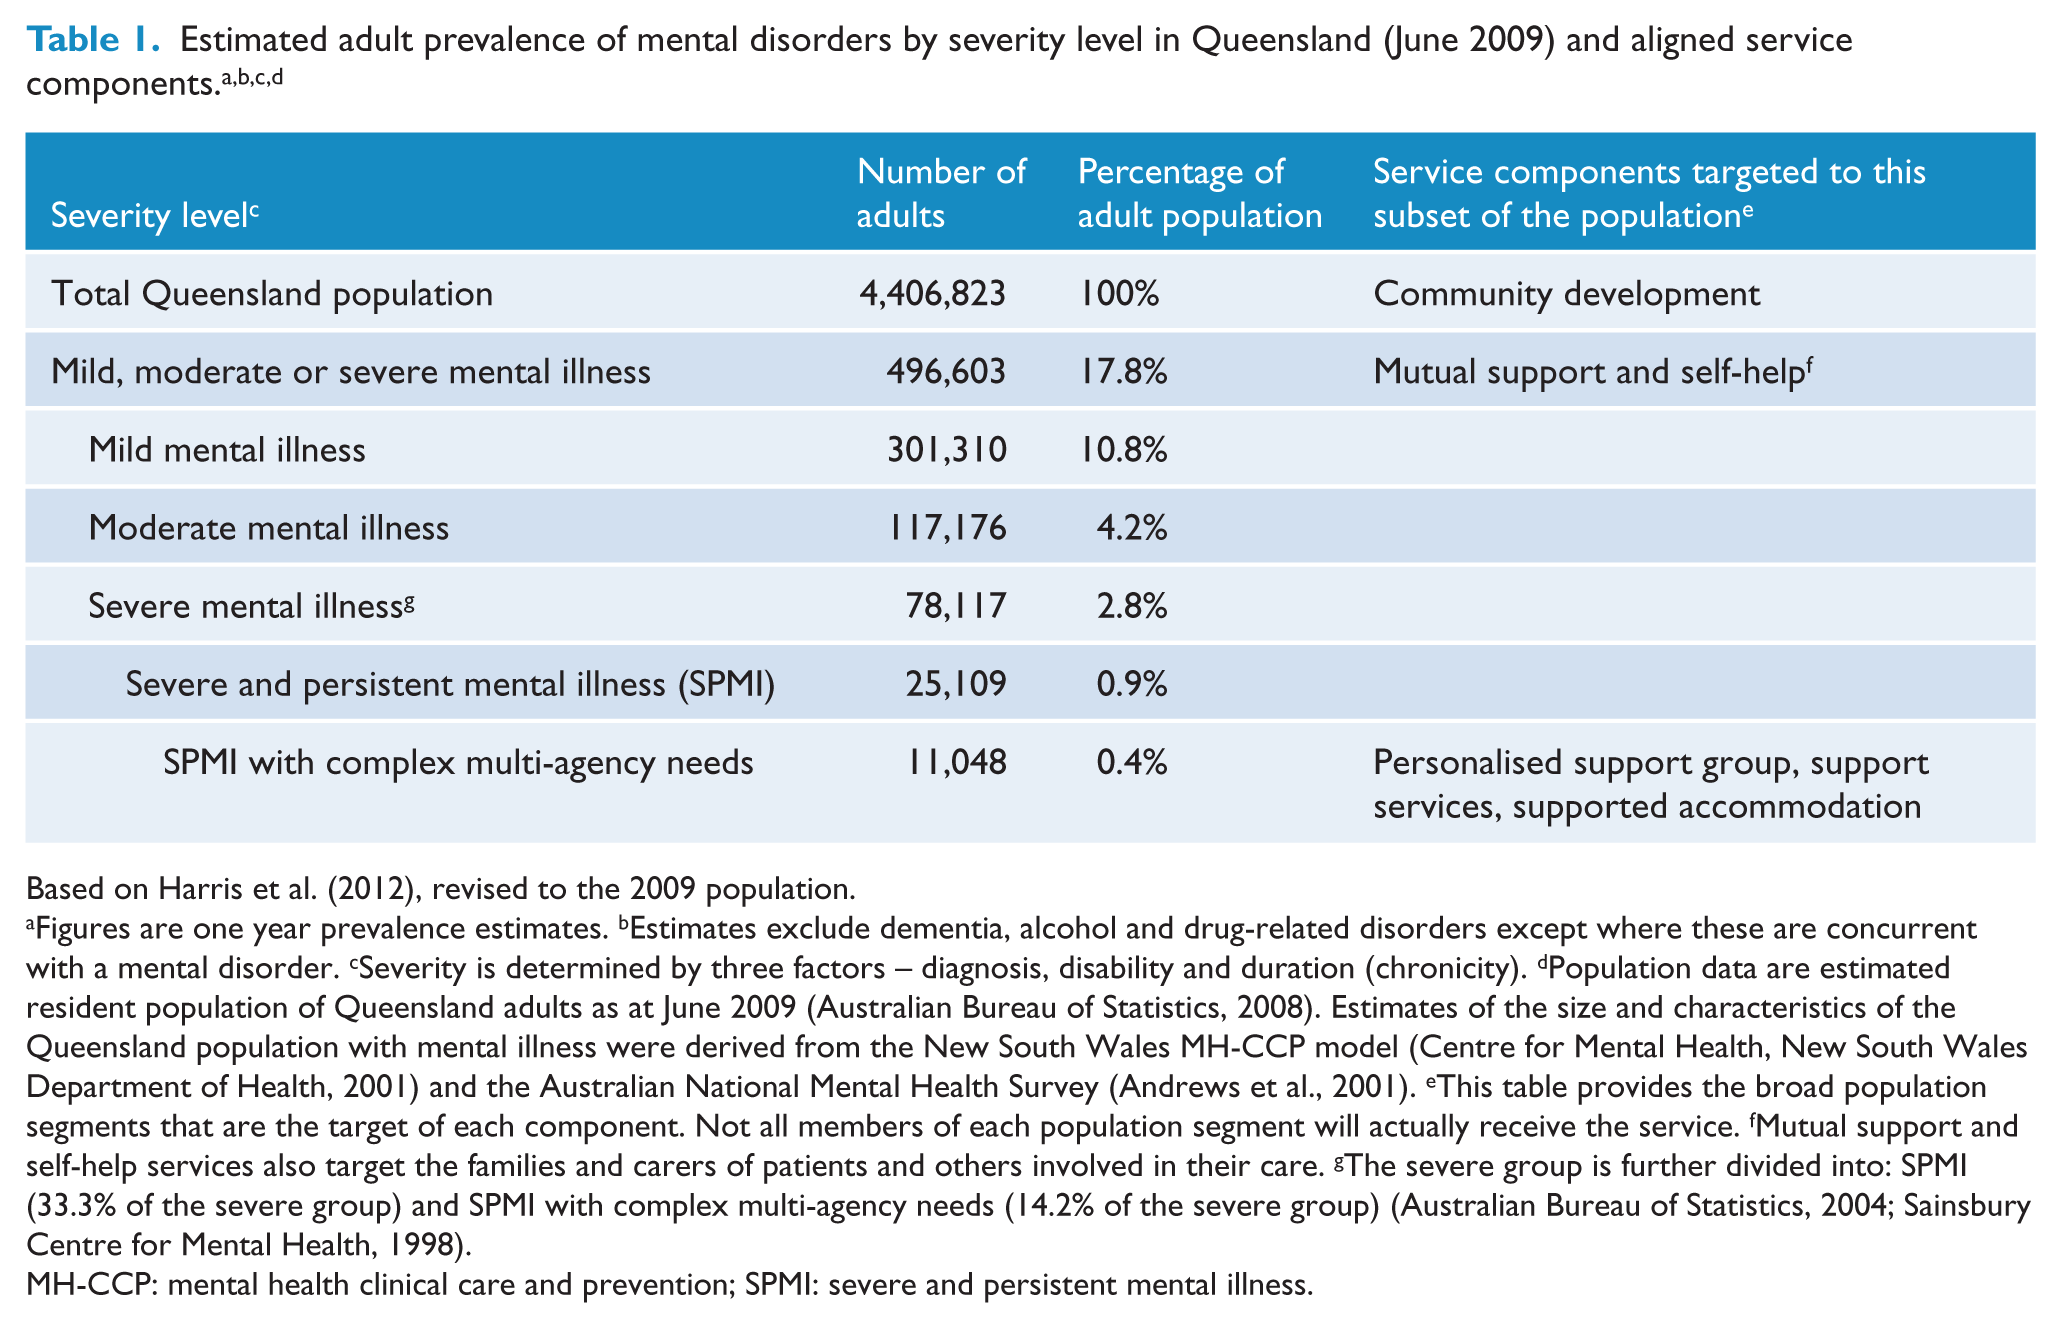
Based on Harris et al. (2012), revised to the 2009 population.
Figures are one year prevalence estimates. bEstimates exclude dementia, alcohol and drug-related disorders except where these are concurrent with a mental disorder. cSeverity is determined by three factors – diagnosis, disability and duration (chronicity). dPopulation data are estimated resident population of Queensland adults as at June 2009 (Australian Bureau of Statistics, 2008). Estimates of the size and characteristics of the Queensland population with mental illness were derived from the New South Wales MH-CCP model (Centre for Mental Health, New South Wales Department of Health, 2001) and the Australian National Mental Health Survey (Andrews et al., 2001). eThis table provides the broad population segments that are the target of each component. Not all members of each population segment will actually receive the service. fMutual support and self-help services also target the families and carers of patients and others involved in their care. gThe severe group is further divided into: SPMI (33.3% of the severe group) and SPMI with complex multi-agency needs (14.2% of the severe group) (Australian Bureau of Statistics, 2004; Sainsbury Centre for Mental Health, 1998).
MH-CCP: mental health clinical care and prevention; SPMI: severe and persistent mental illness.
We estimated that approximately one-third of those with severe disorders, or 0.9% of the adult population, is affected by a SPMI. This figure was based on estimates made of adults with ‘severe and enduring mental illness’ in the UK (Sainsbury Centre for Mental Health, 1998).
The SPMI group included a subgroup with SPMI with complex, multi-agency needs. These people have lost their social connections and require ongoing, comprehensive services from multiple agencies to maintain their lives in the community. We estimated that 0.4% of the adult population, or 44.4% of those with SPMI, had complex multi-agency needs. This was based on data from the 2003 Australian Survey of Disability, Ageing and Carers that estimated that approximately 0.4% of the adult population have a profound core-activity limitation that arises from their mental illness, and data from the UK that estimated a similar percentage of the adult population have severe and enduring mental illness that requires ongoing, comprehensive services (Australian Bureau of Statistics, 2004; Sainsbury Centre for Mental Health, 1998). In Queensland, this was estimated to be 11,048 individuals.
Target populations
Target groups for different service subtypes are outlined in Table 1. The majority of mental health community support sector services are targeted towards people with SPMI who have complex, multi-agency needs. Services targeted to this group are supported accommodation, psychosocial support and group support services. People with SPMI who do not require multi-agency assistance are considered to have the capacity to benefit from support services that are provided by other sectors, primarily employment and education activities. Mutual support and self-help programs are targeted to all individuals with mental disorders, regardless of severity, as well as their families. Community development programs are targeted to the general population, including people with mental illness.
Output and planning units and resource targets by core service component
Planning estimates for all service components are summarised in Table 2, and additional detail regarding specific components is provided in Tables 3, 4 and 5.
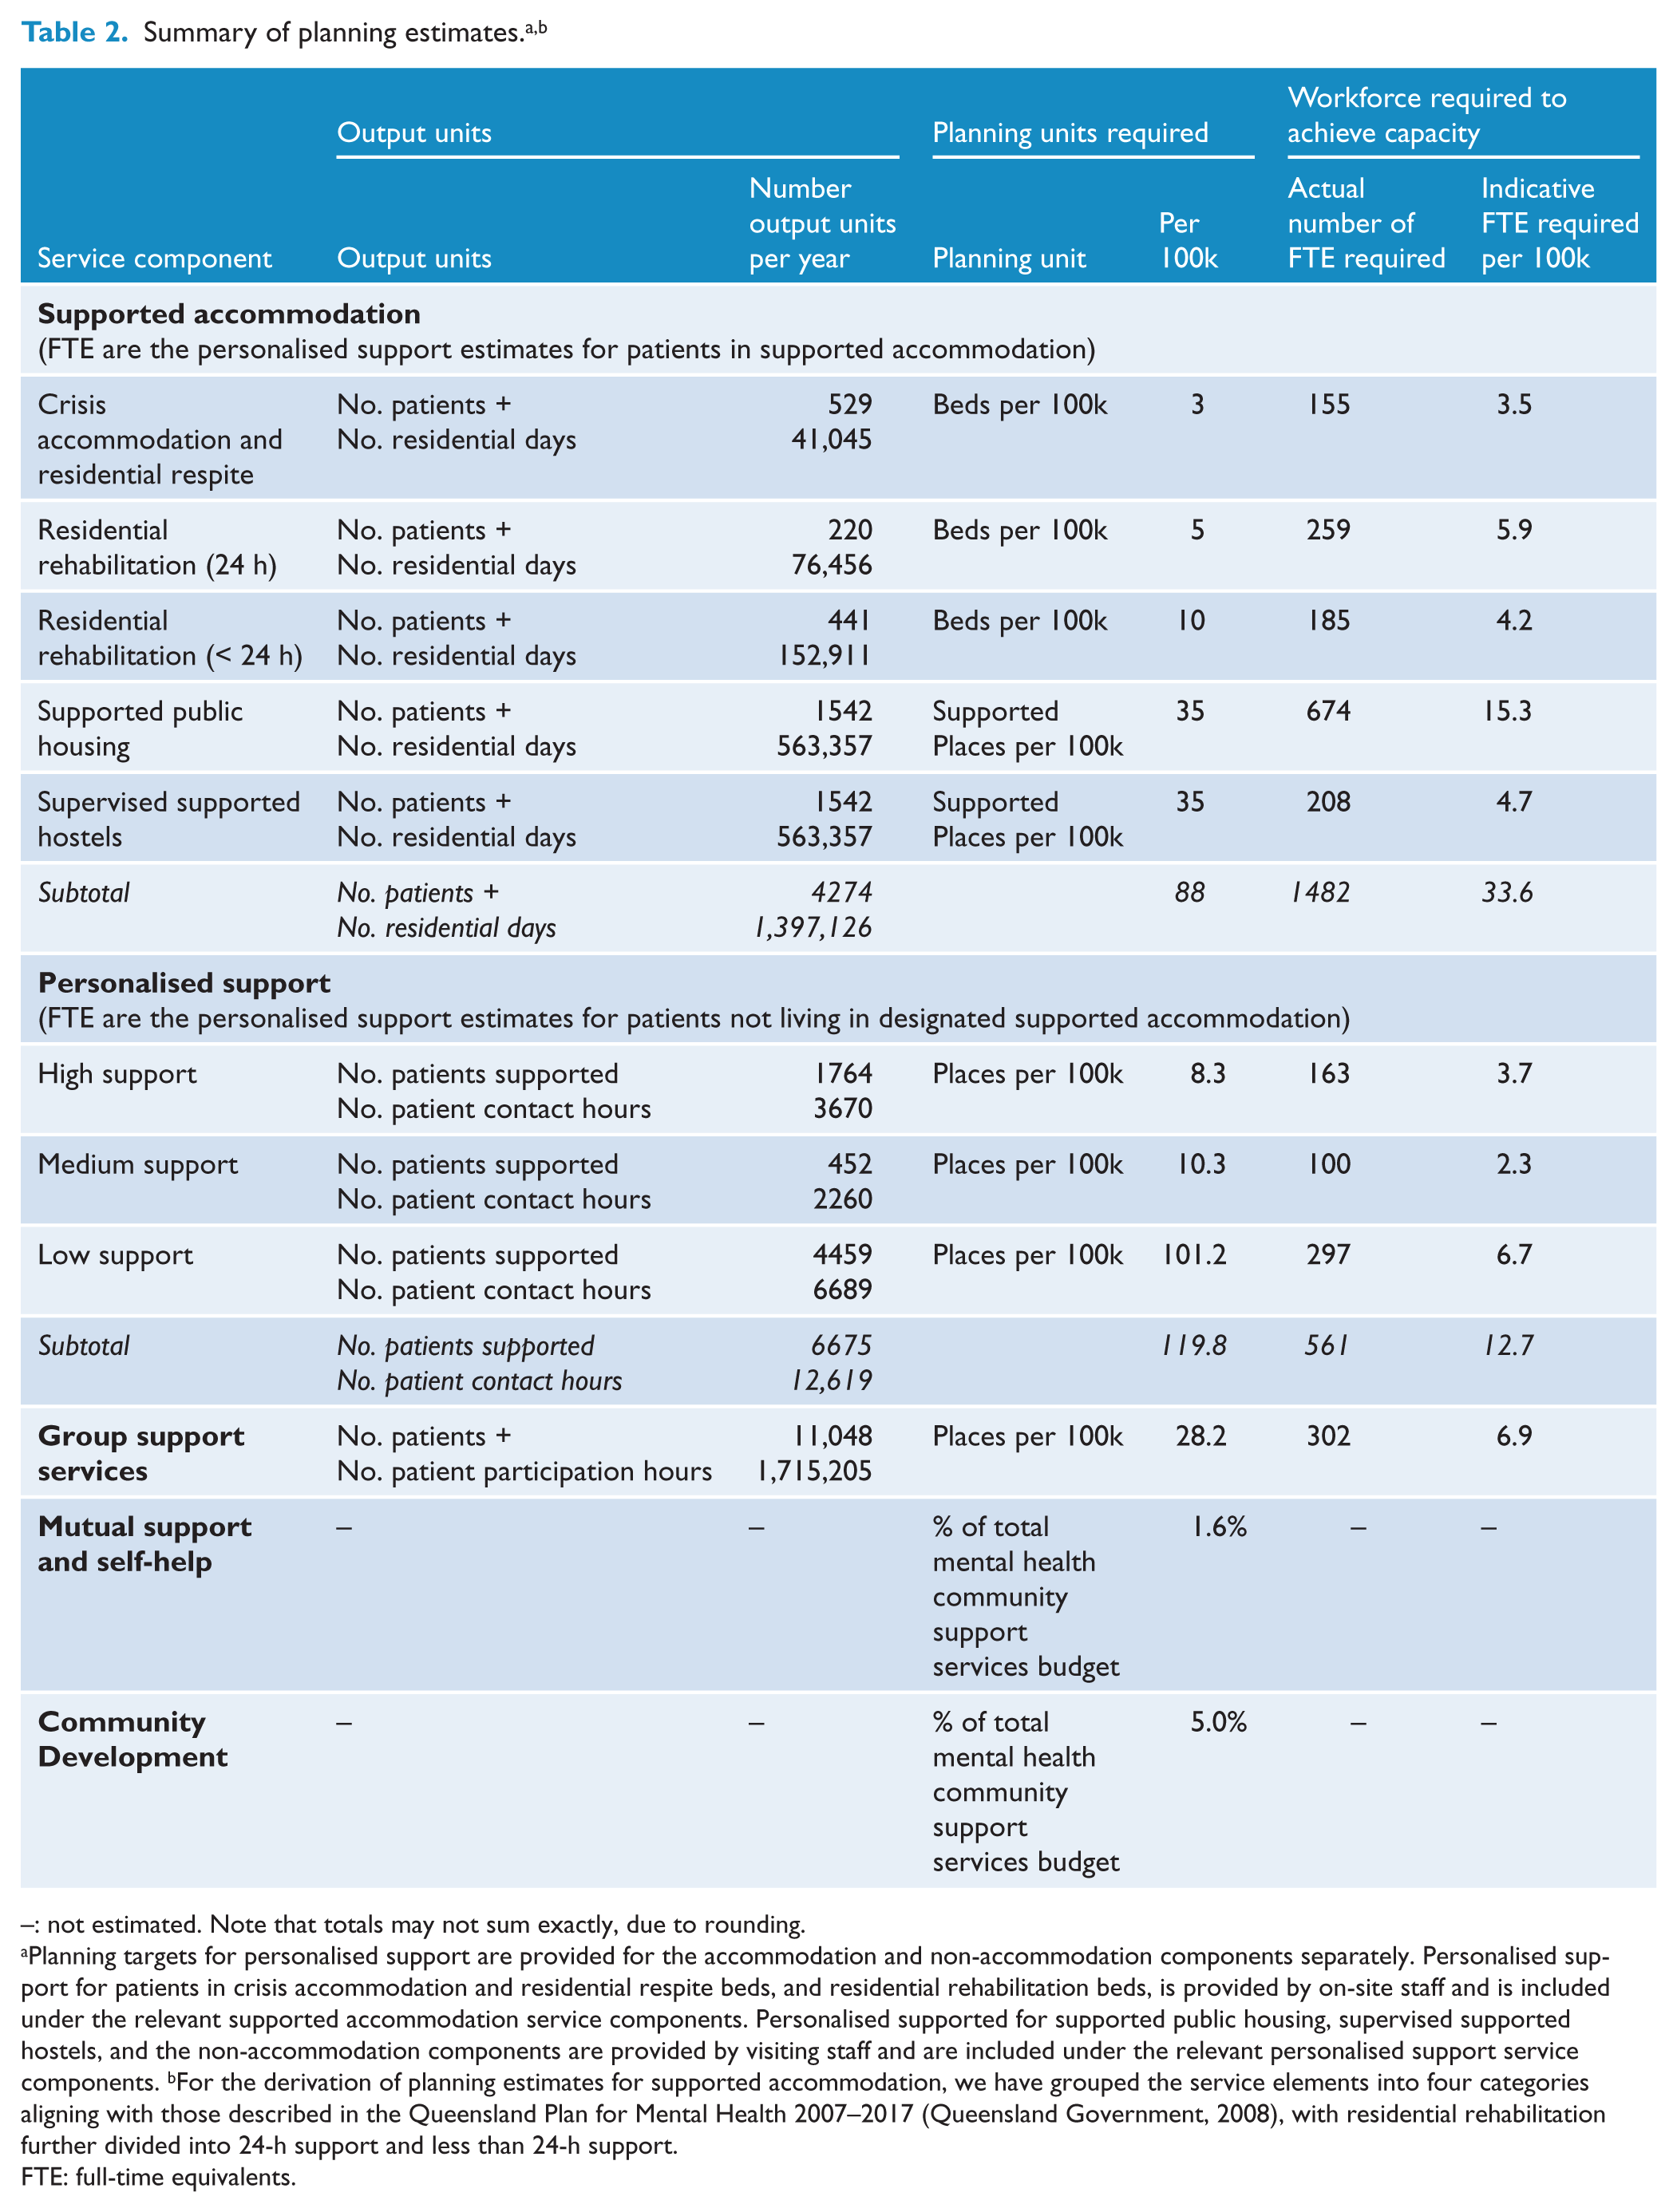
–: not estimated. Note that totals may not sum exactly, due to rounding.
Planning targets for personalised support are provided for the accommodation and non-accommodation components separately. Personalised support for patients in crisis accommodation and residential respite beds, and residential rehabilitation beds, is provided by on-site staff and is included under the relevant supported accommodation service components. Personalised supported for supported public housing, supervised supported hostels, and the non-accommodation components are provided by visiting staff and are included under the relevant personalised support service components. bFor the derivation of planning estimates for supported accommodation, we have grouped the service elements into four categories aligning with those described in the Queensland Plan for Mental Health 2007–2017 (Queensland Government, 2008), with residential rehabilitation further divided into 24-h support and less than 24-h support.
FTE: full-time equivalents.
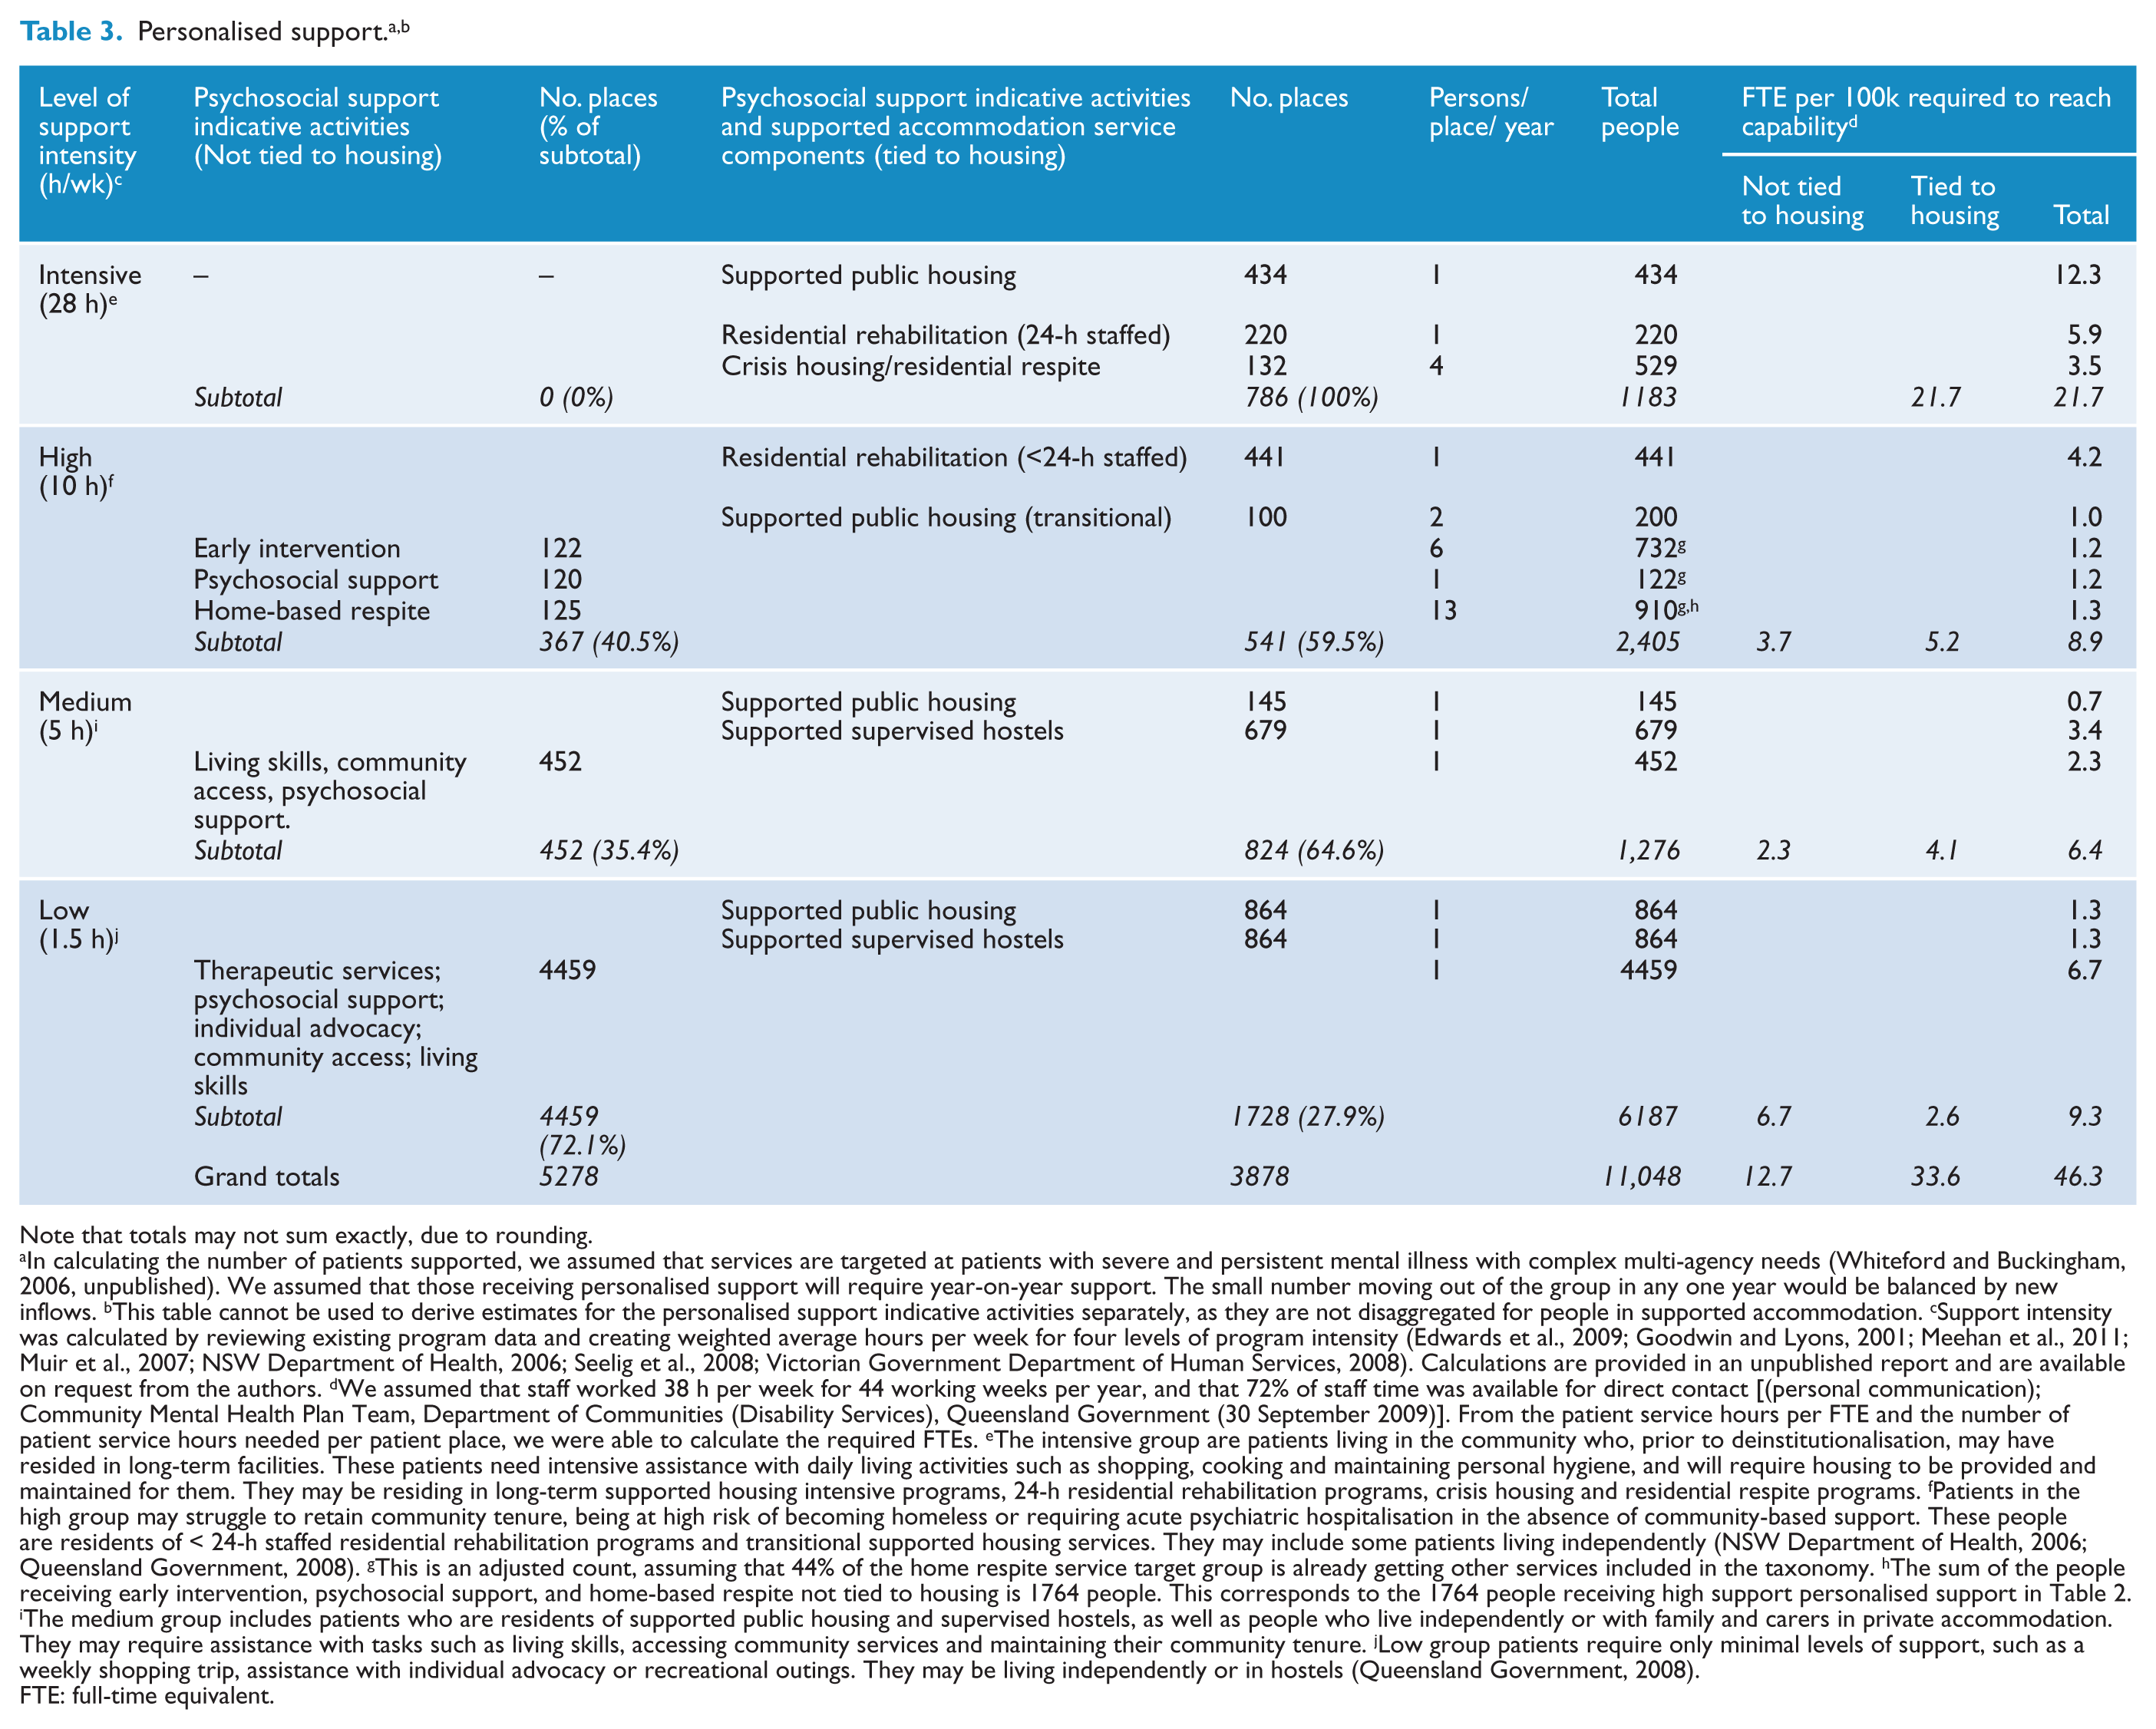
Note that totals may not sum exactly, due to rounding.
In calculating the number of patients supported, we assumed that services are targeted at patients with severe and persistent mental illness with complex multi-agency needs (Whiteford and Buckingham, 2006, unpublished). We assumed that those receiving personalised support will require year-on-year support. The small number moving out of the group in any one year would be balanced by new inflows. bThis table cannot be used to derive estimates for the personalised support indicative activities separately, as they are not disaggregated for people in supported accommodation. cSupport intensity was calculated by reviewing existing program data and creating weighted average hours per week for four levels of program intensity (Edwards et al., 2009; Goodwin and Lyons, 2001; Meehan et al., 2011; Muir et al., 2007; NSW Department of Health, 2006; Seelig et al., 2008; Victorian Government Department of Human Services, 2008). Calculations are provided in an unpublished report and are available on request from the authors. dWe assumed that staff worked 38 h per week for 44 working weeks per year, and that 72% of staff time was available for direct contact [(personal communication); Community Mental Health Plan Team, Department of Communities (Disability Services), Queensland Government (30 September 2009)]. From the patient service hours per FTE and the number of patient service hours needed per patient place, we were able to calculate the required FTEs. eThe intensive group are patients living in the community who, prior to deinstitutionalisation, may have resided in long-term facilities. These patients need intensive assistance with daily living activities such as shopping, cooking and maintaining personal hygiene, and will require housing to be provided and maintained for them. They may be residing in long-term supported housing intensive programs, 24-h residential rehabilitation programs, crisis housing and residential respite programs. fPatients in the high group may struggle to retain community tenure, being at high risk of becoming homeless or requiring acute psychiatric hospitalisation in the absence of community-based support. These people are residents of < 24-h staffed residential rehabilitation programs and transitional supported housing services. They may include some patients living independently (NSW Department of Health, 2006; Queensland Government, 2008). gThis is an adjusted count, assuming that 44% of the home respite service target group is already getting other services included in the taxonomy. hThe sum of the people receiving early intervention, psychosocial support, and home-based respite not tied to housing is 1764 people. This corresponds to the 1764 people receiving high support personalised support in Table 2. iThe medium group includes patients who are residents of supported public housing and supervised hostels, as well as people who live independently or with family and carers in private accommodation. They may require assistance with tasks such as living skills, accessing community services and maintaining their community tenure. jLow group patients require only minimal levels of support, such as a weekly shopping trip, assistance with individual advocacy or recreational outings. They may be living independently or in hostels (Queensland Government, 2008).
FTE: full-time equivalent.
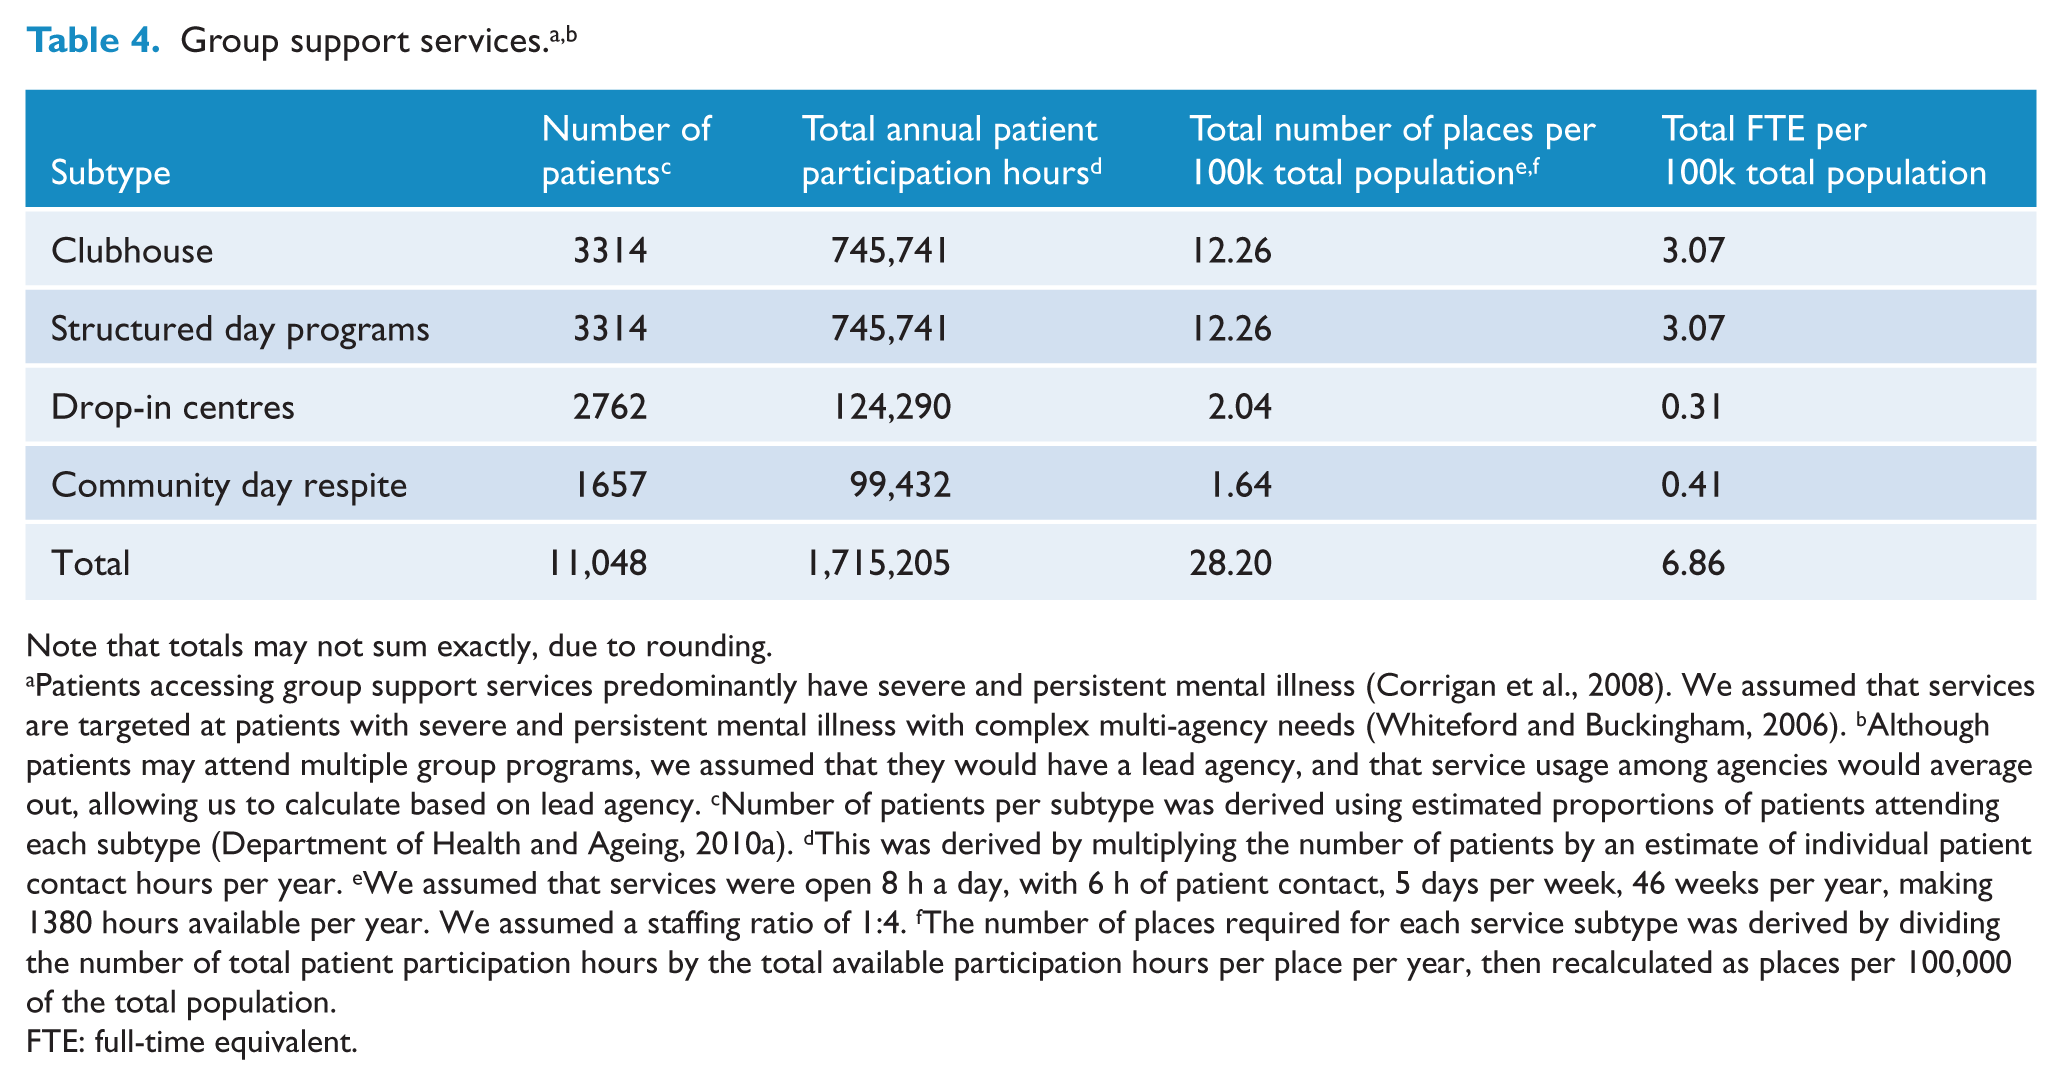
Note that totals may not sum exactly, due to rounding.
Patients accessing group support services predominantly have severe and persistent mental illness (Corrigan et al., 2008). We assumed that services are targeted at patients with severe and persistent mental illness with complex multi-agency needs (Whiteford and Buckingham, 2006). bAlthough patients may attend multiple group programs, we assumed that they would have a lead agency, and that service usage among agencies would average out, allowing us to calculate based on lead agency. cNumber of patients per subtype was derived using estimated proportions of patients attending each subtype (Department of Health and Ageing, 2010a). dThis was derived by multiplying the number of patients by an estimate of individual patient contact hours per year. eWe assumed that services were open 8 h a day, with 6 h of patient contact, 5 days per week, 46 weeks per year, making 1380 hours available per year. We assumed a staffing ratio of 1:4. fThe number of places required for each service subtype was derived by dividing the number of total patient participation hours by the total available participation hours per place per year, then recalculated as places per 100,000 of the total population.
FTE: full-time equivalent.
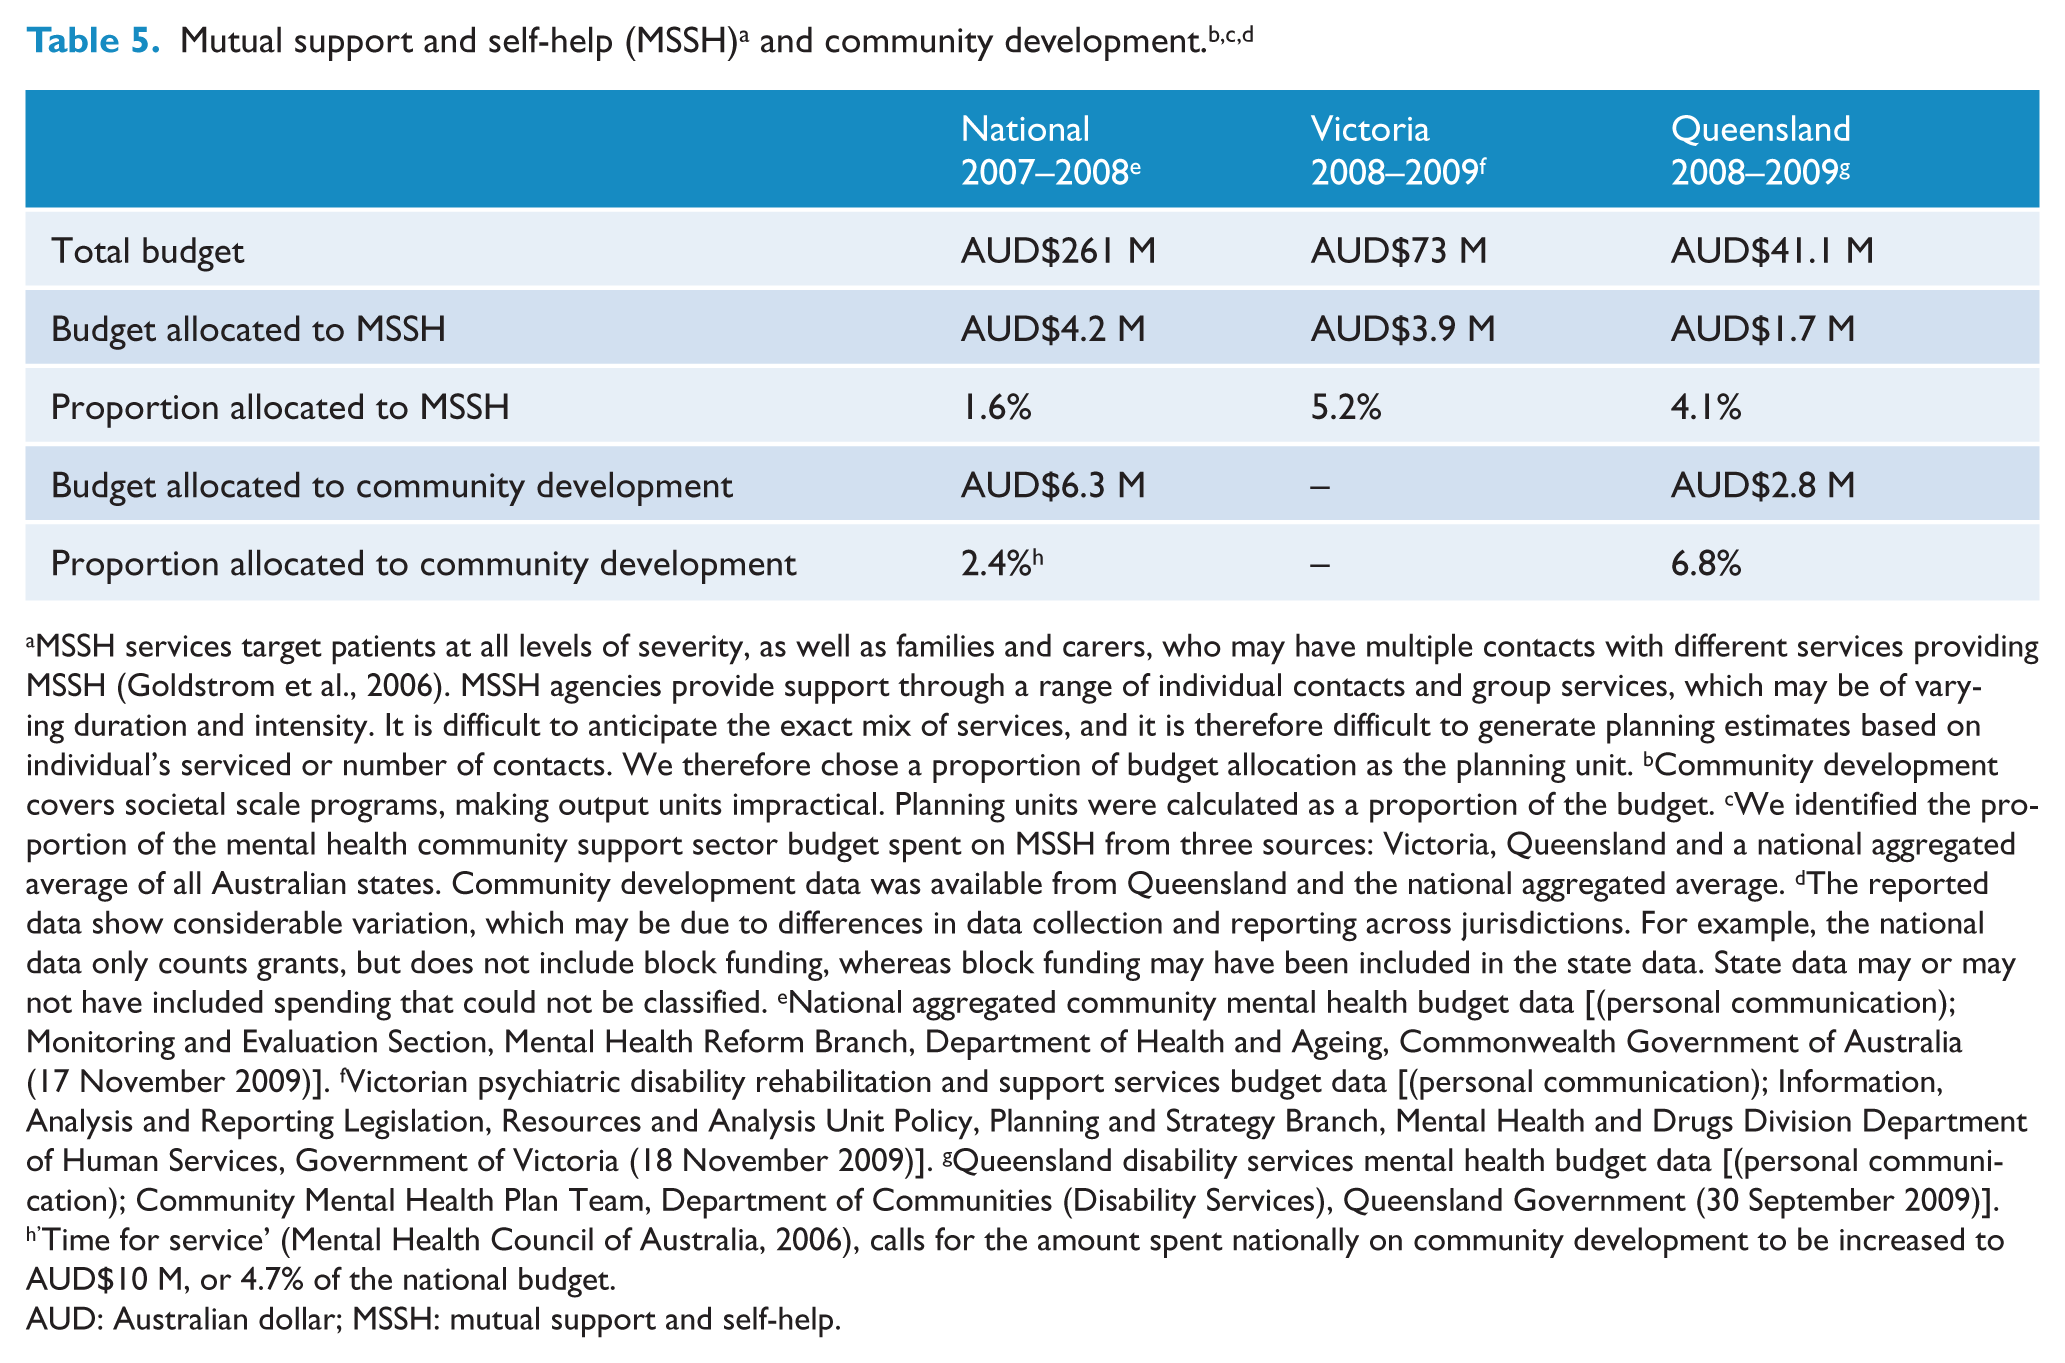
MSSH services target patients at all levels of severity, as well as families and carers, who may have multiple contacts with different services providing MSSH (Goldstrom et al., 2006). MSSH agencies provide support through a range of individual contacts and group services, which may be of varying duration and intensity. It is difficult to anticipate the exact mix of services, and it is therefore difficult to generate planning estimates based on individual’s serviced or number of contacts. We therefore chose a proportion of budget allocation as the planning unit. bCommunity development covers societal scale programs, making output units impractical. Planning units were calculated as a proportion of the budget. cWe identified the proportion of the mental health community support sector budget spent on MSSH from three sources: Victoria, Queensland and a national aggregated average of all Australian states. Community development data was available from Queensland and the national aggregated average. dThe reported data show considerable variation, which may be due to differences in data collection and reporting across jurisdictions. For example, the national data only counts grants, but does not include block funding, whereas block funding may have been included in the state data. State data may or may not have included spending that could not be classified. eNational aggregated community mental health budget data [(personal communication); Monitoring and Evaluation Section, Mental Health Reform Branch, Department of Health and Ageing, Commonwealth Government of Australia (17 November 2009)]. fVictorian psychiatric disability rehabilitation and support services budget data [(personal communication); Information, Analysis and Reporting Legislation, Resources and Analysis Unit Policy, Planning and Strategy Branch, Mental Health and Drugs Division Department of Human Services, Government of Victoria (18 November 2009)]. gQueensland disability services mental health budget data [(personal communication); Community Mental Health Plan Team, Department of Communities (Disability Services), Queensland Government (30 September 2009)]. h’Time for service’ (Mental Health Council of Australia, 2006), calls for the amount spent nationally on community development to be increased to AUD$10 M, or 4.7% of the national budget.
AUD: Australian dollar; MSSH: mutual support and self-help.
Supported accommodation
Supported accommodation is targeted at patients with SPMI with complex multi-agency needs. Planning estimates for supported accommodation were undertaken as part of the Queensland Plan for Mental Health 2007–2017 (Queensland Government, 2008). Published and grey literature relating to planning estimates for supported accommodation was reviewed. Definitional boundary issues were addressed to allow comparison of services. Estimates were applied to the Queensland context, taking into account that some source estimates were derived from divergent international service contexts. Detailed derivation of these estimates is outlined in Harris et al. (2012). We estimated that 4274 people require supported housing, constituting 1,397,126 residential days, and that a total of 88 beds per 100,000 population are required (Table 2). As the support element of supported accommodation is provided by support workers, we calculated the FTEs required per 100,000 to deliver the required service with personalised support as discussed below. Supported accommodation was broken down into: crisis accommodation and residential respite; residential rehabilitation (24-h staffed and < 24-h staffed); supported public housing and supervised supported hostels, as supported by the literature and by local best practice (Leff et al., 2009; Lloyd-Evans et al., 2009).
Personalised support
Personalised support is targeted at patients with SPMI with complex multi-agency needs. Estimates for personalised support are complex to derive. This is partially because they need to consider people who live in range of settings (residential setting, supported public housing, independent living arrangements, etc.), and who may receive this support by different means (by on-site or visiting staff) at different levels of intensity. To better reflect this range of services, we divided personalised support at four levels of intensity, consistent with the literature and local best practice (Edwards et al., 2009; Goodwin and Lyons, 2001; Meehan et al., 2011; Muir et al., 2007; NSW Department of Health, 2006; Seelig et al., 2008; Victorian Government Department of Human Services, 2008). A description of the intensity levels is given in the footnotes of Table 3.
Personalised support can be provided directly to patients living independently or as a package of support provided with supported accommodation. We estimated that, across all levels of support intensity a total of 11,048 patients would require 2,431,356 supported contact hours per year. This would require 9156 places, of which 42.6% would be tied to accommodation. We estimated that a total of 46.3 FTEs per 100,000 population would be required, with 12.7 FTEs per 100,000 population untied to accommodation and 33.6 FTE per 100,000 population tied to accommodation. Planning estimates for personalised support are outlined in Table 3.
Group support services
Group support services are targeted to patients with SPMI with complex multi-agency needs. We estimated that 11,048 patients would require 1,715,205 patient participation hours per year. This translates into 28.2 places per 100,000 population. We calculated that 6.9 FTEs per 100,000 population would be required to staff these places. Assumptions and calculation of planning estimates are further outlined in Table 4.
Mutual support and self-help
Mutual support and self-help is targeted at mental health patients at all levels of severity of disorder (mild, moderate and severe), as well as the families and carers of patients and others involved in their care (Goldstrom et al., 2006). Services within this category may receive funding from multiple sources, and may be provided by peers, volunteers or paid staff without lived experience. It is difficult to anticipate the exact mix of services, and is therefore difficult to generate planning estimates based on individuals serviced or number of contacts. As a result, output units could not be derived. A large proportion of staff in this category may be volunteers, making estimates of staffing resource targets impractical.
We identified the proportion of the mental health community support sector budget spent on mutual support and self-help from three sources: Victoria, Queensland and a national aggregated average of all Australian states. We estimated that a target should be set at 1.6%, based on the national average. Assumptions and calculation of planning units are further outlined in Table 5.
Community development
This component covers programs that operate at a societal level and aim to reduce stigma, raise knowledge about and awareness of mental health issues, and enhance the community’s capacity to accommodate and support individuals with mental illness. The target population is the Queensland community, including all people living with mental illness. Output units and staffing resource targets were not feasible for this component. Planning units were calculated as percentage of the mental health community support sector budget.
We identified the proportion of the non-governmental mental health services budget spent on community development in Queensland and across all Australian jurisdictions. We estimated that the target percentage of budget to be spent on community development should be set at 5%. This figure was based on discussions with the funding body. If other programs targeting illness prevention were included in this component the proportion of budget may need to be increased. Assumptions and calculation of planning units are further outlined in Table 5.
Discussion
The mental health community support sector is an important service provider for people living with mental illness. Compared with the public mental health sector, there has been a lack of clarity regarding services provided and resources required. This study is the first of its kind to yield a comprehensive set of planning estimates for the community mental health support sector.
Summary of findings
We have estimated that a resource target of 53.2 FTE support workers per 100,000 population in Queensland are required to meet service needs for supported accommodation, personalised support and group support services. This does not include the additional staffing resources that would be required for mutual support and self-help, supported employment and community development. To put this resource target in context, 70 FTEs are required to meet staffing needs in the public ambulatory mental health sector in Queensland (Harris et al., 2012).
The distribution of resources within the sector depends on the target population. We have given greater priority to the needs of those with SPMI, as they have the highest burden of illness. Given the high prevalence of homelessness in this group (Folsom et al., 2005), supported accommodation services have been prioritised. Almost three quarters (72.0%) of the FTEs resourced for personalised support will be given in conjunction with supported accommodation. The group with intensive support needs is estimated to use almost half of the FTE resources for personalised support (46%). These resource proportions could alter significantly if policymakers chose to focus on less severely impaired groups.
Strengths and limitations
The planning estimates suggested here are based on an extensive review of the current planning literature, interpretation of trends in national and international planning, community consultation, expert opinion and value judgements as required. In the absence of other planning information for the community mental health support sector, they provide a first step to guide governments and policymakers.
The estimates are aligned with those previously developed by our group (Harris et al., 2012) for the Queensland Plan for Mental Health 2007–2017 (Queensland Government, 2008). By aligning the resource targets across the public and community mental health sectors, a more comprehensive and complementary approach to planning estimates can be achieved.
There are, however, a number of caveats that should be kept in mind when interpreting the estimates presented here. First, there is a lack of data to guide many aspects of these estimates. However, we believe that waiting until more data become available is a poor excuse for not describing the services provided by the sector and for failing to attempt estimates of the resources needed by the sector. We believe the sector has long been disadvantaged compared to the clinical services sector because of a failure to attempt the planning exercise undertaken in this paper.
We used a population-based normative approach to generate estimates. This approach examines epidemiological data on population prevalence of disorders and combines it with existing evidence on service delivery. It has been used in the Queensland Plan for Mental Health 2007–2017 (Harris et al., 2012) and the UK National Service Framework for Mental Health (Boardman and Parsonage, 2007). We examined how other jurisdictions approach the structure and funding of the community mental health support sector and looked for examples of best practice. At times, even this level of information was unavailable, and expert opinion was relied upon. As a result, these estimates are imprecise and will need to be tested against new evidence, policy priorities and planning trends.
Second, the estimates are provided only for adults, as this group is the main recipient of services provided by the community mental health support sector. Estimates were not made for other age groups or special needs populations such as forensic or indigenous patients. Third, the estimates are intended to guide planning at state or national level, and are not intended for small populations. Fourth, the conversion of planning targets in some service components to FTEs is not intended to imply that services should be input-funded on the basis of FTEs. FTEs are used only to show the indicative workforce required to reach capacity.
Despite these limitations, the planning estimates provided here are the best that can be achieved with the information available. They provide a basis on which to build future estimates and create an opportunity for debate around how planning in the mental health community support sector should be undertaken.
Comparisons to other studies
There are relatively few published examples of planning estimates for the community mental health support sector. Benchmarks in the published and grey literature focused on supported accommodation and varied from 33 to 131 beds per 100,000 population. The estimate of 88 beds per 100,000 population calculated in this study and by Harris et al. (2012) were comparable with published benchmarks in another Australian state, South Australia (64–72 beds per 100,000 population) (South Australian Social Inclusion Board, 2007) and New Zealand (70 beds per 100,000) (New Zealand Mental Health Commission, 1998).
Benchmarks from Tolkien II (51 beds per 100,000 population) were not comparable as they are not inclusive of all disorders and do not include crisis accommodation and supported public housing (Andrews et al., 2006). Benchmarks from the UK (60 beds per 100,000 population) did not include crisis accommodation and residential rehabilitation (Boardman and Parsonage, 2007), while Quebec benchmarks (131 beds per 100,000 population) included services not currently provided in Queensland, such as foster family beds (Lesage et al., 2003; Lesage et al., 2008). Comparison with published benchmarks was further hampered by variation in service definitions between jurisdictions and underestimation of benchmarks in health department planning reports where responsibility for supported accommodation fell to a different department.
The second Australian survey of people living with psychotic illness reported that NGO services were well used, with one in three participants accessing both public mental health services and NGO services in the previous year and one in 10 using NGO services only (Morgan et al., 2011). Consumers valued NGO services, with 90% reporting that programs were helpful. One in three group NGO service users attended independent daily living skills programs and two in three individual NGO program users accessed emotional support services. These reported results fit broadly with our estimates of service usage.
Implications for policy
The mental health community support sector is now a major provider of services for people with mental illness and is likely to continue to grow. In the past 15 years, funding has increased from 2% on average of the state mental health budgets in 1992 to 8.3% in 2008 (Australian Institute of Health and Welfare, 2010; Department of Health and Ageing, 2010b). In New Zealand, NGO services already comprise 28% of the mental health budget (Mental Health Commission, 2006).
When compared to public sector clinical mental health services, the mental health community support sector has lacked clarity surrounding what services are provided and the quantity of resources required to provide these services. This paper aims to provide estimates of resource targets to help guide the growth of this sector in an accountable way. A planning approach to the community mental health support sector creates an opportunity for the public and community systems to be harmonised. This aligns with the call by the National Mental Health Policy 2008 for a ‘seamless and connected care system which is patient focused and recovery oriented and where people are supported to engage with the community’ (Australian Health Ministers, 2009). Harmonising planning can avoid risks of service duplication or gaps in service, particularly for the most difficult-to-engage patients, create patient choice and can improve access to appropriate and adequate community support that can avert hospitalisation, ameliorate bed block and reduce relapse (Lloyd-Evans et al., 2009).
Future directions
On a national level, recent reforms to the Australian mental health system have raised questions about what is an adequate level of funding for mental health NGOs and how these resources should be allocated (Council of Australian Governments, 2006). There is a need for nationally agreed planning targets for community mental health support services. We feel that the development of a nationally endorsed taxonomy of services and associated planning targets should be a priority. National standards will allow greater transparency and assist in ensuring that patient and community needs for recovery-oriented community support services are met. This is consistent with calls in the Fourth National Mental Health Plan 2009–2014 to develop a national service planning framework for the full range of mental health services, including the clinical and mental health community support sectors (Department of Health and Ageing, 2009).
Further work is required on these planning estimates. They provide a snapshot of the sector at the present time and are not intended to be definitive. These planning estimates are a first attempt, and aim to stimulate discussion and further research to increase the evidence base and refine resource targets. They need to be tested in the real world by mental health community support sector practitioners. As the target population and services delivered change, the underlying assumptions necessary for planning estimates for the mental health community support sector will need to be adjusted. Future planning estimates will need to be revised in step with the evolution of the mental health community support sector.
Footnotes
Acknowledgements
The authors would like to acknowledge the assistance of Ivan Frkovic and the Queensland Department of Communities, Community Mental Health Branch.
Funding
This research was funded by the Queensland Department of Communities, Community Mental Health Branch.
Declaration of interest
The authors report no conflicts of interest. The authors alone are responsible for the content and writing of the paper.