
Abstract
Introduction
Routine outcome monitoring (ROM) consists of evaluating psychiatric treatment by repeatedly assessing patient-level outcomes. Its primary goal is to improve efficacy and quality of care (Slade, 2002); a secondary goal is to empirically study mental health outcomes to supplement findings of randomized controlled trials (Holloway, 2002), and thus to bridge the gap between the research world and the real world (Harrison and Eaton, 1999). Although ROM is being widely implemented, several important problems are involved in basing valid statistical inferences on ROM data (Gilbody et al., 2002; Young et al., 2000).These include reporter bias, insufficient characterization of interventions, and the impact of potential confounding variables, such as treatment duration.
Differences in treatment duration may be influenced by several factors, such as patient attrition (i.e. patients who leave care in an untimely fashion). A study by Herinckx et al. (1997) showed that drop out over time in community mental health care ranged between 32 and 57%. In the context of assertive community treatment (ACT), a recent study by Mohamed et al. (2010) showed that 42% of patients terminated health care after 3 years of treatment.
Attrition has been found to be related to patients’ level of functioning, their motivation for treatment, and their satisfaction with services (Joe et al., 1999; Primm et al., 2000; Romney, 1988; Sue et al., 1976; Young et al., 2000). When outcomes data are used to evaluate the performance of mental healthcare services, biases caused by differences in treatment duration may lead to invalid conclusions, particularly when patients leave care because their level of functioning has changed (i.e. outcome-dependent). This means that patients whose treatment duration was shorter may have been different at baseline and have different outcomes than those who remain in care (Reynolds et al., 2005). If patients leave care after a relatively short treatment because their condition is worsening, this may lead the success of their treatment to be overestimated (Bond et al., 1995). Conversely, if they leave care when they have completely or partly recovered, treatment success may be underestimated (Young et al., 2000), thereby filtering patients who remain in need of long-term treatment as they have not yet recovered from their psychiatric condition. In both cases, attrition can produce selection bias, which can in turn impact benchmarking, making it important to be acknowledged.
We therefore wished to gain an insight into the relationship between treatment duration and clinical outcome in the context of ACT. We did so by exploring the relationships between the duration of ACT and clinical outcome variables.
Methods
Setting
The study involved patients from six ACT teams in the city of Rotterdam, The Netherlands. There were three selection criteria for treatment by an ACT team: (a) age 18 and older, (b) having a severe mental illness (usually a psychotic or bipolar disorder, with or without a comorbid, substance use-related disorder), and (c) lack of motivation for treatment at the start of ACT, which made assertive outreach necessary. The fidelity of ACT programmes can be assessed using the Dartmouth Assertive Community Treatment Scale (DACTS) (Bond et al., 2001; Salyers et al., 2003; Teague et al., 1998), whose fidelity score showed that our six teams had implemented ACT moderately successfully (Kortrijk et al., 2010).
Data collection
Data were collected as part of a ROM procedure used in clinical practice to discuss treatment course and outcome between patient and clinician. ROM assessments, which were planned to take place on entry to the service and every 6 months thereafter, were performed by independent raters, most of them psychologists. The actual saturation of ROM records in our data set showed that, on average, the ROM assessments had taken place 9 months apart (SD = 3.6). ROM data collection was approved by the Dutch Committee for the Protection of Personal Data. Data for this study refer to the period from January 2003 to February 2009; they were used anonymously.
Tools
We collected sociodemographic data on gender, age, and level of education, and on the diagnosis made by the ACT team psychiatrist.
Four tools were used. The first was the Global Assessment of Functioning (GAF) scale (World Health Organization, 1992), which was divided into a symptom scale (GAF-S, range 1–100) rating the global symptom severity, and a functioning scale (GAF-F range 1–100) rating the level of impairment of psychosocial functioning (Pedersen et al., 2007).
To assess psychosocial functioning more specifically, we used the Health of the Nation Outcome Scales (HoNOS), which was originally developed as a standardized assessment tool for routine use by mental health services. It consists of 12 five-point clinician-rated scales, each ranging from 0 (no problem) to 4 (severe/very severe), and thus yielding a total score from 0 to 48. The psychometric properties of the English and Dutch HoNOS versions have been found to be acceptable (Mulder et al., 2004; Wing et al., 1998). For the present study, we used only HoNOS total scores. The HoNOS covers the following domains:
Overactive, aggressive, disruptive or agitated behaviour;
Non-accidental self-harm;
Problem drinking and drug-taking;
Cognitive problems;
Physical illness and disability;
Hallucinations and delusions;
Depressed mood;
Other psychological symptoms;
Relationship problems;
Problems with activities of daily living;
Problems with living conditions;
Problems with occupation and activities.
Motivation for treatment was assessed using one item adapted from the Severity of Psychiatric Illness scale (Lyons, 1998; Mulder et al., 2005); it was scored in five categories (score range 0–4) similar to those in the HoNOS. The motivation for treatment scale was scored on the basis of an interview with the patient and the clinician.
Finally, we assessed satisfaction with services using an item adapted from the Manchester Short Assessment of Quality of Life (MANSA) scale (Priebe, 1999). This item was scored on a seven-point scale similar to the MANSA scale from ‘couldn’t be worse’ to ‘couldn’t be better’ (scored 1–7) (Van Os et al., 2001).
Statistical analyses
Assessments (including records of missed assessments) were handled using a blocked design of six-monthly assessments. On the basis of the number of assessments and time since start of ACT, duration of ACT was trichotomized into short duration [two to three ROM assessments, with a mean treatment duration since first assessment of 11.6 months (SD=6.1)]; medium duration [four to six ROM assessments, with a mean treatment duration since first assessment of 26.9 months (SD=7.3)]; and long duration [seven or more ROM assessments, with a mean treatment duration since first assessment of 44.06 months (SD=7.1)]. We used ANOVA and chi-square tests to analyse differences in diagnosis and baseline characteristics between patients with different treatment durations.
To clarify the relationship between the clinical variables, Pearson’s product-moment correlations were calculated; this enabled us to estimate the bivariate associations of the determinants (gender, age, and level of education, and, at baseline, GAF-S and GAF-F, HoNOS total score, motivation for treatment, and satisfaction with services) and the outcome variables (GAF-S and GAF-F, HoNOS total score, motivation for treatment, and satisfaction with services at the last assessment).
To unravel the interrelationships between determinants and outcome variables, we used structural equation modelling (SEM). This statistical tool, which performs prediction analyses and solves several equations simultaneously, makes it possible to unravel interdependencies between determinants and outcome variables. It is used in clinical research to visualize the interrelationship between determinants and outcome variables, and to estimate the magnitudes of the effects of the determinants. Although there are no absolute standards concerning sample size in relation to model complexity, it is desirable to have a minimum of 10 patients for each parameter to be estimated. The modelling was based on the data of 569 patients. In the final model, the number of clinical and statistical relevant parameters to be estimated equaled 25. As a result, the patient/parameter ratio turned out to be greater than 10:1, which indicates a sufficiently large sample size.
When outcomes data are used to compare the performances of mental health care, it can be assumed that the interdependencies between the relevant parameters are all the same, even for patients with different treatment durations. That is, that they ‘behave’ identically over time. If they do not, patients with different treatment durations represent different groups, which should be assessed for their outcomes separately. To test this assumption, we examined several SEM models to identify the best performing model using different treatment duration categories; our purpose was to establish whether it was acceptable to impose equality constraints between the categories of treatment duration for the autoregressions or cross-regressions in the model. We started with a model in which the autoregressions between the determinants and outcome variables (identical variables) were constrained to be equal across patients with different treatment durations. Next, we tested a model in which the cross-regressions between the determinants and outcome variables (non-identical variables) were constrained to be equal across patients with a different treatment duration. Finally, we tested a model in which no equality constrains were imposed.
In the modelling process we started with the following determinants: gender, age, level of education, GAF-S, GAF-F, HoNOS total score, motivation for treatment, and satisfaction with services at baseline; and with the following outcome variables: GAF-S, GAF-F, HoNOS total score, motivation for treatment, and satisfaction with services at the last assessment. We used maximum likelihood estimation, as it is a statistically efficient method (Jöreskog, 1973), for fitting the statistical model to the data, and for providing estimates for the model’s parameters. To allow parsimonious modelling (thereby reducing complexity), we also determined whether it was acceptable for each path to be removed while remaining a good fit. We started at the end of the model, guiding this process by the Modification Index (Sörbom, 1989). We used standardized regression coefficients as estimates of the magnitude of the effect of the path; theoretically, these ranged from -1.00 (perfect negative association) to 1.00 (perfect positive association). For each model, we evaluated the fit by examining the individual parameter estimates, measures of overall fit, and detailed assessment of fit (fitted and standardized residuals and modification indices).
To evaluate the model fit, we used the following performance measures:
Chi-square for model fit (low and non-significant values of the chi-square are desired);
Chi-square/degrees of freedom ratio (a value < 2.0 was predefined as being acceptable);
Comparative fit index (CFI);
Tucker–Lewis index (TLI) (CFI and TLI: values of > 0.95 suggest a good fit; high values are desired, but values > 1.0 indicate over-identification);
Root mean square error of approximation (RMSEA; a value < 0.05 indicates a close fit);
Standardized root mean square of residuals (SRMSR; a value of < 0.05 indicates a good fit).
The SPSS statistical package version 15.0 (SPSS, Inc., Chicago, Illinois, USA) was used for the chi-square test, ANOVA, and the calculation of correlation coefficients. M-plus version 5.2.1 (Muthén and Muthén, Los Angeles, California, USA) was used for SEM. Results of individual parameters were regarded as statistically significant if two-sided p was < 0.05.
Results
Patients
Five hundred and sixty-nine patients were enrolled, 77% of them male. The mean time patients spent in contact with services was 21.7 months (SD = 13.4; range: 3–67). The mean age at first assessment was 40.3 years (SD = 11.2; range: 18–79). The diagnosis was schizophrenia or other psychotic disorder for 71.7% of all patients; 34% were diagnosed with a coexisting substance use-related disorder. A small proportion of patients (5.6%) were diagnosed with an affective disorder (first listed); in 4.7%, the diagnosis or condition had been deferred or was missing.
Clinical characteristics
Table 1 shows the association between patient characteristics and baseline values and treatment duration. There were statistical differences in diagnosis and other baseline patient characteristics. Fewer patients with shorter treatment duration were diagnosed with a psychotic disorder, substance use disorder or combination of both (dual diagnosis). Patients with a longer treatment duration had lower GAF-S and GAF-F scores at baseline. The same was found for the baseline values of the HoNOS total scores, which were lower (i.e. there were fewer problems) for patients with a shorter treatment duration than for those with a long duration of ACT.
Sociodemographic and clinical characteristics of patients treated in ACT teams
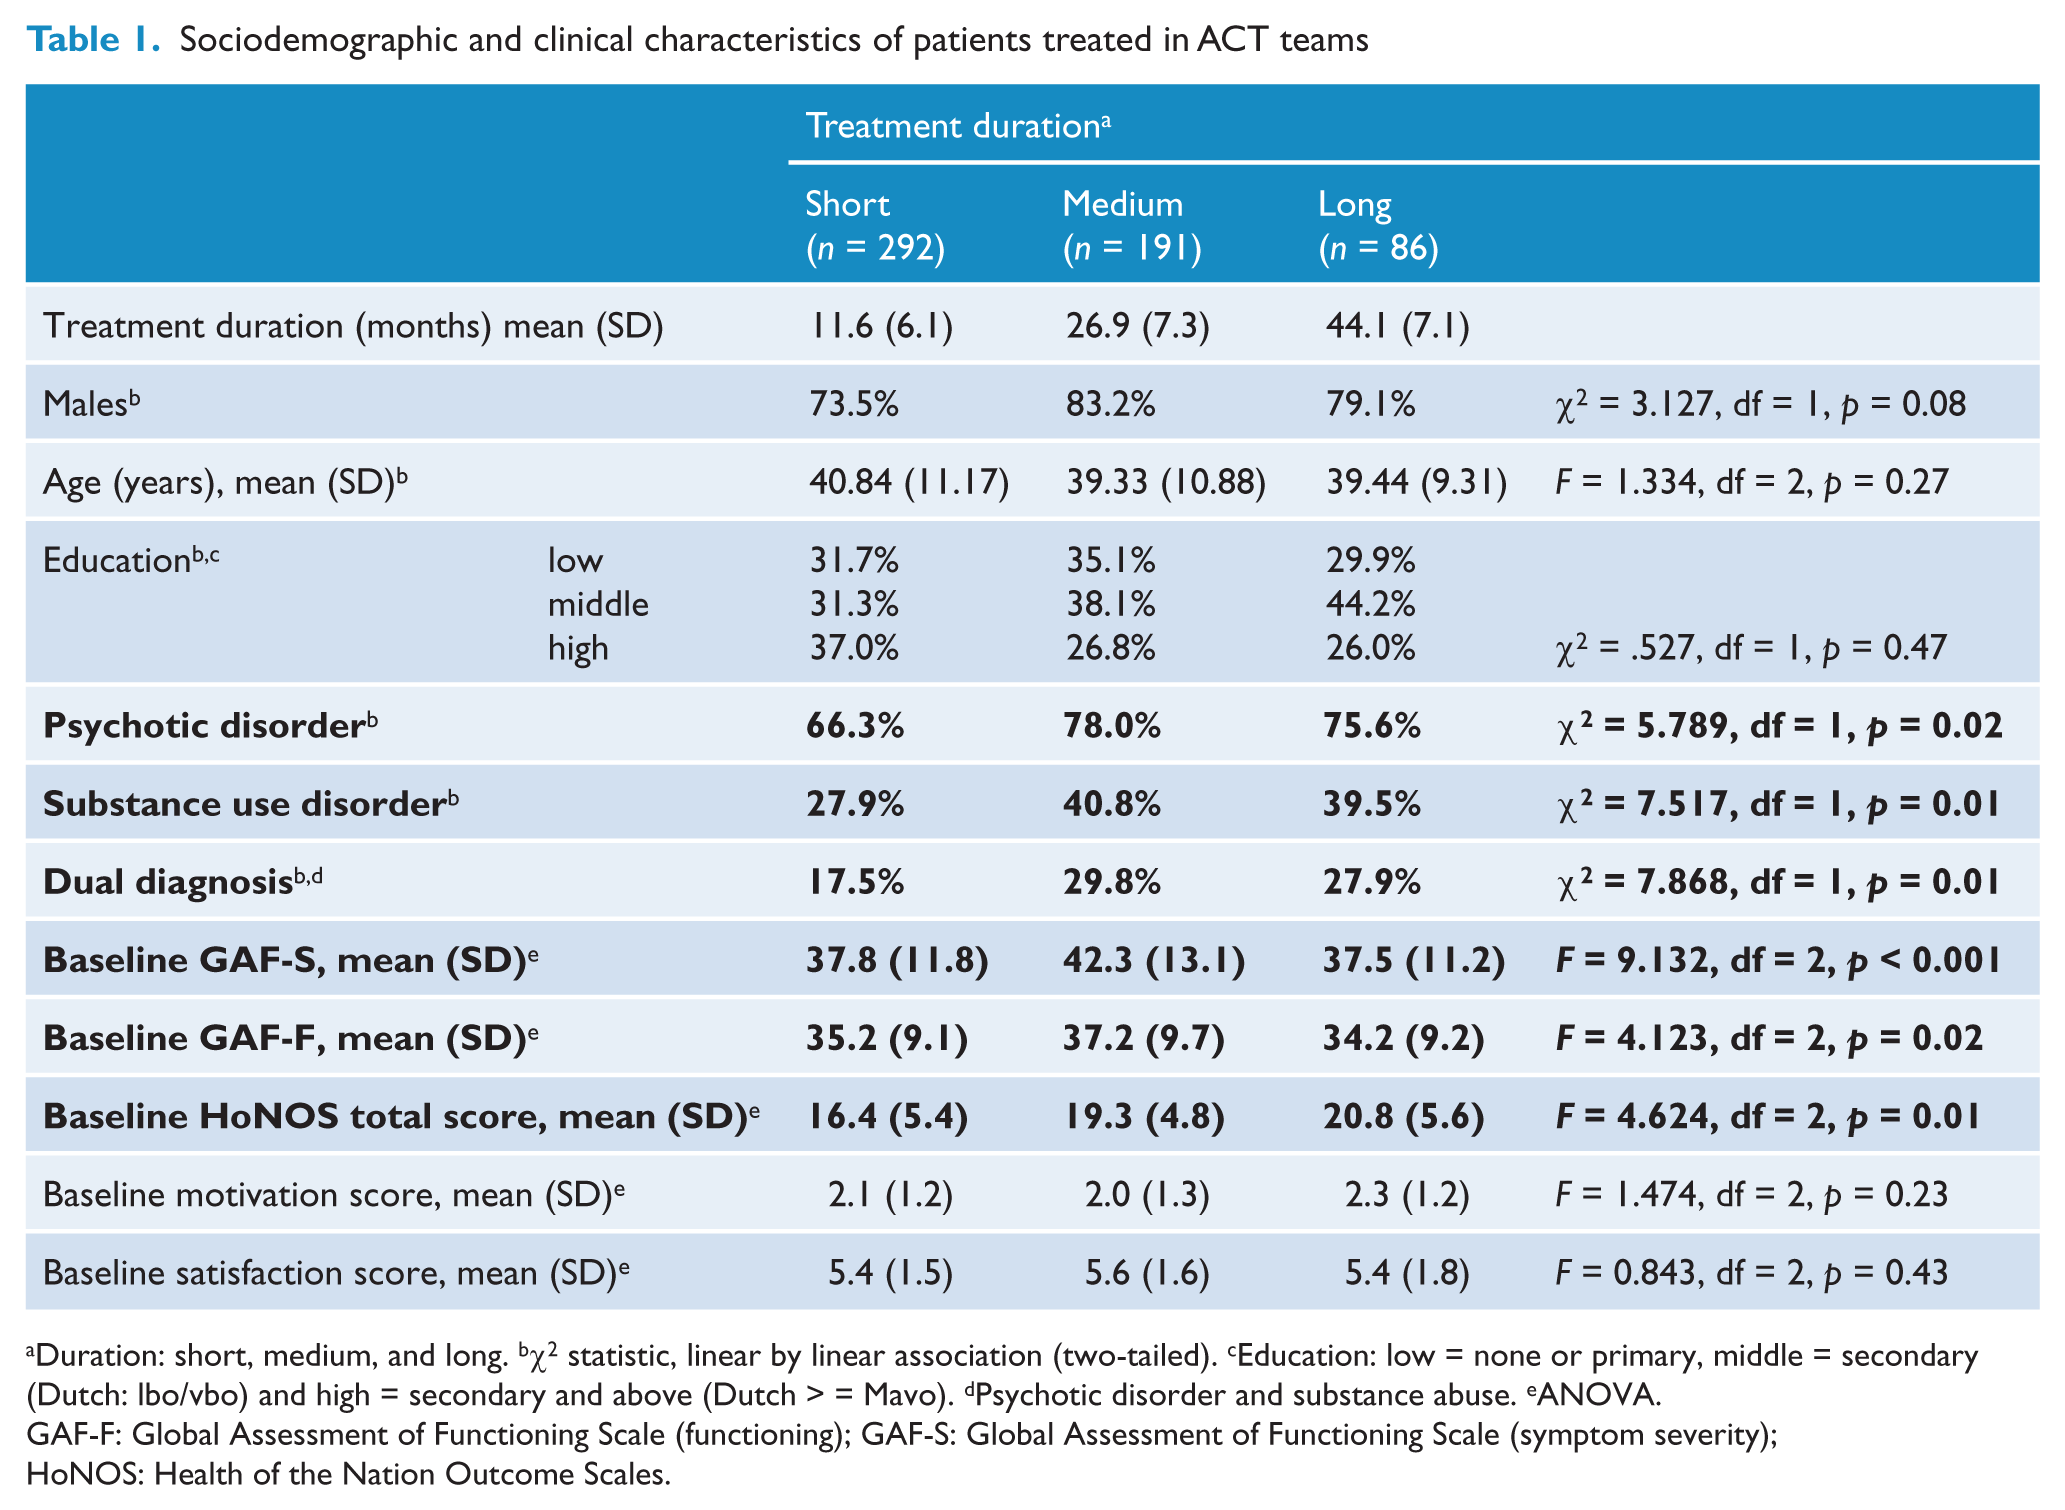
Duration: short, medium, and long. bχ2 statistic, linear by linear association (two-tailed). cEducation: low = none or primary, middle = secondary (Dutch: lbo/vbo) and high = secondary and above (Dutch > = Mavo). dPsychotic disorder and substance abuse. eANOVA.
GAF-F: Global Assessment of Functioning Scale (functioning); GAF-S: Global Assessment of Functioning Scale (symptom severity); HoNOS: Health of the Nation Outcome Scales.
Interrelations of determinants and outcome variables
Table 2 presents Pearson’s product-moment correlation coefficients of determinants (demographic and clinical variables at baseline) and outcome variables (the last assessed clinical outcome variables). The correlations of the demographic variables with the other determinants and with the outcome variables were only small. As expected, the autocorrelations (i.e. correlations of two identical variables assessed at different moments) of all outcome variables turned out to be both substantial and significant (Table 2). There were also some substantial cross-correlations (i.e. correlations between two different variables assessed at different moments).
Correlation matrix of determinants and outcome variables a
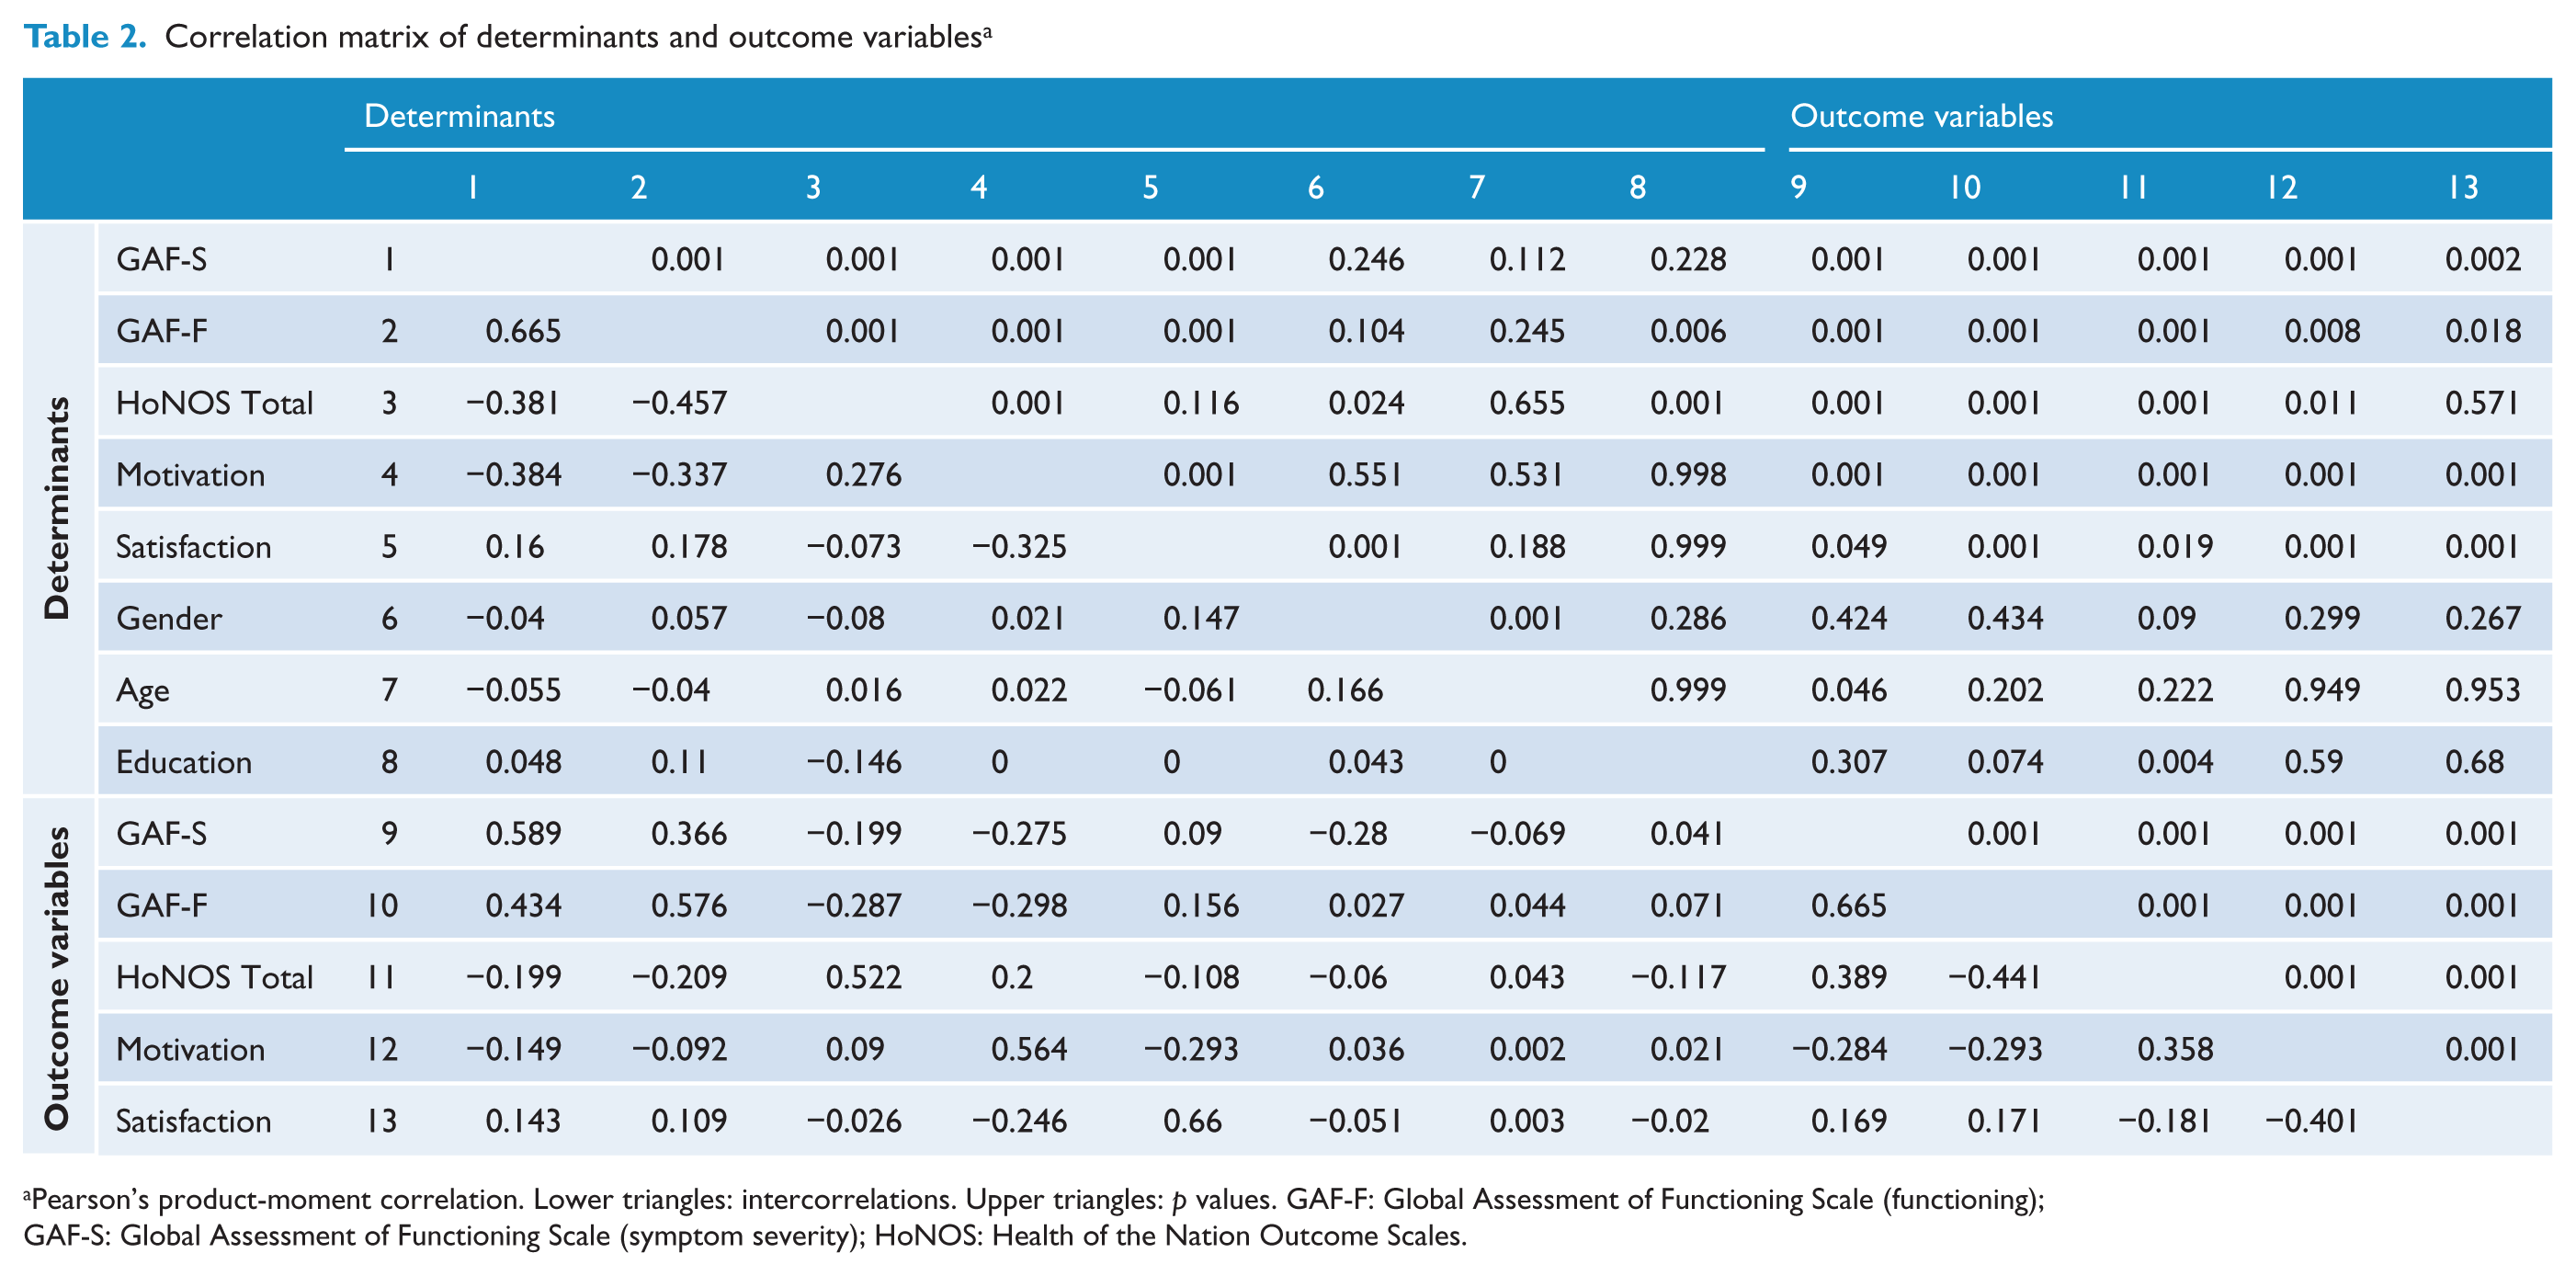
Pearson’s product-moment correlation. Lower triangles: intercorrelations. Upper triangles: p values. GAF-F: Global Assessment of Functioning Scale (functioning);
GAF-S: Global Assessment of Functioning Scale (symptom severity); HoNOS: Health of the Nation Outcome Scales.
Treatment duration models
Table 3 shows the performance measures of the treatment duration models subjected to SEM analysis. To ascertain whether the autoregressions could be constrained to be equal for the three categories of treatment duration, we tested the first model that had some clinically and statistically relevant cross-regressions and autoregressions. This model was rejected because of the significant chi-square value for model fit (χ2= 152.17; df = 55; p = 0.001).
Model performances of determinant variables in relation to outcome variables, distinguished by duration of treatment
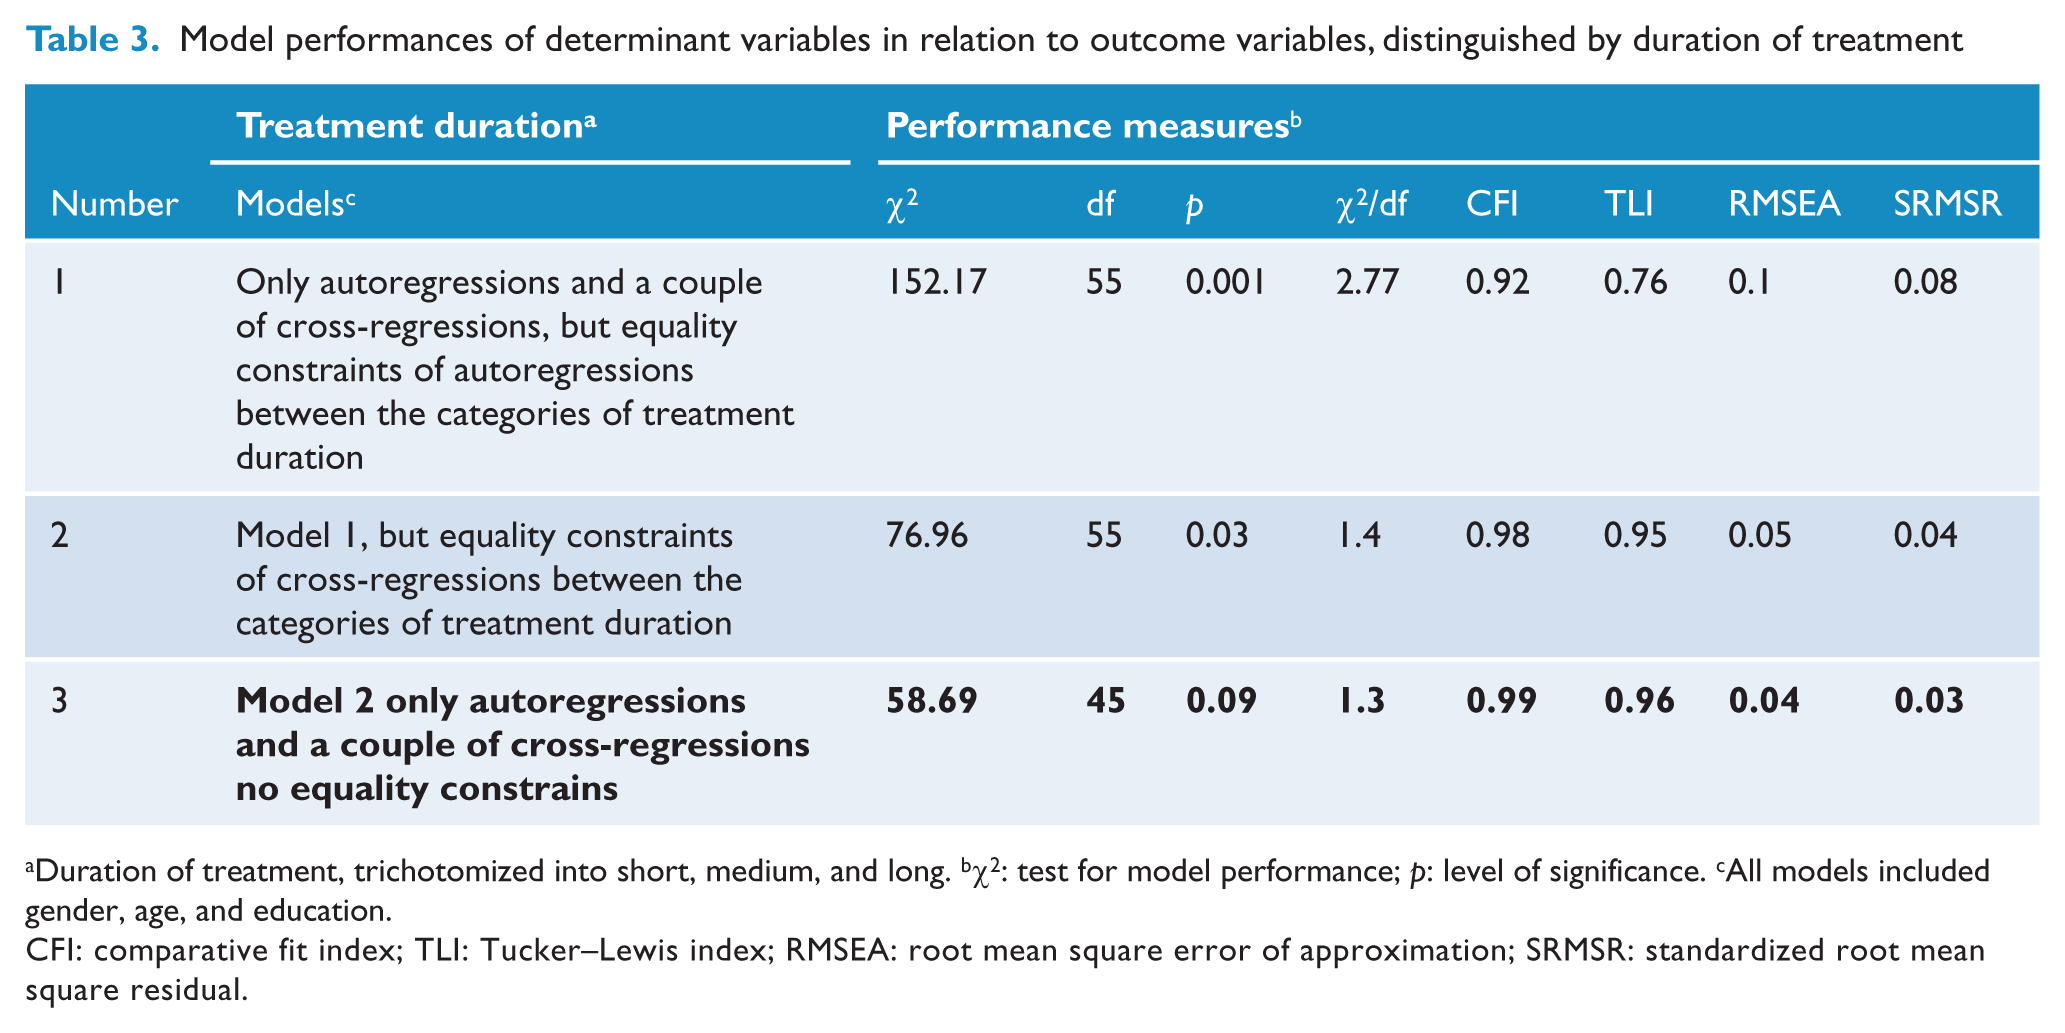
Duration of treatment, trichotomized into short, medium, and long. bχ2: test for model performance; p: level of significance. cAll models included gender, age, and education.
CFI: comparative fit index; TLI: Tucker–Lewis index; RMSEA: root mean square error of approximation; SRMSR: standardized root mean square residual.
The second model was similar to the first, but now the cross-regressions were constrained to be equal for the three categories of treatment duration. This model also showed a significant chi-square for model fit (χ2 = 76.96; df = 55; p = 0.03). The model fit was probably better because the autoregressions were no longer constrained to be equal.
The third model tested was similar to the first, but now with no constraints regarding the cross- and autoregressions between the different treatment duration categories. This resulted in an adequate model fit, as the chi-square test for model fit turned out to be non-significant (χ2 = 58.69; df = 45; p = 0.09). The third model was thus considered the best-performing model, as it showed that associations between the determinants and outcome variables were different between the three treatment duration groups. This reflects significantly different treatment courses, each course associated with a different treatment duration, among distinguishable patient groups in ACT teams. To differentiate between the three categories of treatment duration, Figure 1 shows the standardized coefficients of model 3.
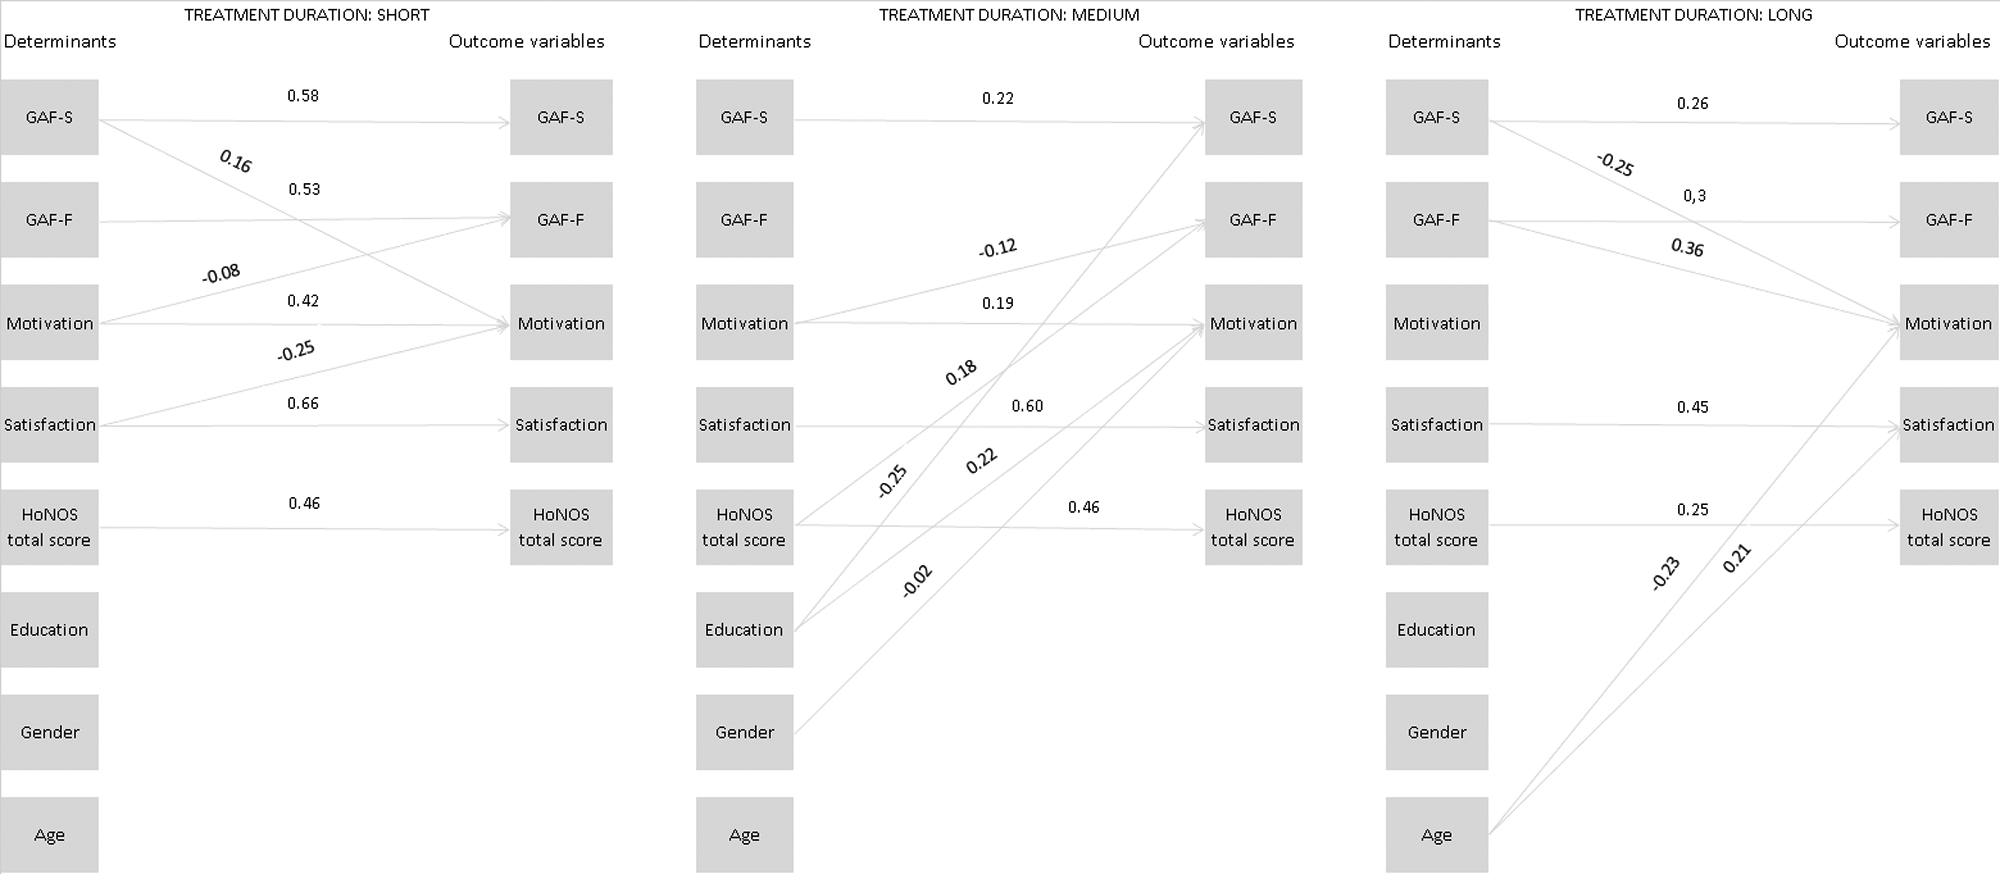
Visualization of the effects of the determinants and outcome variables. Groups were defined on the basis of treatment duration. The lines represent standardized regression coefficients (autoregressions and cross-regressions) for each of the three categories of treatment duration. GAF-F: Global Assessment of Functioning Scale (functioning); GAF-S: Global Assessment of Functioning Scale (symptom severity); HoNOS: Health of the Nation Outcome Scales.
Discussion
We used a large study population (569 ACT patients) to assess the impact of treatment duration on the interpretation of ROM data. Our results showed that diagnosis, clinical characteristics and interdependencies among baseline and outcome variables differed between patients who had undergone long-term ACT and those whose ACT services had been shorter. This indicates that ROM data sets, such as those used in our study, contain distinct patient subpopulations that may need to be analysed separately for their outcomes.
Duration of ACT
Patients’ first contact with mental health services started about a decade before they entered ACT (Kortrijk et al., in press). Our results demonstrate a clear association between duration of ACT and patient characteristics: longer treatment was associated with higher numbers of patients with a psychotic disorder, with substance use-related disorder, with a combination of both (dual diagnosis), and with more severe psychosocial problems at baseline.
Unlike patients without a comorbid substance use disorder, dual-diagnosed patients usually had a poor prognosis (Green et al., 2007; Kortrijk et al., 2010; Mueser et al., 2000) This was due to higher risks of poor response to pharmacological treatment, non-adherence to psychotropic medication, increased symptom severity, relapses, hospitalizations, infectious illnesses, suicide, victimization, violence, incarceration, and homelessness (Abram and Teplin 1991; Bartels et al.,1992; Dixon, 1999; Swoffoord et al., 1996). It is therefore understandable that those with high levels of psychosocial problems at the start of treatment and those with poor prognosis both remain in ACT.
There are several more reasons that a particular patient would have been in either the short-, medium- or long-duration treatment group. The first involves the time a patient was admitted to ACT. Irrespective of their demographic and clinical characteristics, a patient admitted in 2008 would by definition have been treated for a shorter period (and have had fewer ROM assessments) than one admitted to ACT in 2003. Despite this, we found significant differences in patient characteristics among patient groups with different treatment durations.
The second reason is that patients could drop out of ACT for several reasons – because they no longer needed ACT and had been referred elsewhere, for example, or because the ACT team had lost contact with them for other reasons (see the Strengths and Limitations section of this paper).
As our use of SEM showed, the best-performing SEM model for treatment duration indicated that the auto and cross-regressions were not equal across groups of different treatment duration (i.e. short, medium, or long). This means that the interrelationships between the clinical outcome variables and their relation with patient characteristics varied from one category of treatment duration to another. These differences between the short-, medium-, and long-treatment duration groups are unlikely to have been caused solely by longer treatment duration: the SEM analyses showed a mix of decreasing and increasing sizes of cross-relationships and autorelationships (i.e. different interdependencies for each treatment duration group). Having combined these findings, we argue that each of the groups – each of whose ACT was of a different duration – represents a distinct patient subpopulation that should thus be regarded as a heterogeneous population. No group should be analysed with all the others as if they all comprised a homogeneous group.
Implications
In our judgment, our results provide evidence that patient characteristics and the duration of follow-up should be taken into account when ROM data are used.
While Young et al. (2000) suggest that the problem of informative drop out should be overcome by collecting outcome data from patients who have left care, we feel that it is not only time-consuming to correct for biases by collecting outcome data, but also inconsistent with the primary goal of ROM. As money and clinician time are required to collect outcome assessments from patients who have left care (Walter et al., 1998), such a procedure would be unlikely to be implemented as part of a ROM system. Neither is it likely that these data will actually correct for biases, as these patients no longer receive the same treatment.
A more practical way of dealing with this problem would be to analyse the outcome data in more homogenous cohorts – on the basis, for example, of treatment duration. This would produce analyses that were more accurate and less biased. Policymakers, researchers, and clinicians should note that if outcome data were analysed over a long period, it would produce analyses of patients whose serious and chronic psychiatric condition required long-term treatment. Keeping this in mind, other more valid questions could then be formulated in the context of ROM. If account were taken of treatment duration and patient characteristics, one might thus ask not how effective 3 years of ACT is, but what the outcomes are of the patients who are treated in it.
Thus, if one does not consider baseline patient characteristics, treatment duration, and drop-out scores, it is impossible to compare measures such as the HoNOS in a ROM data set of patients in standard community care with HoNOS scores of patients in ACT, as the drop-out rates of the former may be higher than those of the latter (Sytema et al., 2007). When outcome data from a patient data set – of ACT patients, for example – was analysed over a long period of time, it would be possible to pay less attention to patients whose treatment duration was shorter. Because such patients differ from those whose treatment was longer, no data are randomly missing. In addition, if a patient’s condition deteriorates and the patient therefore leaves care (because, for example, they were committed for a long period), patients may not all be assessed at that critical time point of leaving. In such cases, missing data in the ROM data set would, once again, not be random (and may not even depend on the observed outcome data). This also suggests that the impact of treatment duration on the interpretation of the outcome data may be different if the outcome data includes data from less severely mentally ill patients who did not require ACT for a long period. In our opinion, outcome data would thus be analysed more accurately if the analyses accounted for time since start of treatment. By creating more homogeneous subgroups, this would deal with one of the problematic confounders in a manner that was consistent with the primary goals of ROM.
Strengths and limitations
Our study is characterized by a number of strengths, including a large study population of difficult-to-engage patients and the use of SEM as a statistical technique for modelling complex pathways in our analysis. By unravelling the relationships between variables in a ROM data set from patients receiving ACT, we were able to visualize complex pathways, thereby making possible biases more easily comprehensible. These insights into ROM data may provide points of departure for the formulation of research questions relevant to evaluating the performance of mental health services.
However, this study has several limitations. First of all we stress that, in the classification system for treatment duration in ACT services in Rotterdam, it makes sense to post-stratify treatment duration the way we did to differentiate between patient groups. However, these treatment duration periods may not necessarily be identical for other services in other places. Our categorization of patient groups is therefore fairly arbitrary. Similarly, because it is unknown beforehand how long patients with a short duration of ACT will remain in treatment, heterogeneous groups may still arise.
Our research focused on treatment duration and did not include information on attrition and the reasons for it. It is important to know whether patients stopped ACT because their condition improved, or because it worsened, leading to consequences such as long-term hospitalization. To generate a more comprehensive understanding of selection biases in ROM procedures, future studies should examine attrition and its causes, and relate them to treatment duration and clinical outcome.
With regard to the modelling process, we acknowledge that the position of the variables might be debated. In our model, the demographic variables were placed adjacent to the determinants, allowing a confounding impact on the outcome variables. The alternative would be a non-confounding approach that used the demographic variables as a determinant variable for baseline measures. We should also mention that the SEM analyses were based on the manifest variables – i.e. those observed. Due to its complexity, we refrained from ideal modelling which is latent variable modelling.
We also feel that the results cannot be generalized to other, non-severely mentally ill (SMI) populations. Our SMI patients were receiving long-term treatment in the context of ACT: it is inherent to this that they lacked motivation for treatment at the start of ACT, and that they had a severe mental illness. If our outcome data had included data on patients in whom shorter treatment was more likely, such as those with depressive or anxiety disorders, treatment duration might have had a very different impact on our outcome data.
Footnotes
Funding
This research received no specific grant from any funding agency in the public, commercial or not-for-profit sectors.
Declaration of interest
The authors report no conflicts of interest. The authors alone are responsible for the content and writing of the paper.