
Abstract
Background
There is a lack of standardization of reference intervals (RIs) for ferritin across laboratories, particularly for postmenopausal women. Depending on the RI used, there can be more than a 4-fold difference in the upper limit of normal between laboratories, resulting in potential misinterpretation.
Methods
This retrospective study used a large dataset of blood test results from 25,425 healthy participants aged 18 to 97 over a 7-year period. Exclusion criteria were used to screen out individuals with conditions known to affect iron metabolism or raise ferritin as part of the acute phase response. Distributions were assessed using density and Q-Q plots, and age-banded cut-offs were determined. The non-parametric method was used to establish RIs for sex and age bands.
Results
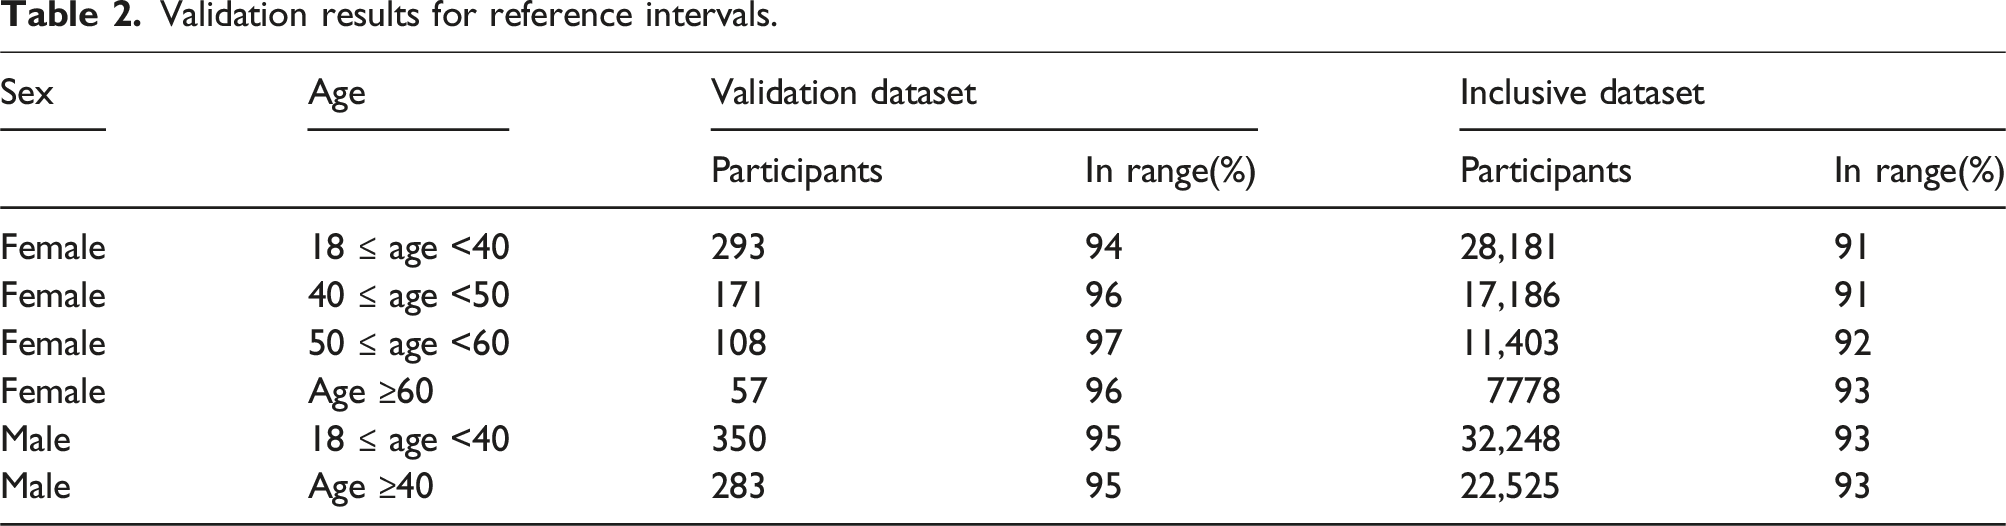
For females, 4 age bands were established (18–39, 40–49, 50–59 and 60+). For males, 2 bands were identified (18–39 and 40+). Performance against a validation dataset, followed by an expansive validation against an inclusive dataset, demonstrated the robustness of the derived RIs.
Conclusion
This study addresses the inconsistency in serum ferritin RIs by presenting intervals based on demographic parameters. This approach can potentially enhance the accuracy of interpreting serum ferritin levels, assisting clinicians in identifying patients requiring further evaluation.
Background
Serum ferritin (SF) most reliably correlates with relative total body iron stores. 1 It is often used in clinical practice to diagnose and monitor iron deficiency or iron overload alongside other tests. However, one of the significant challenges of measuring SF levels is the lack of standardized reference intervals (RIs) among assays and laboratories.
Low SF levels are highly specific for iron deficiency, and most laboratories agree on a lower limit of normal between 15 and 30 μg/L. 2 For example, the World Health Organisation (WHO) and the United Kingdom (UK) National Institute for Health and Care Excellence (NICE) recommend lower cut-offs of 15 and 30 μg/L, respectively, for diagnosing iron deficiency in otherwise healthy individuals.1,3 Since ferritin is an acute-phase reactant, cut-offs as high as 100 μg/L may be used in patients with chronic inflammation. 4
Whilst low SF levels invariably indicate reduced iron stores, raised SF levels can be due to many different aetiologies, including iron overload, inflammation, autoimmune disorders, liver or renal disease, malignancy and metabolic syndrome. 5 Hence, SF levels above the upper limit of normal (ULN) usually prompt further investigations to determine the likely underlying cause. Most laboratories report a fixed ULN of approximately 300 μg/L for adult males and 200 μg/L for adult females.6,7 However, these ranges do not always account for the considerable variation of SF in response to age, ethnic origin and menopausal status. 5 There has also been a population-level increase in average SF levels, likely owing to lifestyle factors and rising rates of obesity, resulting in a greater proportion of SF results falling outside the ULN.8,9 Around 17% of women over 70 have SF levels greater than 200 μ/L, and 17%–31% of adult men have SF levels greater than 300 μ/L.8,10 RIs that reflect demographic and biomedical variations may help clinicians more accurately detect patients who require further evaluation for iron overload. 8
Further subclassification and updates to SF RIs have been explored. A 2023 clinical update for managing raised ferritin in primary care suggests a 300 μg/L cut-off for postmenopausal women, similar to adult men. 11 This guidance is based on the European Association for the Study of the Liver Clinical Practice Guidelines for the management of haemochromatosis 2022, but is specific to the diagnosis of haemochromatosis. 12 Snozek et al. proposed updated SF intervals based on 1438 SF results from healthy participants. 13 They established ULNs of 175.2, 327.8 and 408.5 μg/L for premenopausal women, postmenopausal women and adult men, respectively, based on 95th centile values. However, there were limited data points beyond the age of 60 years, where, at least in women, SF may continue to increase. 10 Additionally, incorporating more nuanced subclassifications centred on the perimenopausal phase may better address the pronounced variations in the onset of menopause experienced by different women.
Given these limitations and the lack of universally accepted cut-offs for SF, this study aims to contribute to existing data using SF results from a large sample of UK adults, and further clarify ULN values for demographic subgroups.
This study is based on analyses performed using the Roche Elecsys Ferritin assay (cobas e 602/801). Assays from different manufacturers are calibrated to an International Standard.
Recovery studies have been conducted 14 to evaluate how closely the Elecsys Ferritin assay aligns with the newer international standards (2nd IS 80/578 and 3rd IS 94/572). The findings indicate a strong agreement between them. The Beckman ferritin assay is traceable to the 3rd International Standard for ferritin, Recombinant NIBSC code: 94/572, and the Siemens Atellica is standardized to the 2nd International Standard (WHO 80/578). Hence, laboratories employing these materials for traceability can adopt the reference interval.
Methods
This retrospective study used de-identified data from the Medichecks results database. Medichecks is a private direct-to-consumer blood testing company based in the United Kingdom, founded in 2001. Service users agree to use of their data in research as part of Medichecks’ terms and conditions. The study was deemed service development research by the Medichecks Clinical Governance Committee.
Ferritin testing is provided to Medichecks by several partner laboratories, all of whom are accredited by the United Kingdom Accreditation Service (UKAS) and use the Roche Cobas platform. The Roche Elecsys ferritin assay was performed on cobas e602 and e801 systems using an immunoassay method according to the manufacturer’s instructions. This assay has a measuring range of 0.50–2000 μg/L (ng/mL), defined by the limit of detection and the maximum of the master curve. Results were reported as <2 up to 100,000 μg/L, representing the limit of quantitation and 50-fold dilution maximum, respectively. The coefficient of variation (CV) for repeatability and intermediate precision is 1.1%–6.4% and 2.1%–7.1%, respectively.
Sample types were exclusively serum. The sampling method was either venous or capillary. The laboratories have all completed validation studies to confirm capillary samples yield comparable results to venous samples. The samples were sent to the laboratory by post, and the transit times were within the stability times defined by the laboratory.
Data extraction and transformation was performed in R Studio, using R version 4.3.1, dplyr version 1.1.2, and purrr version 1.0.1. Outlier detection and RI calculation were performed using the ReferenceIntervals package version 1.3.0.
Ferritin results from 2 August 2016 to 9 August 2023 were extracted from the Medichecks database. To be eligible for inclusion, the following assays must also have been performed on the same sample: transferrin saturation (TSat), haemoglobin (Hb), mean corpuscular volume (MCV), high-sensitivity C-reactive protein (hs-CRP), alanine aminotransferase (ALT), gamma-glutamyl transferase (GGT), estimated glomerular filtration rate (eGFR) and glycosylated haemoglobin A1c (HbA1c). This yielded 63,137 eligible sets of results from 23,792 females and 23,160 males.
Results were excluded if any accompanying assay, other than ferritin, was outside the RI, according to the laboratory’s normal RI. For example, sets of results that included an eGFR of less than 60 mL/min/1.73 m2 were excluded. These exclusion criteria were selected to remove individuals from the study with conditions known to affect ferritin concentrations. Where an individual had tested more than once, a single set of their results was randomly selected for inclusion in the study, and their other results were excluded.
Population size by 10-year age band for females and males.
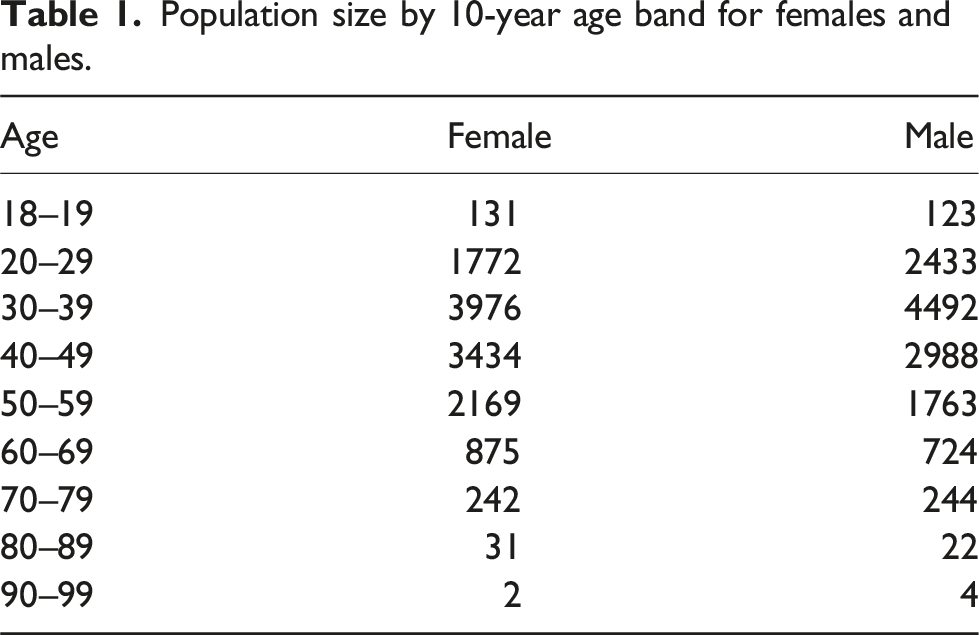
The ages ranged from 18 to 97 for females and 18 to 94 for males. There were relatively low numbers of participants aged 80 or more (33 females and 26 males).
Outlier ferritin results were separately identified for male and female datasets using Horn’s method15,16 (Tukey’s fences) on a Box-Cox transformation of the data. There were 63 female and 135 male outlier results excluded from the analysis.
A training dataset (95% of results) and a validation set (5%) were created. This was performed separately for women and men by random selection, stratified by 10-year age bands.
Validation results for reference intervals.
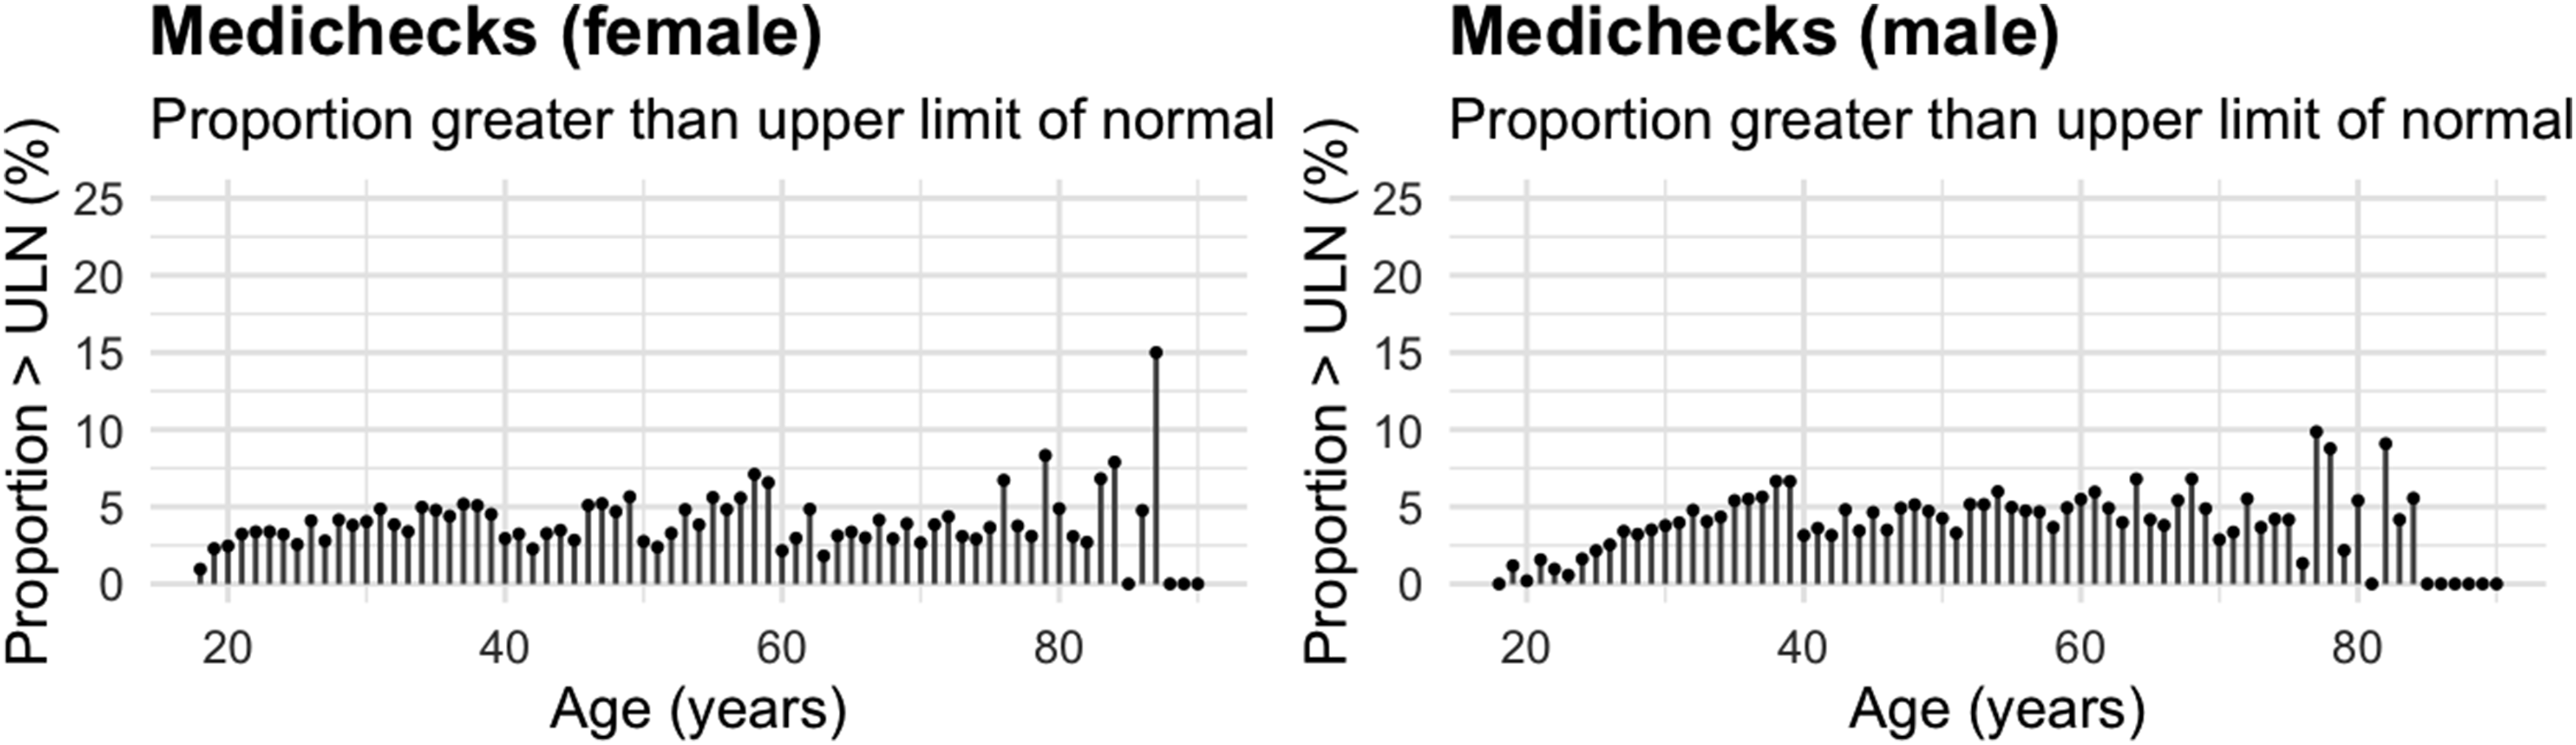
Proportion of results in the inclusive dataset which were above the upper limit of normal by age.
Results
The distribution of the training dataset was assessed using a combination of density plots and Q-Q plots. These showed that the distribution was not parametric, with a positive skew. This informed the decision to use the non-parametric method for calculating RIs.
Three methods were used to identify visually where age-banded cut-offs for RIs could be set for both sexes (Figure 2). Variation of ferritin with age for males and females.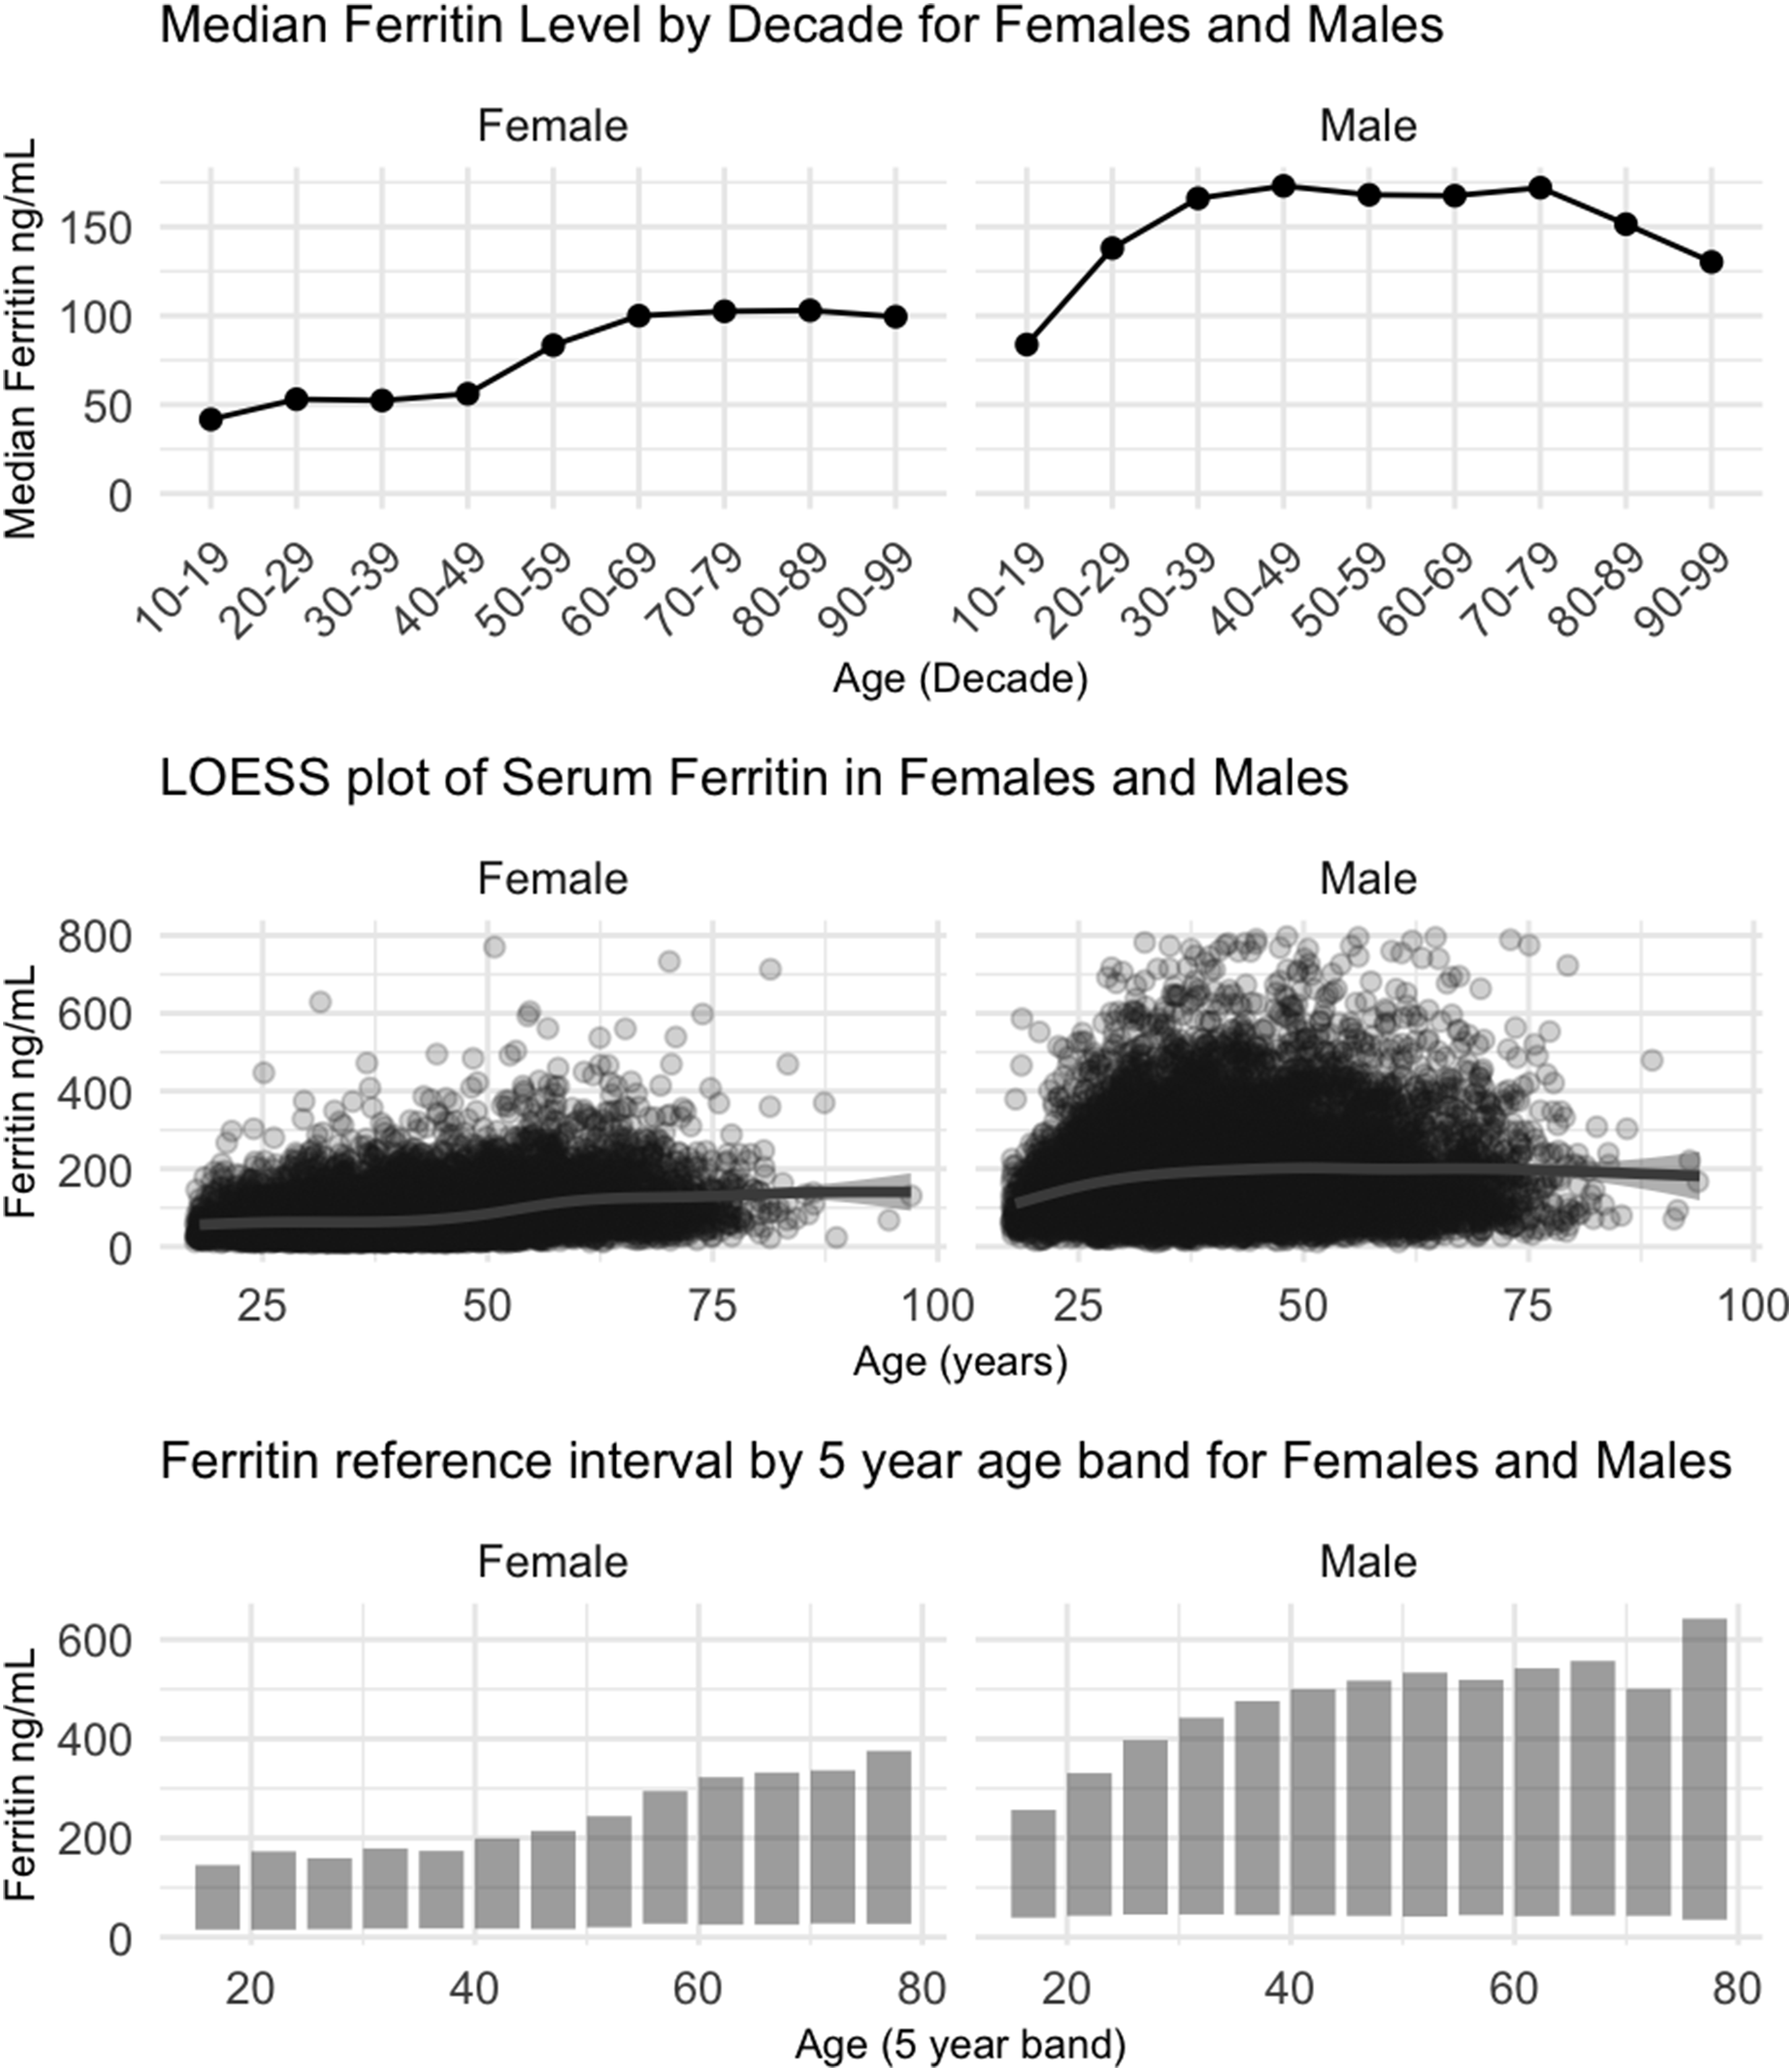
For females, 4 distinct age bands were identified: 18–39, 40–49, 50–59 and 60+. For males, 2 age bands were identified: 18–39 and 40+.
Reference intervals by age band for females and males.
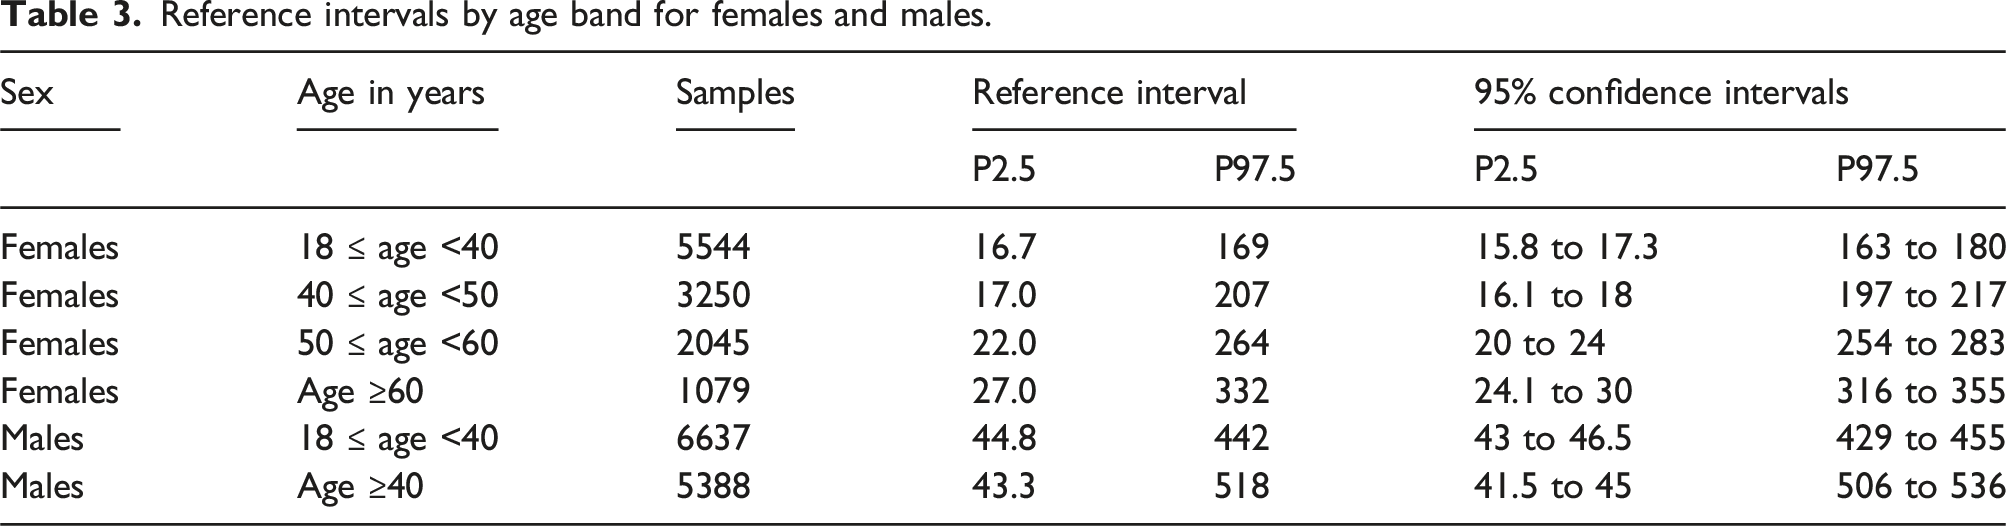
Discussion
There is a wide variety of practice in the selection of SF RIs across laboratories in the UK. In the following discussion, we look predominantly at the effect of differences in the upper limit of the RI for SF. There is well-established guidance from national clinical bodies, such as NICE in the UK and the WHO, which define the lower limit of normal for SF based on the presence or absence of iron deficiency.
The expected values supplied by Roche for use with the Elecsys Ferritin assay
17
consist of a single set of expected values for females aged 17 to 60 years old (13–150 µg/L) and males aged 20 to 60 years old (30–400 µg/L). The sample population used to derive these consisted of 104 women, who were mainly premenopausal, and 120 men. They do not take account of the correlation of age with SF seen in multiple studies.
18
The effect of applying the Roche RI to the combined training and validation dataset results in a significant percentage of results falling outside the ULN, especially females over 50 (Figure 3(a)). The age range has not been restricted to those provided by Roche, as they are commonly used for ages outside these boundaries. Proportion of Medichecks results above the upper limit of normal using reference intervals from Roche (a), ACB (b), and Snozek et al. (c).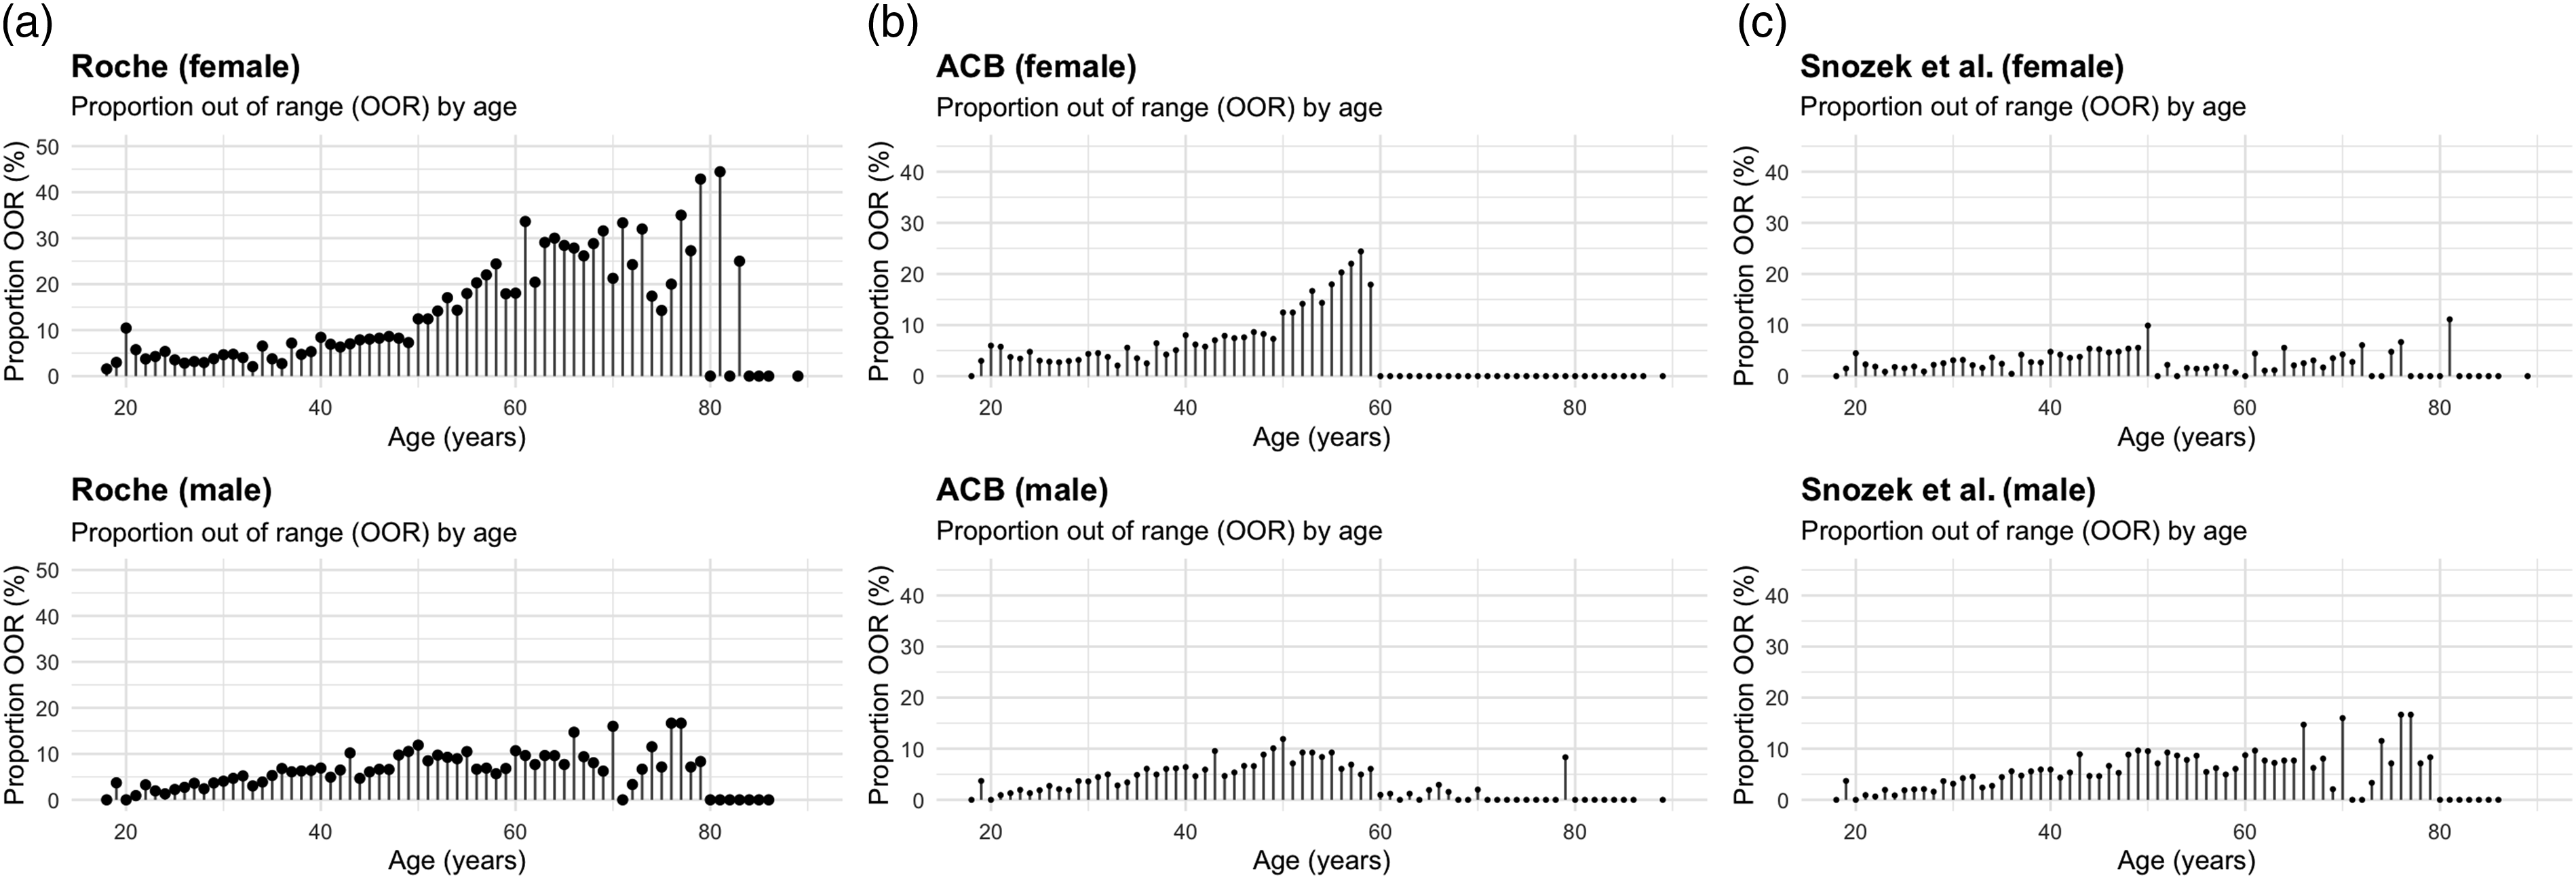
The United Kingdom Association of Clinical Biochemistry and Laboratory Medicine (ACB) advises distinct RIs for individuals aged less than 60 years old (females 17–60 years: 15–150 μg/L, males 20–60 years: 30–400 μg/L), and 60 years old or more (females and males 60–90 years: 15–650 μg/L). 19 These are almost identical to the Roche RI for females and males under 60. For men and women aged 60 or more, the ULN is 650 µg/L. In women, this represents more than a 4-fold increase in the upper limit of RI once they reach 60 years old. When using the ACB RI against the Medichecks combined training and validation datasets, no women aged 60 or older had a result exceeding the ULN (Figure 3(b)). There is a risk that females with clinically significant raised SF are missed if the ACB reference ranges are used in the 60+ year-old age group. There was a similar, albeit less marked, effect in men aged 60 or over.
The Roche and the ACB RIs generate an increasing number of results above the ULN from approximately age 40 in women. This sharply accelerates from age 50, where almost a quarter of all results for participants in their late 50s exceed the ULN. In this group, there is a risk that individuals undergo unnecessary further investigations due to an SF level above the ULN.
The choice of 60 years as the age boundary for the ACB RIs does not consider the correlation with age seen in younger men, where levels increase in young adulthood and plateau between 30 and 40 years old.20,21 Figure 2 shows this plateau occurring in the study dataset at approximately age 40.
The RIs derived by Snozek et al. 13 offer significant improvements over those supplied by Roche and the ACB. The key change for adults is lowering the age cut-off for women to 51 years and older. They also include RIs for children. Figure 3(c) shows the performance of the Snozek et al. RIs when applied to this study’s dataset. The female data shows a distinct step in the proportion of results above the ULN between the ages of 50 and 51 years old. The use of a single RI for adult males results in a steady increase in the proportion of results above the ULN between the ages of 18 and 40.
Based on our literature search, this study appears to be the most extensive study to date (23,965 participants in the training dataset) of adult ferritin RIs for the Roche ferritin assay. Our RI uses 4 age bands for females and 2 for males. This takes account of the age-related increase in SF seen in females and males and causes less variation in the proportion of results above the ULN at age boundaries. The inclusion and exclusion criteria ensured that the age-related increase in SF seen in the training dataset is unlikely to be due to iron overload, chronic disease or inflammation.
Using a statistically derived lower limit for ferritin is problematic in females. Across all female age groups, the lower limit of the RI was below 30 µg/L, which is widely recognized as the level below which clinical iron deficiency is probable.1,22 UK’s NICE advises that an SF level of 30 µg/L or less is diagnostic of iron deficiency. In patients with high levels of inflammation, this threshold can be 50 µg/L or higher. This can range up to 100 µg/L in people with chronic kidney disease. Clinical judgement is needed in interpreting results at the lower limit of the RI and in those with conditions that can elevate ferritin as part of the acute-phase response.
Haemochromatosis is typically diagnosed using molecular testing. However, this does not diminish the value of SF as an inexpensive and convenient preliminary screening marker. It is often ordered as a standalone test in practice to assess a patient’s iron status and investigate common symptoms such as fatigue. Therefore, the ULN serves as important guidance for clinicians on whether further investigations are warranted. As mentioned, current ULN thresholds are too low for certain groups like postmenopausal women, which can lead to unnecessary investigations including molecular testing, even where there is low suspicion for haemochromatosis. The proposed ULNs from this study aim to reduce this risk and more reliably reflect whether a result is truly normal for that individual. As with any RI, SF levels should be taken in the context of the full clinical picture.
A limitation of this study is that we relied on age as a proxy for menopause status in females. This reflects real-world practice where menopause status is rarely available to the laboratory, but age always is. The study had relatively few participants aged 80 or more (34 females and 26 males) compared to younger age groups in the dataset. We used the results of other tests performed at the same time as ferritin to exclude people with conditions that may affect ferritin levels. We did not have access to the participants’ healthcare records, so there is a possibility that participants with a diagnosis known to affect SF may have been included in the analysis. However, the impact of this is minimal based on the inclusion criteria that TSat, Hb, MCV, hs-CRP, ALT, GGT, eGFR and HbA1c must be normal.
Conclusion
Current SF RIs may be unsuitable for certain age groups, potentially leading to missed diagnosis or unnecessary additional investigations. This study offers a comprehensive evaluation of serum ferritin SF RIs across demographic subgroups within a healthy UK adult population, proposing updated sex-specific age breaks. These refined RIs can assist clinicians’ diagnostic decision-making and subsequently enhance patient care.
Footnotes
Declaration of conflicting interests
The author(s) declared the following potential conflicts of interest with respect to the research, authorship, and/or publication of this article: At the time of writing, Dr Sam Rodgers is the Chief Medical Officer of Medichecks Ltd, and a Board Director.
Funding
The author(s) received no financial support for the research, authorship, and/or publication of this article.
Ethical approval
This study was reviewed and classified as service development research by the Medichecks Clinical Governance Committee. Based on its assessment, the committee determined that our project did not fall under the scope of research requiring formal ethics approval.
Guarantor
Sam Rodgers.
Contributorship
SR and TW conceptualized and designed the study; SR curated and analysed the data with support from PP, TW, and NF; SR led the investigation and methodology with support from PP and TW; SR wrote the first draft with support from JS; all authors edited, reviewed and approved the final manuscript.