
Abstract
Introduction
Macrotroponin is increasingly recognised as a cause of confusion in interpreting high-sensitivity cardiac troponin (hs-cTnI) results. In this study, we sought to evaluate two practical approaches to detecting macrotroponin. These two approaches are PEG precipitation and SVM (support vector machine) analysis to classify discrepancies between hs-cTn assays.
Method
Residual serum and heparin plasma specimens (n = 483) with initially elevated hs-cTnI from hospital and community laboratories were retested on multiple hs-cTn platforms before and after PEG precipitation and Protein A immunoglobulin depletion. SVM analysis was conducted to identify a linear equation that best discriminated specimens with macrotroponin using a combination of results from two different hs-cTn assays.
Findings
The diagnostic performance of PEG precipitation was carried out using Protein A immunoglobulin depletion as the reference comparator. When a cutoff residual activity after PEG precipitation of ≤ 20% was used, this threshold carried a high specificity of 92% (confidence interval 83–98%; n = 189) using the Siemens hs-cTnI Vista assay and 95% specificity (86%–98%; n = 242) using the Abbott hs-cTnI Architect assay. SVM analysis generated a linear equation identifying macrotroponin specimens from results obtained on two hs-cTn assays. This approach can be highly specific, comparable to PEG precipitation when certain assay combinations and concentrations are used.
Conclusion
We describe and identify practical alternatives to detecting macrotroponin. These approaches can be optimised for high specificity, reducing the need for more complex laboratory methods.
Introduction
Macrotroponin is a complex of cardiac troponin autoantibodies (cTnAAB) bound to cardiac troponin (cTn). Macrotroponin can cause confusion in the interpretation of troponin results for two reasons. Firstly, this complex is associated with elevated cTn results without apparent clinical cause. 1 This is due to the reduced clearance (prolonged half-life) of macrotroponin in circulation compared to unbound cTn. Secondly, macrotroponin may lead to highly discrepant troponin results due to differences in assay sensitivity to its presence. 2 It may also affect apparent delta changes between repeated measurements using the same assay during an acute event 3 and may amplify the difference between different assays more than expected.
We have recently investigated the effects of macrotroponin by retrospectively reviewing a cohort of macrotroponin patients with elevated hs-cTnI tested in a community laboratory. 1 Compared to patients without macrotroponin, we demonstrated that macrotroponin is associated with improved survival, a lower likelihood of ACS as a final admission diagnosis, and a higher rate of final diagnosis of unexplained elevated cTn. Furthermore, low recovery following PEG precipitation was associated with improved overall and cardiac survival following hospital discharge. 4 However, despite overall better outcomes, our studies demonstrated that macrotroponin could co-exist with genuine cardiac morbidity even in a low-risk community-based setting.
Despite increasing knowledge of the analytical and clinical effects of macrotroponin, to date, methods used to detect its presence, such as protein A, gel filtration chromatography (GFC) or other size exclusion methods, are cumbersome, time-consuming and not well-suited to a high volume clinical laboratory. PEG precipitation is regarded as a routine laboratory method for detecting antibody-mediated interferences; however, the biochemical basis and exact specificity as to which proteins or protein fractions precipitate remains unclear. Furthermore, this process also significantly alters the specimen matrix. While anecdotally widely discrepant cTnI results suggest the possibility of macrotroponin,5-7 no systematic studies have evaluated the diagnostic performance of this approach.
In this study, we sought to evaluate two practical approaches to detecting macrotroponin. These two approaches are 1.) PEG precipitation, and 2.) SVM (support vector machine) analysis to classify discrepancy between hs-cTn assays.
Methods
Specimen handling and troponin analysis
Residual specimens initially tested for hs-cTn were retested locally in Auckland to ensure Protein A and PEG testing were performed on the same analyser. Residual specimens were frozen at -20C until further analysis by PEG precipitation or Protein A immunoglobulin depletion. Specimens, before or after Protein A or PEG precipitation, always occurred within four freeze-thaw cycles prior to repeat cTn analysis. Troponin assays used in this study included the Siemens hs-cTnI Centaur (ADVIA Centaur TNIH; Siemens Healthcare), Siemens hs-cTnI Vista (Dimension Vista TNIH; Siemens Healthcare), Abbott hs-cTnI Architect (ARCHITECT STAT high-sensitivity troponin I; Abbott Laboratories), Beckman hs-cTnI Access (ACCESS high-sensitivity troponin I; Beckman Coulter), and Roche hs-cTnT Elecsys (Elecsys high-sensitivity troponin T STAT [TNT-HSST]; Roche Diagnostics). Further detail of assays and local implementation is as previously published (Supplemental Table 1).
Study population
The study population consisted of 483 residual specimens on which Protein A immunoglobulin depletion was later performed. These consisted of requests for troponin testing from community collection centres (n = 443) and a hospital laboratory (n = 40). Specimens were selected based on cTn request, sufficient residual volume and concentration without knowledge of other information. Residual specimens were retained for this study between August 2018 and November 2019. Serum specimens were collected from community laboratories LabTests, Auckland, (n = 359) using the Siemens hs-cTnI assay (Advia Centaur XP, Siemens), Wellington SCL laboratory (n = 45) using the 9-minute Roche hs-cTnT Elecsys assay (Cobas e602, Roche) and PathLab Waikato (n = 39) using the Beckman hs-cTnI assay (UniCel DXL600 and DXL800, Beckman). Residual heparin specimens were also collected from a hospital laboratory with an emergency department (Canterbury Health Laboratories; n = 40) initially measured using the Abbott hs-cTnI assay (Architect iSR2000, Abbott). Specimens collected at LabTests, Auckland, included specimens below the URL (16%; n = 59) and were part of a previous study. 2 Specimens collected at other sites included elevated cTn based on their local assay and reference intervals.
PEG and Protein A methods
The use of Protein A was as previously reported.
2
Briefly, immunoglobulin-depleted serum or plasma was generated by incubating approximately 0.5–1 mL of serum in a NAb™ Protein A Plus spin column (Thermo Fisher) for 1 hour at room temperature on an orbital shaker, followed by centrifugation at 1000g for 1 minute. Immunoglobulin depletion by Protein A was carried out using the Siemens hs-cTnI Centaur assay only. TSH was tested in parallel before and after immunoglobulin depletion. The recovery (%) was calculated by:
PEG precipitation was carried out by adding a 1:1 (v/v) ratio of PEG solution (25% PEG6000; w/v) using PBS as the carrier. The mixture was vortexed and rested at room temperature for at least 10 minutes. The specimen was then centrifuged at 14000g for five minutes, and the supernatant was analysed. The PEG recovery was calculated by: POST-PEG cTn * 2/PRE-PEG cTn * 100 (%) to account for a 1:1 volume change. Specimens were tested before and after PEG precipitation on the Siemens hs-cTnI Centaur (n = 132), Abbott hs-cTnI Architect (n = 242), Siemens hs-cTnI Vista (n = 189), Beckman hs-cTnI Access (n = 132) and Roche hs-cTnT Elecsys (n = 253). In total, 68 specimens were retested following PEG precipitation on all four hs-cTnI assays.
Designation of macrotroponin
This study used Protein A immunoglobulin depletion as a reference comparator for detecting macrotroponin. This was chosen as the reference comparator as there has been greater experience in the literature using this methodology and associated with this, clinical outcome data. It is also recognised as a reference laboratory method. 8 A Protein A recovery of < 40% for Siemens hs-cTnI Centaur following adjustment for volume by using TSH (Cobas, Roche) served as the reference comparator for the presence of macrotroponin. 2 Our previous work 2 demonstrated that the Siemens hs-cTnI Centaur assay alone could identify all specimens with low recovery (<40% following adjustment with TSH) when Protein A immunoglobulin depletion was performed with an alternative hs-cTnI assay.
Data analysis
Passing and Bablock regression was used to determine the slope and intercept for comparison between PEG precipitation and Protein A recovery. Estimates of uncertainty for receiver operating characteristics were calculated using bootstrap resampling (n = 2000). The concordance statistic (c-statistic) was the area under the ROC curve. The maximum Youden's Index determined the optimal cutoff. The correlation coefficient was calculated using the non-parametric Spearman's method.
The slope and intercept of a line that best separated macrotroponin status between two hs-cTn assays were calculated using a support vector machine (SVM). The dataset was divided into two in a ratio of 1:3 to train and validate the SVM model, respectively. The training dataset was used to derive an optimal cost parameter. Briefly, this parameter represented a value that produced the lowest misclassification rate. This optimal cost was identified based on a grid search by leave-one-out cross-validation. All statistics and computations were carried out using R version 4.0.5. Specific packages included 'pROC' for the analysis of ROC and 'e1071' for the analysis of support vectors.
This study utilised biospecimens and data that were de-identified. The Health and Disability Ethics Committee of New Zealand considered this work as a laboratory quality activity outside the scope of its review process. The study received locality approval from LabTests, Auckland, New Zealand.
Results
The proportion of macrotroponin
The proportion of macrotroponin varied between assay used and also between community and hospital specimens. In community specimens, macrotroponin was identified in 52% (n = 359) using the Siemens hs-cTnI Centaur assay and 25% (n = 39) using the Beckman hs-cTnI assay. In contrast, the proportion of macrotroponin was lower in community specimens analysed by the Roche hs-cTnT Elecsys assay (8.9%; n = 45) and hospital specimens analysed by the Abbott Architect (10%; n = 40; See Supplemental Table 2 for the distribution of cTn results from each laboratory).
PEG precipitation
To investigate the diagnostic utility of PEG precipitation, PEG precipitation was carried out on four hs-cTnI assays (Figure 1). Most cTn assays demonstrated an apparent high baseline of PEG recovery (%) that increased particularly at lower cTn concentrations. This effect was noticeable on all assays but was most pronounced on the Siemens hs-cTnI Centaur assay. PEG precipitation on this assay often yielded recovery of > 100%. Although PEG precipitation using the hs-cTnI Centaur assay may distinguish macrotroponin, the threshold varies greatly depending on concentration. PEG recovery (%) on various high-sensitivity troponin I assays at different concentrations. The vertical dotted line indicates the non-gender upper reference limit (URL). For each combination of hs-cTn assays, specimens with macrotroponin (red triangles) and without macrotroponin (blue circles) are shown.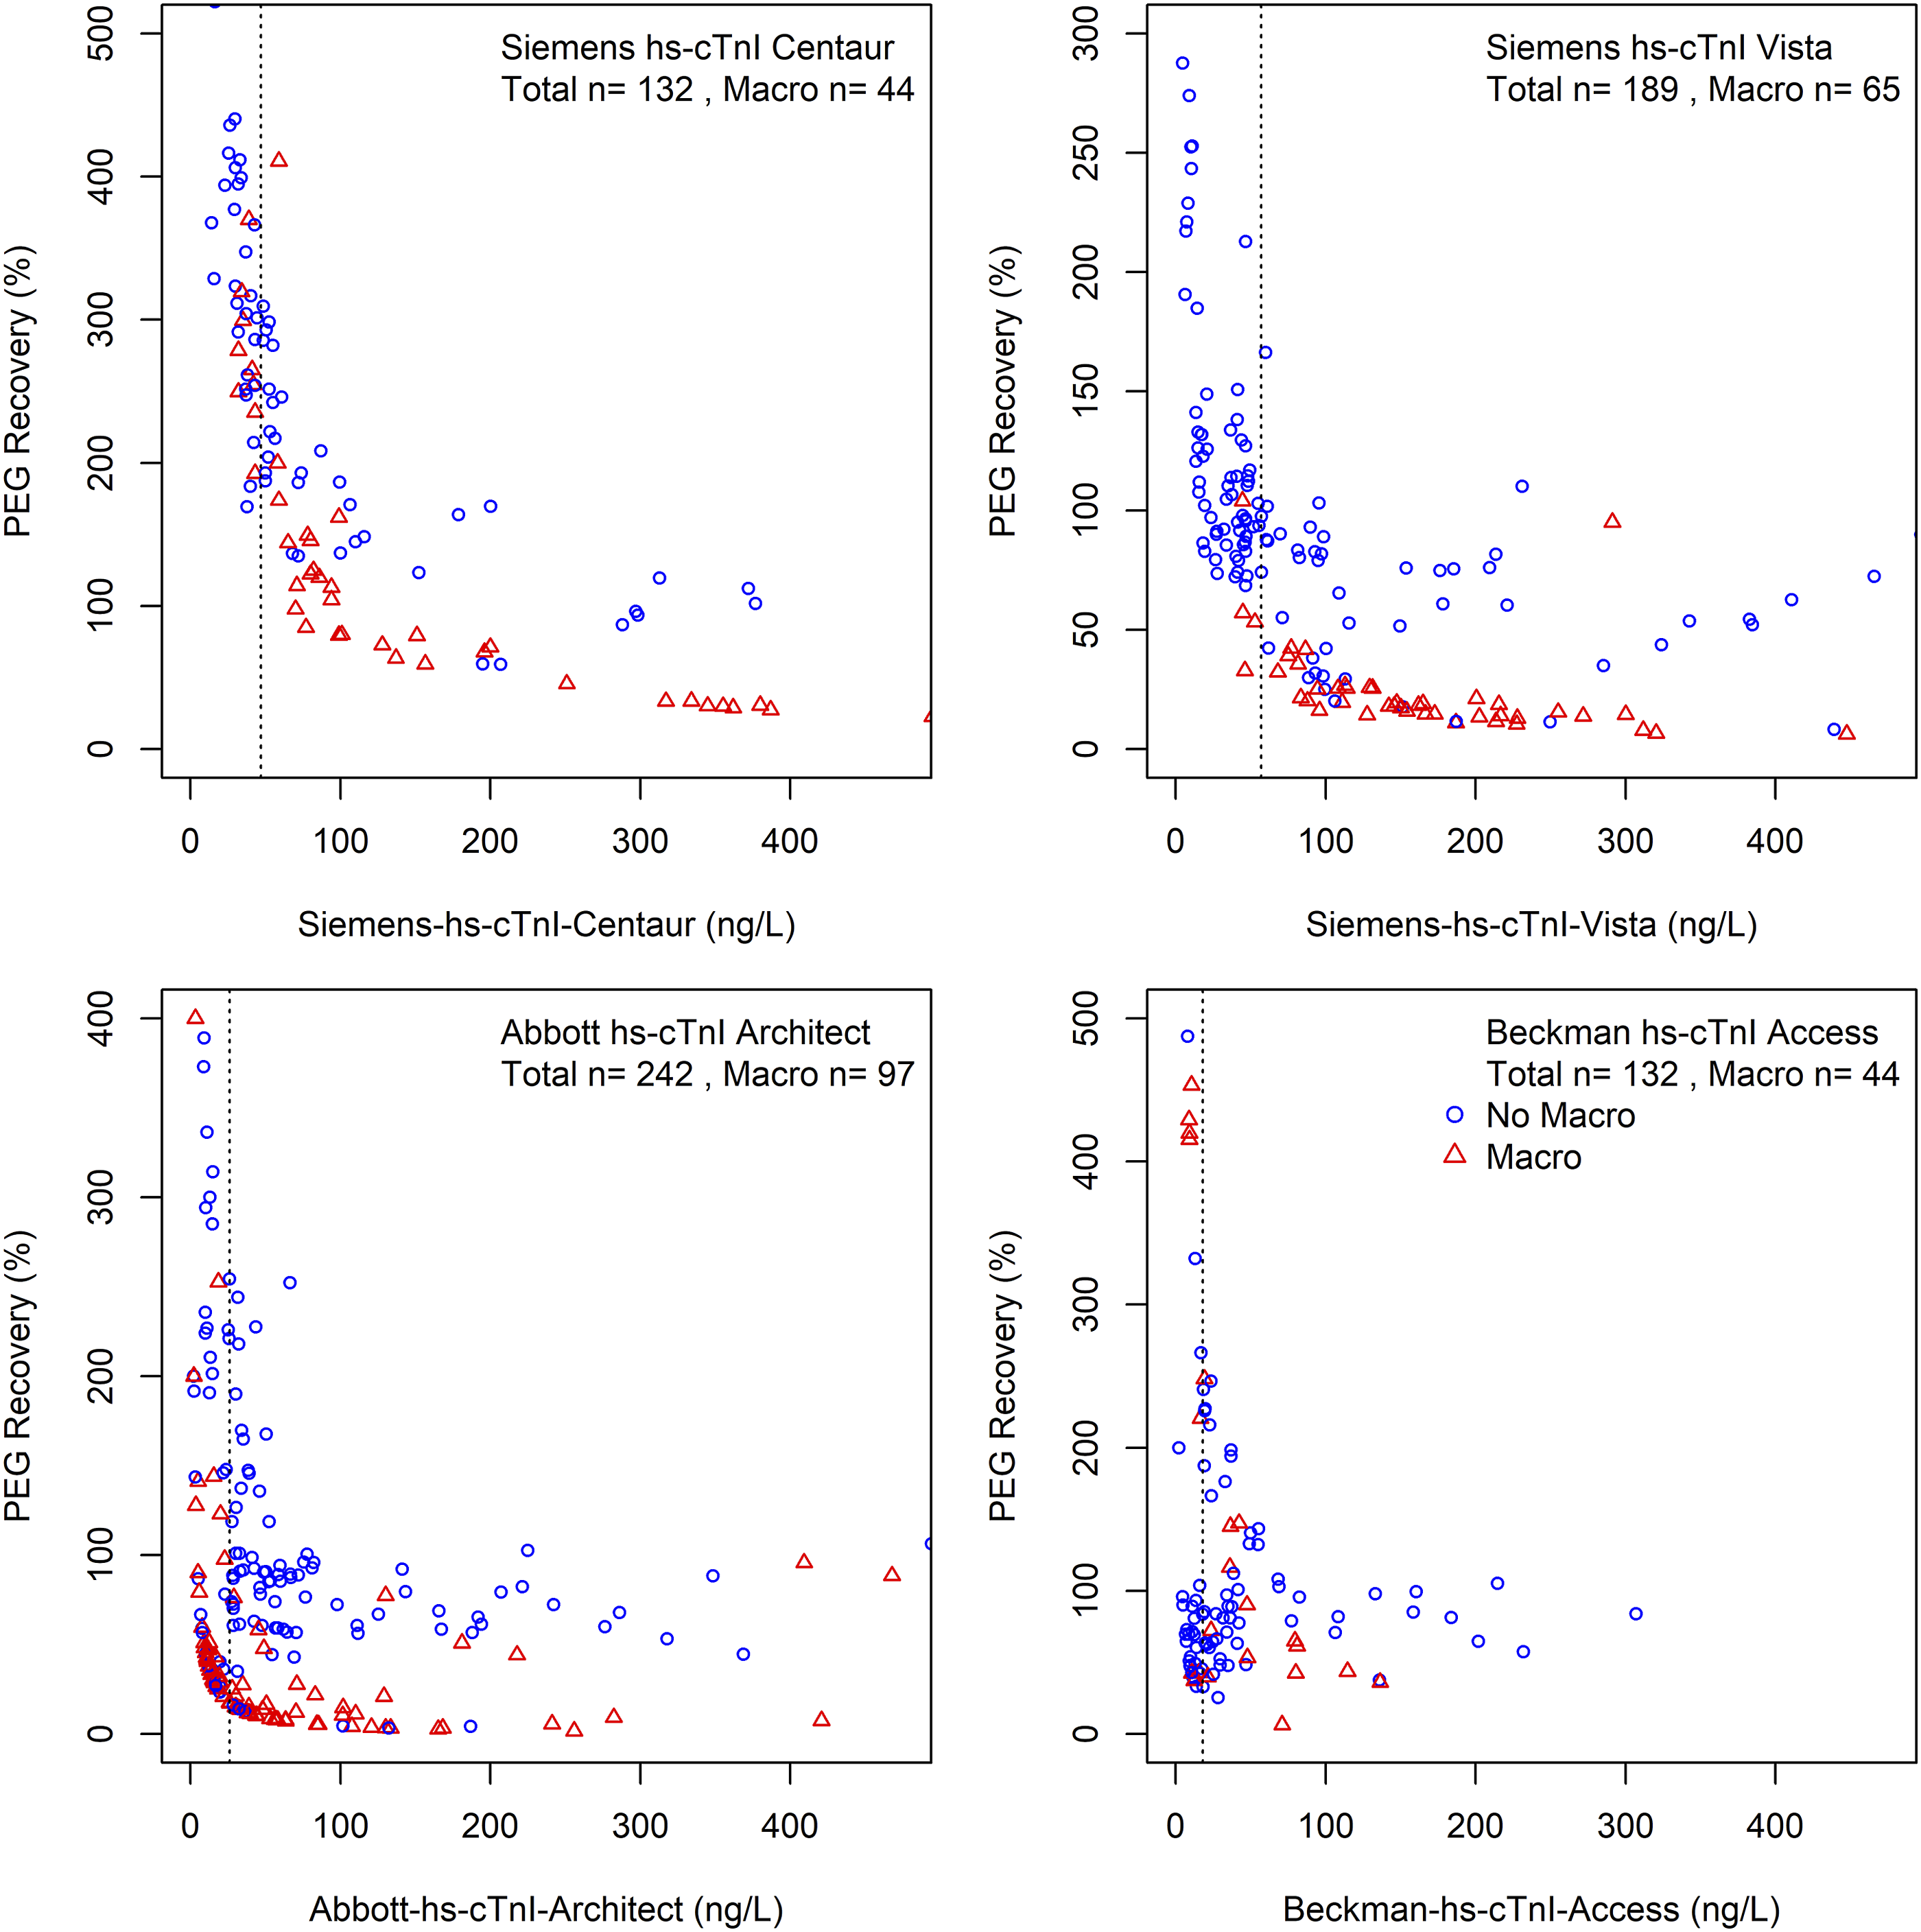
Only two assays, the Siemens hs-cTnI Vista and the Abbott hs-cTnI Architect assays, demonstrated the potential value of PEG precipitation at concentrations above their respective non–gender-specific upper reference limit (URL). These two hs-cTnI assays demonstrated a reasonable correlation between PEG and Protein A precipitation (Figure 2) for specimens above the URL. PEG recovery compared to Protein A recovery and associated reciever operating characteristics. The two hs-cTnI assays which demonstrated potential to identify macrotroponin by PEG precipitation Siemens hs-cTnI Vista and Abbott hs-cTnI Architect were included in this figure. Only specimens with initially elevated troponin (above URL) were included. The line of best fit is based on Passing and Bablok. The associated ROC curves (black solid line), with 95% confidence interval (shaded grey) and the Youden's cutoff (red circle) are shown.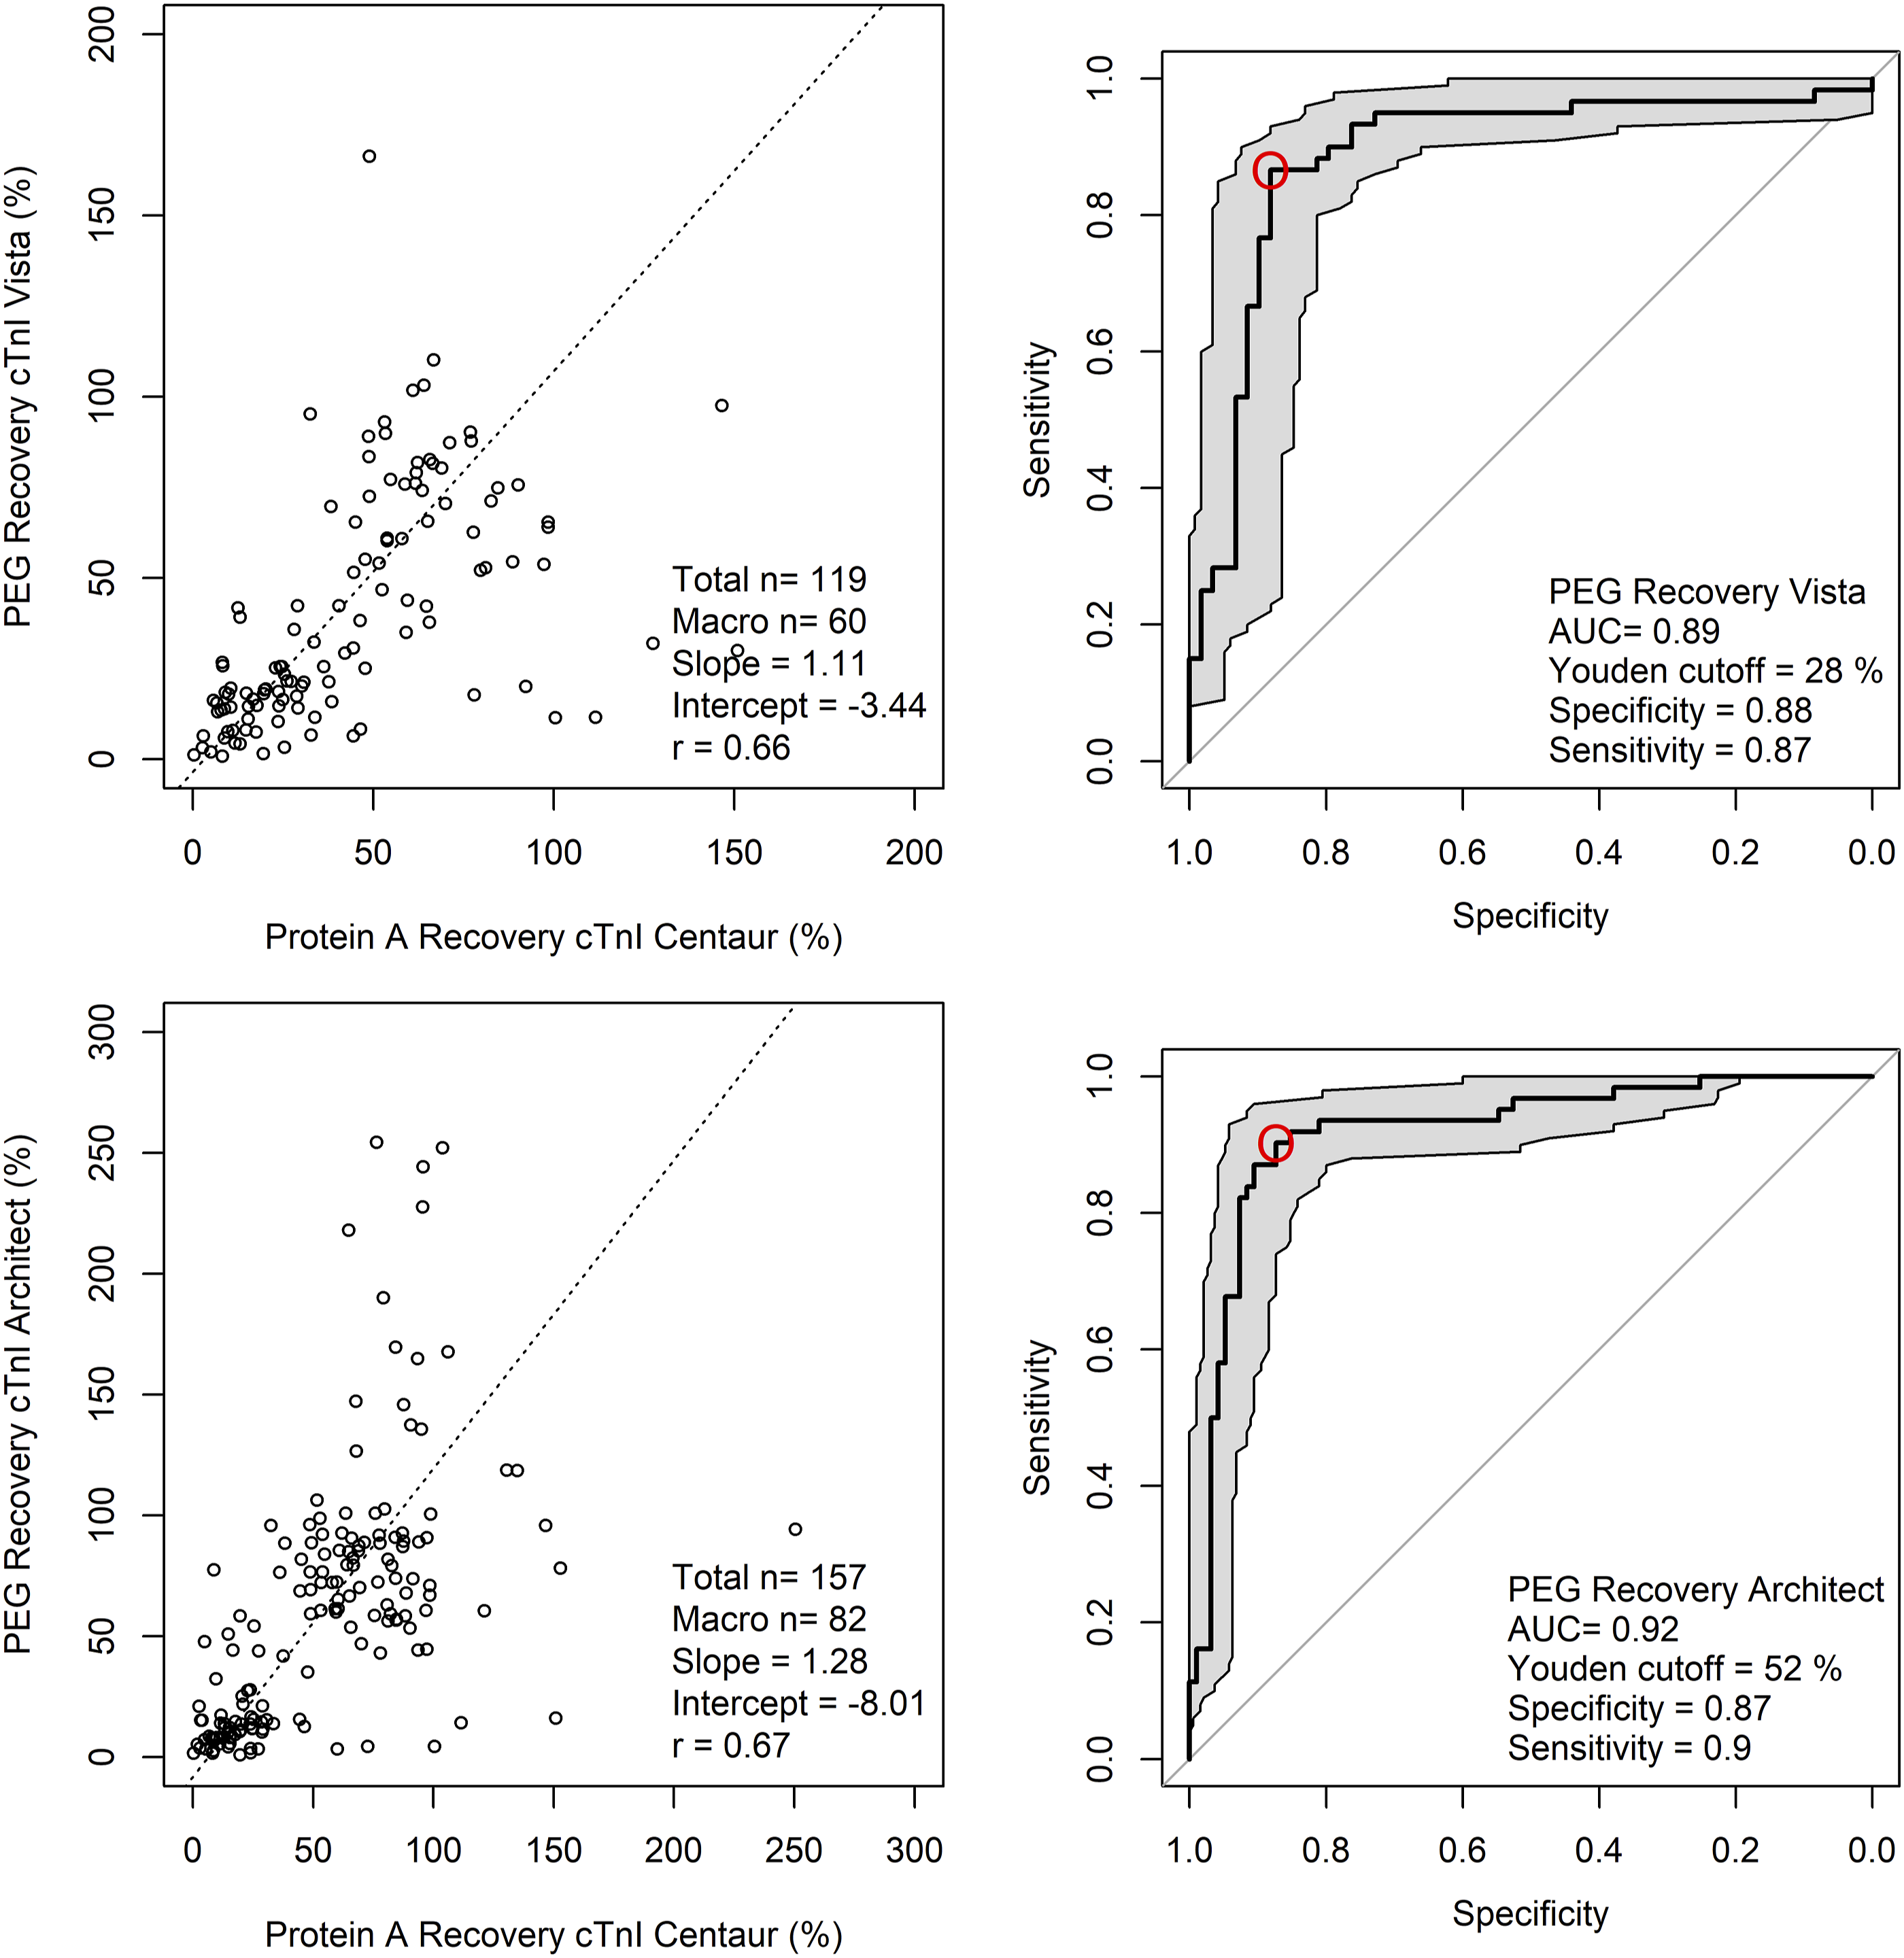
Precision studies were carried out by repeated testing of a pooled specimen over multiple days. For the Abbott hs-cTnI Architect, the average PEG precipitation was 26% and inter-batch coefficient of variation (CV; 5.4%; n = 8 replicates). For the Siemens hs-cTnI Vista, average PEG precipitation was 11% (CV; 4.2%; n = 8). ROC was constructed for each assay to determine the analytical performance of PEG precipitation for macrotroponin. In this analysis, specimens with hs-cTnI recovery by Protein A < 40% were classified as having macrotroponin.
Using the Siemens hs-cTnI Vista assay, the AUC using PEG precipitation was 0.89 (0.82–0.95; 95% confidence interval). The optimal cutoff was 28%, with results below this value having a sensitivity of 87% (78–95%; 95% confidence interval) and specificity of 88% (80–95%) for the presence of macrotroponin. Using the Abbott hs-cTnI Architect assay, the AUC using PEG precipitation was 0.92 (0.87–0. 97). The optimal cutoff was 52% with a sensitivity of 87% (81%–94%) and specificity of 90% (82–97%) for macrotroponin below this cutoff.
When a cutoff for PEG precipitation of ≤ 20% was used, this threshold carried a high specificity of 92% (83–98%; confidence interval) using the Siemens hs-cTnI Vista assay and 93% (86%–98%) using the Abbott hs-cTnI Architect assay. For sensitivity and specificity at individual cutoff values, please refer to Supplemental Table 3 and 4. A similar analysis for the PEG precipitation of hs-cTnT can be found in Supplmental Table 5 and Supplemental Figure 1.
SVM Classification
Given the large discrepancy observed between the Siemens hs-cTnI assay and other hs-cTn assays; we applied SVM classification to identify the presence of macrotroponin using results from two assays (Figure 3 and 4). A training dataset consisting of a quarter of specimens by random assignment was used to generate a linear equation which predicted the presence of macrotroponin. The performance was validated in the remaining specimens. This classification method demonstrated reasonable sensitivity and specificity (Table 1); however, the performance varied depending on the initial hs-cTnI concentration and the combination of assays. SVM classification of macrotroponin based on two assays including a Siemens hs-cTnI assay. For each combination of troponin assays, specimens with macrotroponin (red triangles) and without macrotroponin (blue circles) are shown. Dotted vertical lines indicate 1x and 2x URL. The solid line indicates the linear line which best discriminated between the two groups as determined by SVM classification. Misclassifications are indicated as an overlying black vertical cross. See Table 1 for diagnostic performance. SVM classification of macrotroponin for the remaining assay combination. For each combination of troponin assays, specimens with macrotroponin (red triangles) and without macrotroponin (blue circles) are shown. Dotted vertical lines indicate 1x and 2x URL. The solid line indicates the linear line which best discriminates between the two groups as determined by SVM classification. Misclassifications are indicated as an overlying black vertical cross. No meaningful linear line differentiated between specimens with and without macrotroponin between the Roche hs-cTnT Elecsys and the Beckman hs-cTnI Access. See Table 2 for diagnostic performance. Diagnostic Performance of SVM Classification for Macrotroponin as Stratified by Initial Hs-cTnI Concentration. 1URL refers to the Siemens upper reference limit. For example, for a result of 100ng/L (Siemens hs-cTnI assay), the diagnostic performance of the equation is the sensitivity and specificity at 2–10x URL. 2Numeric values within parentheses indicate the 95% confidence interval.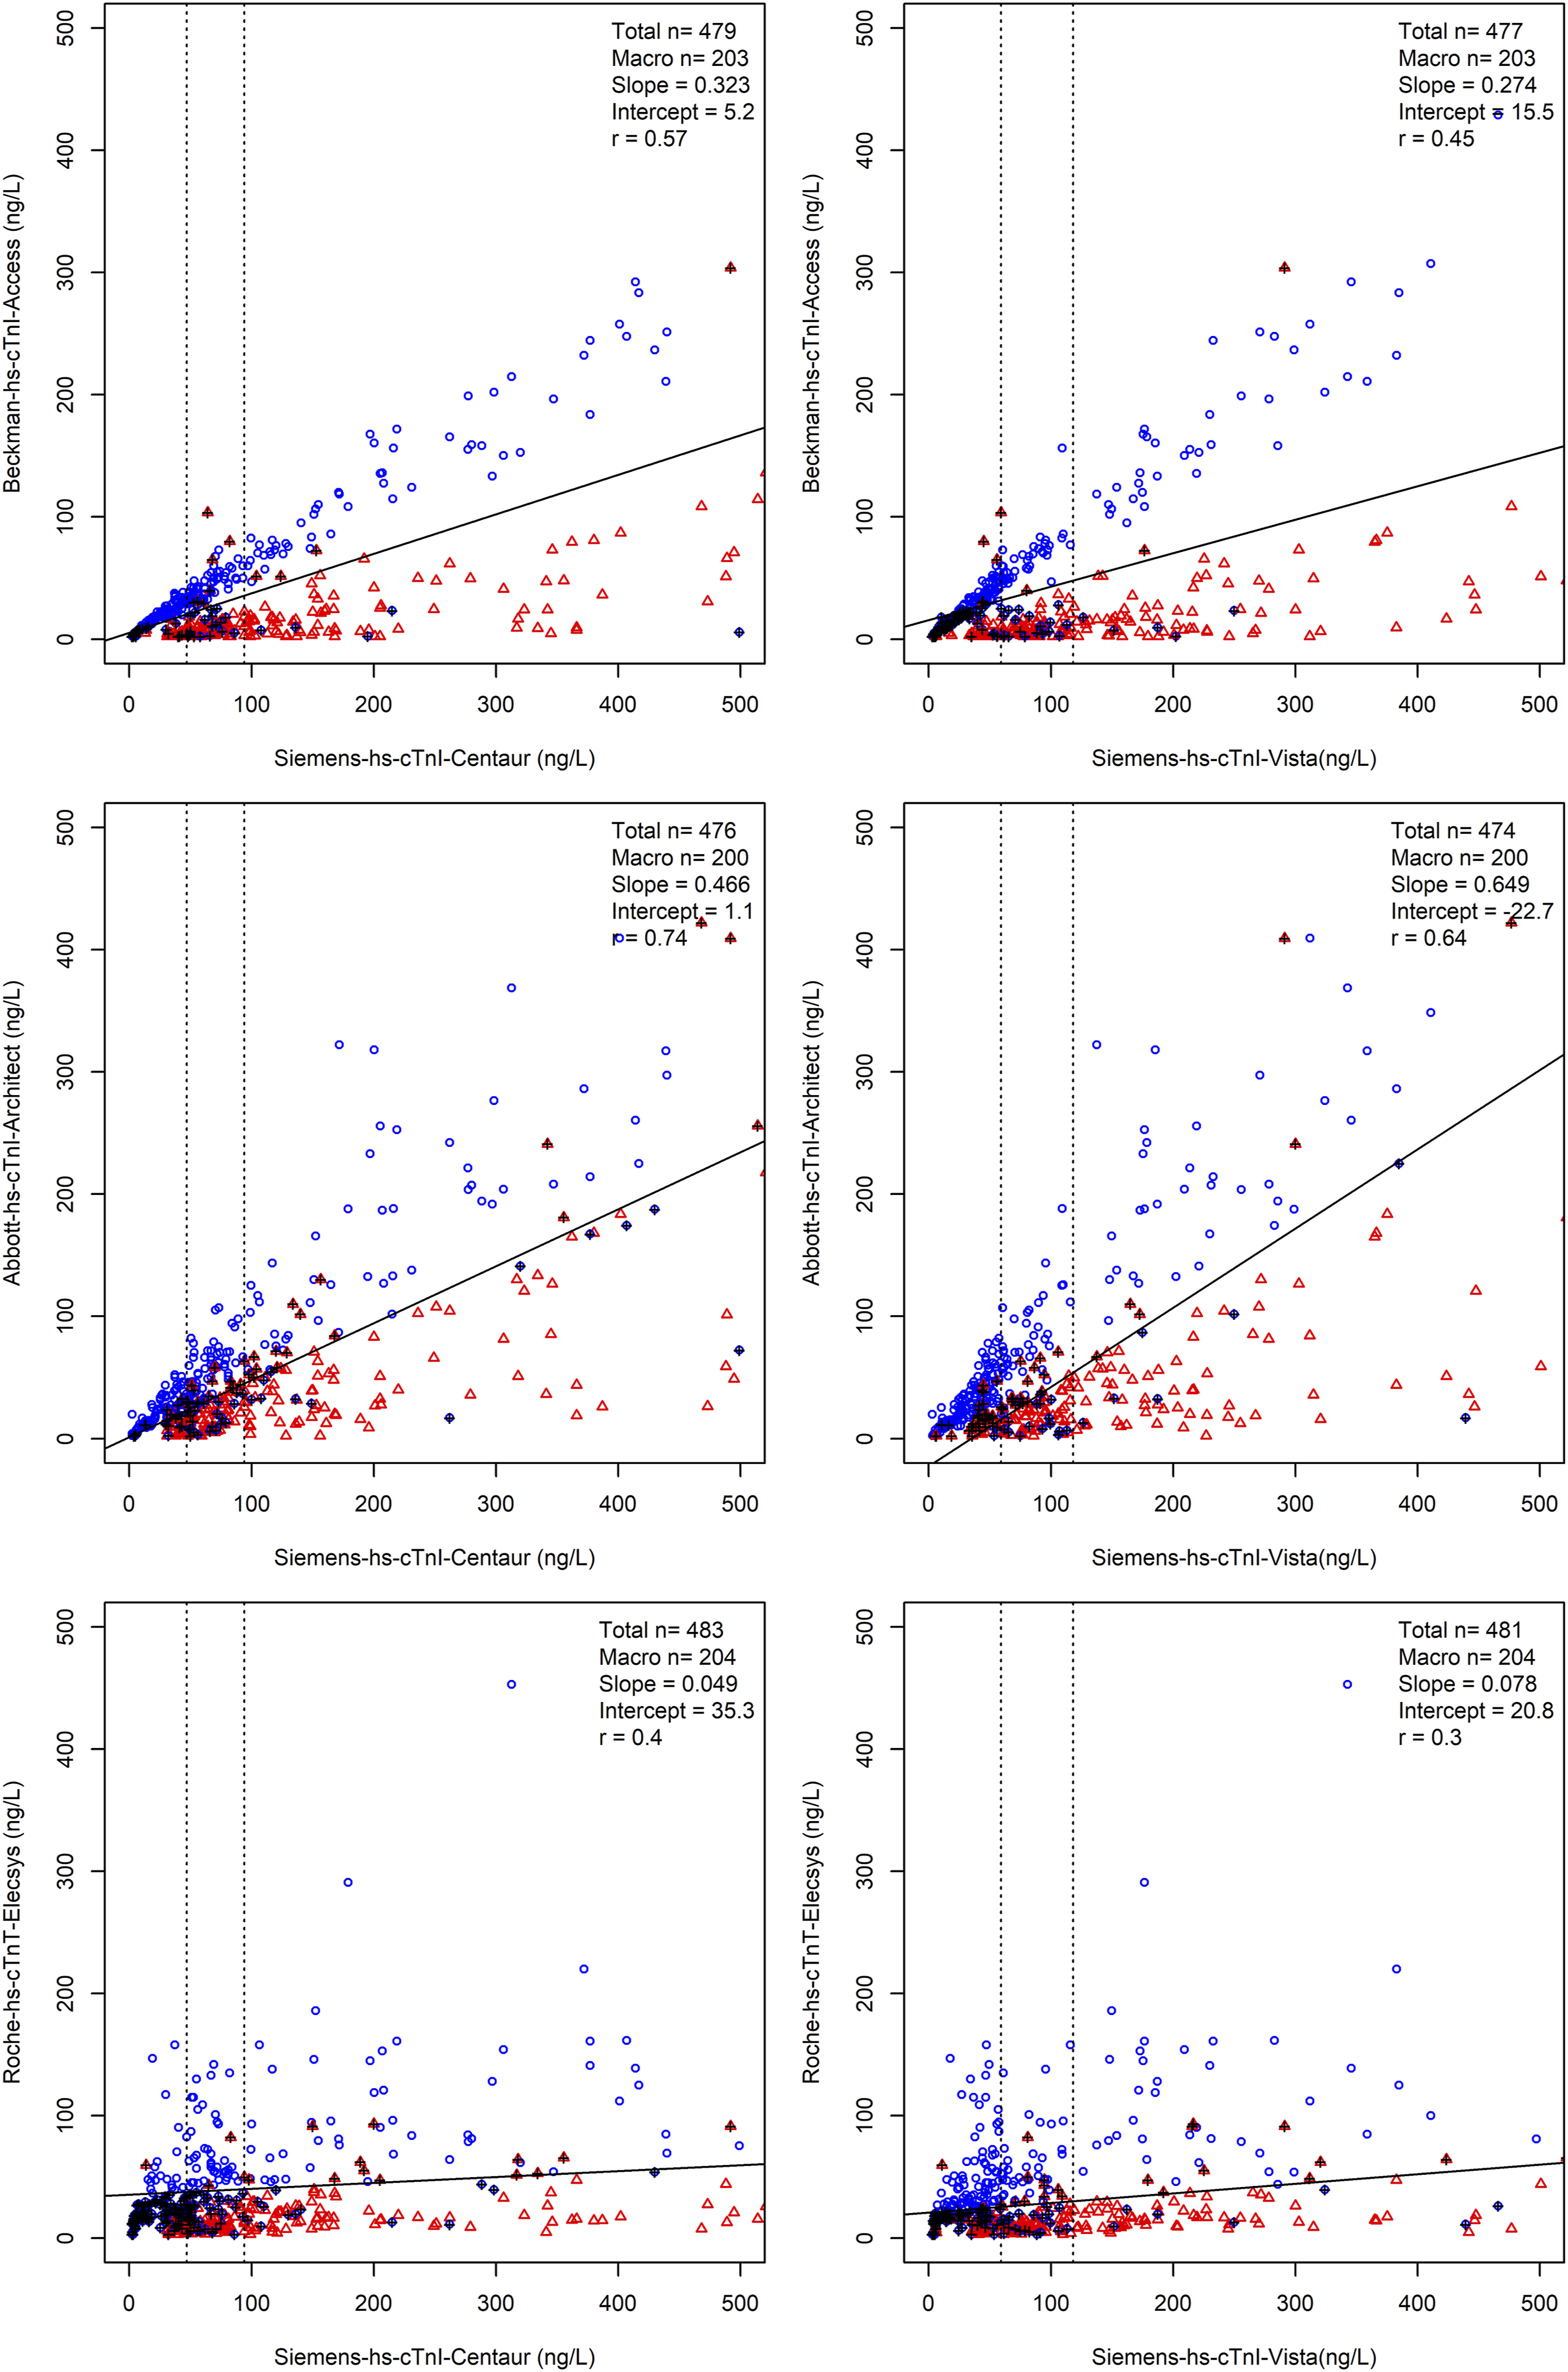
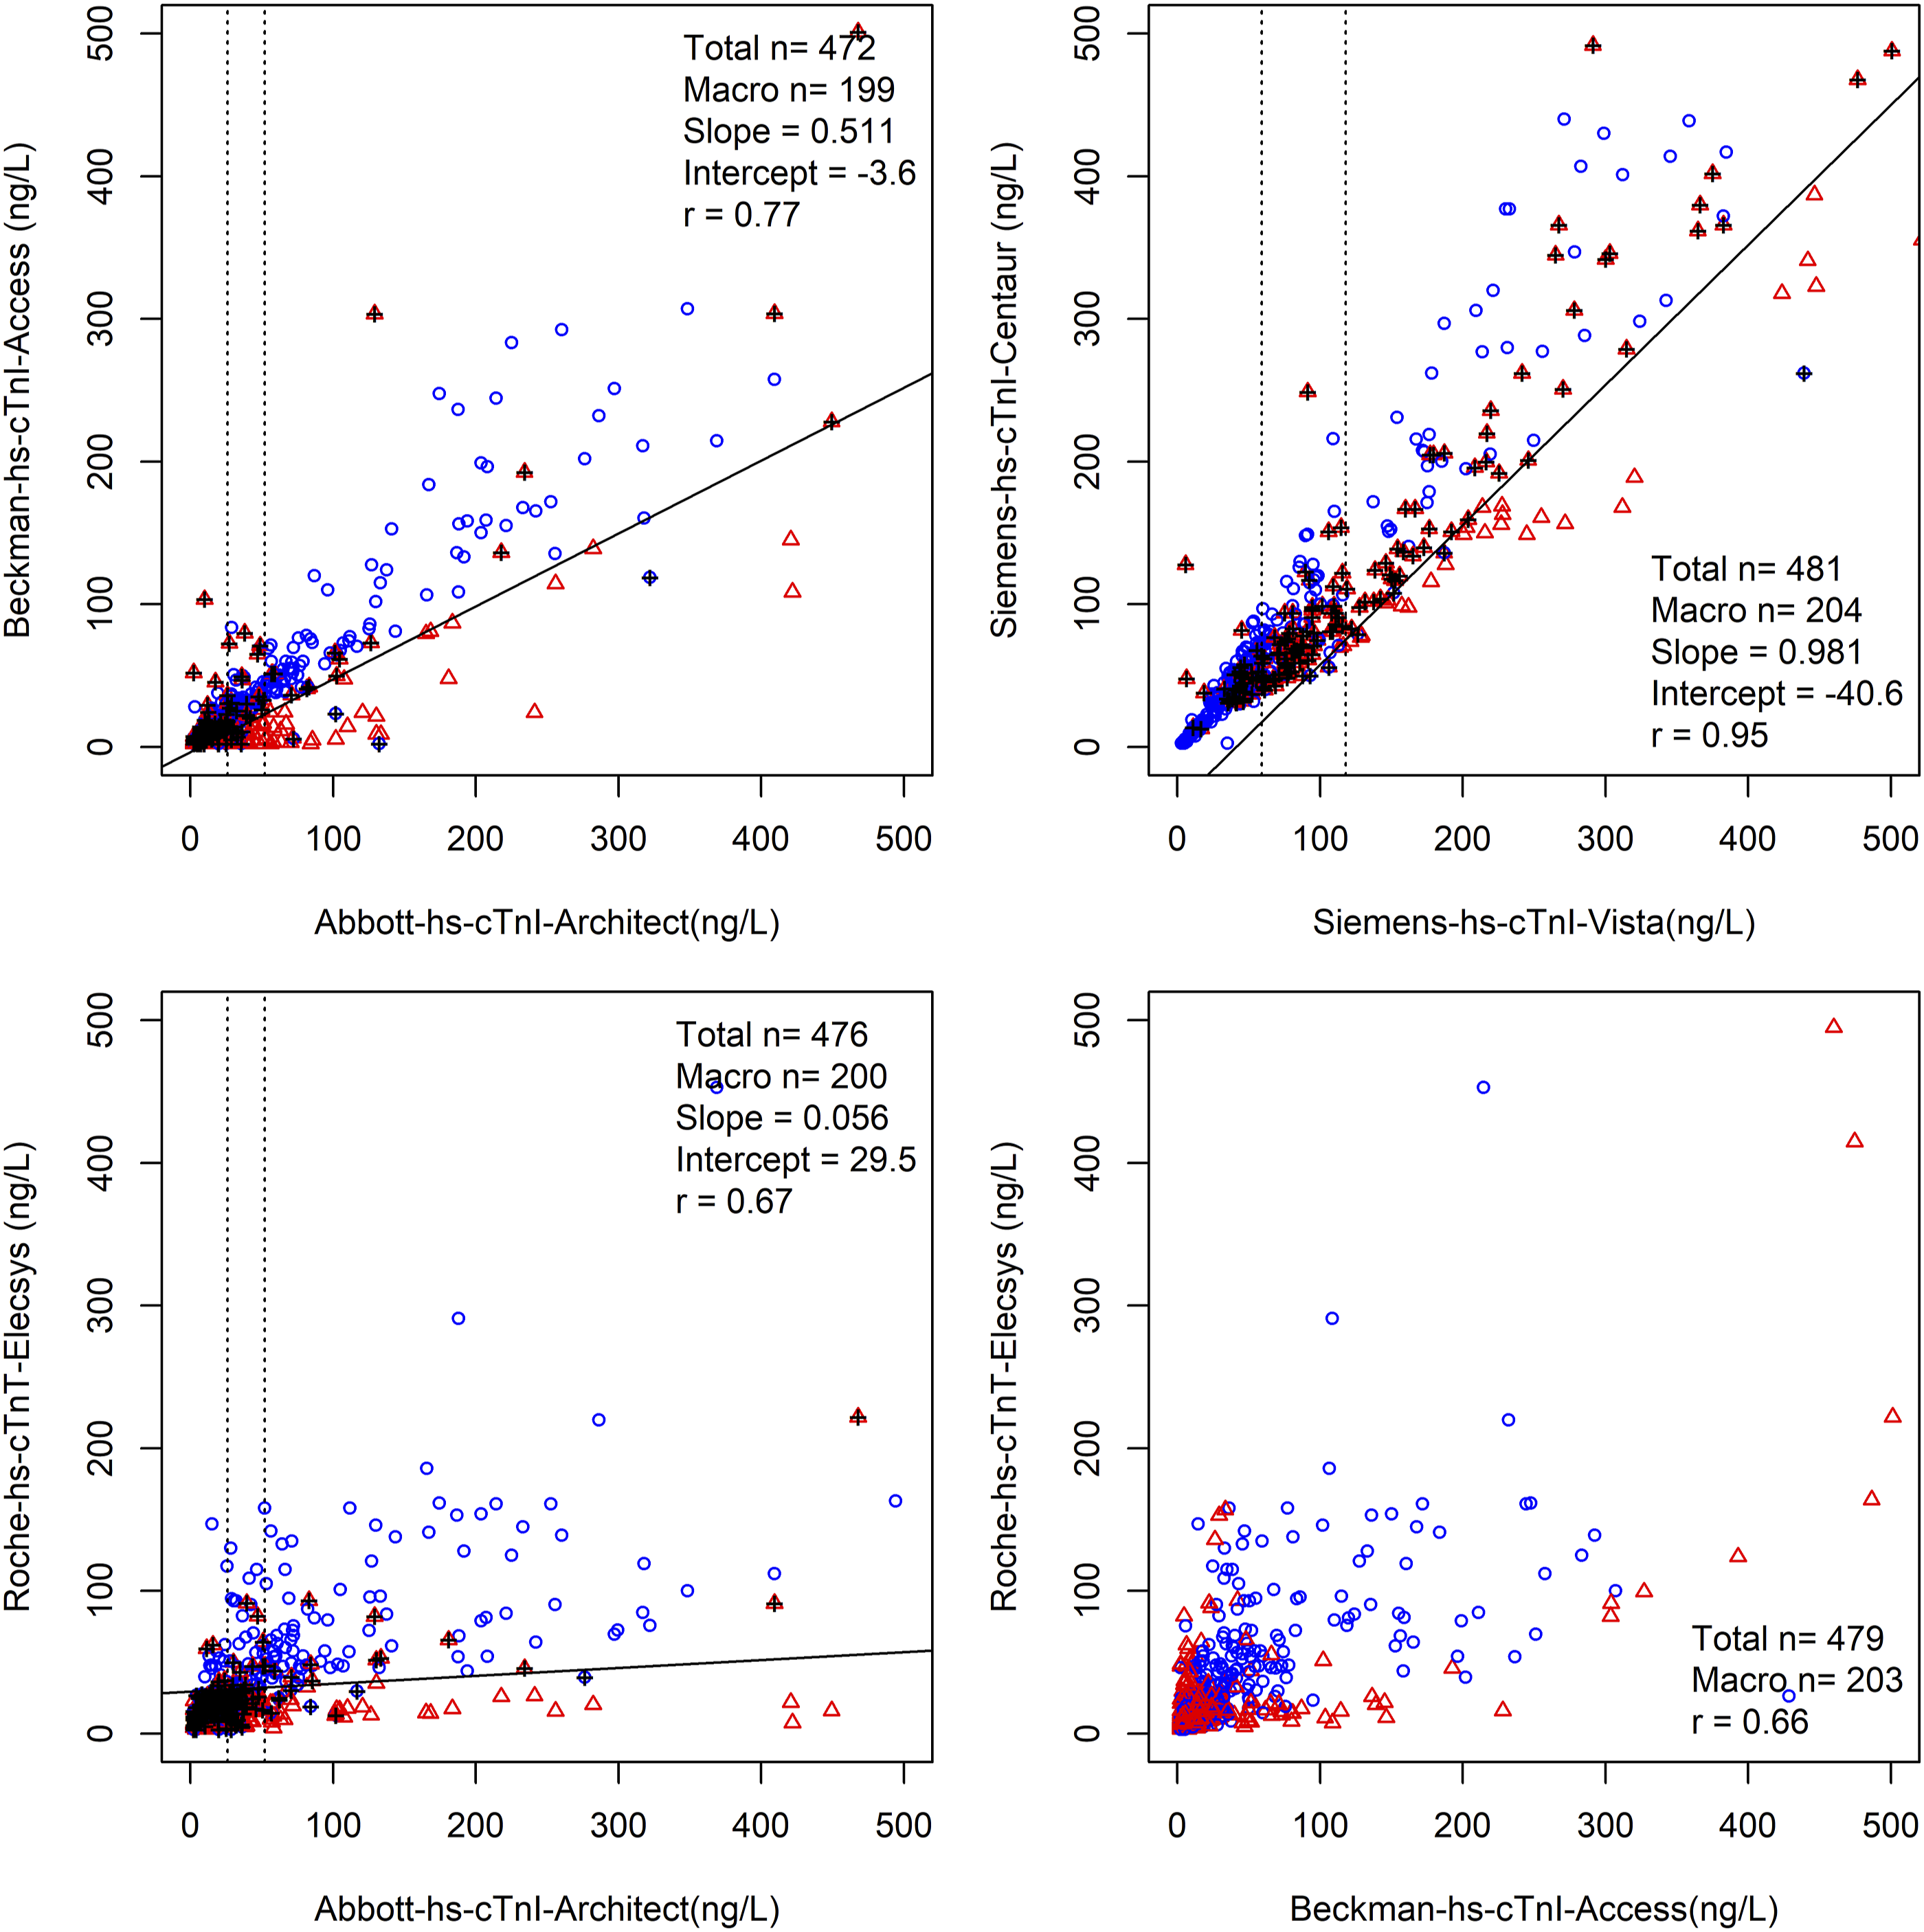
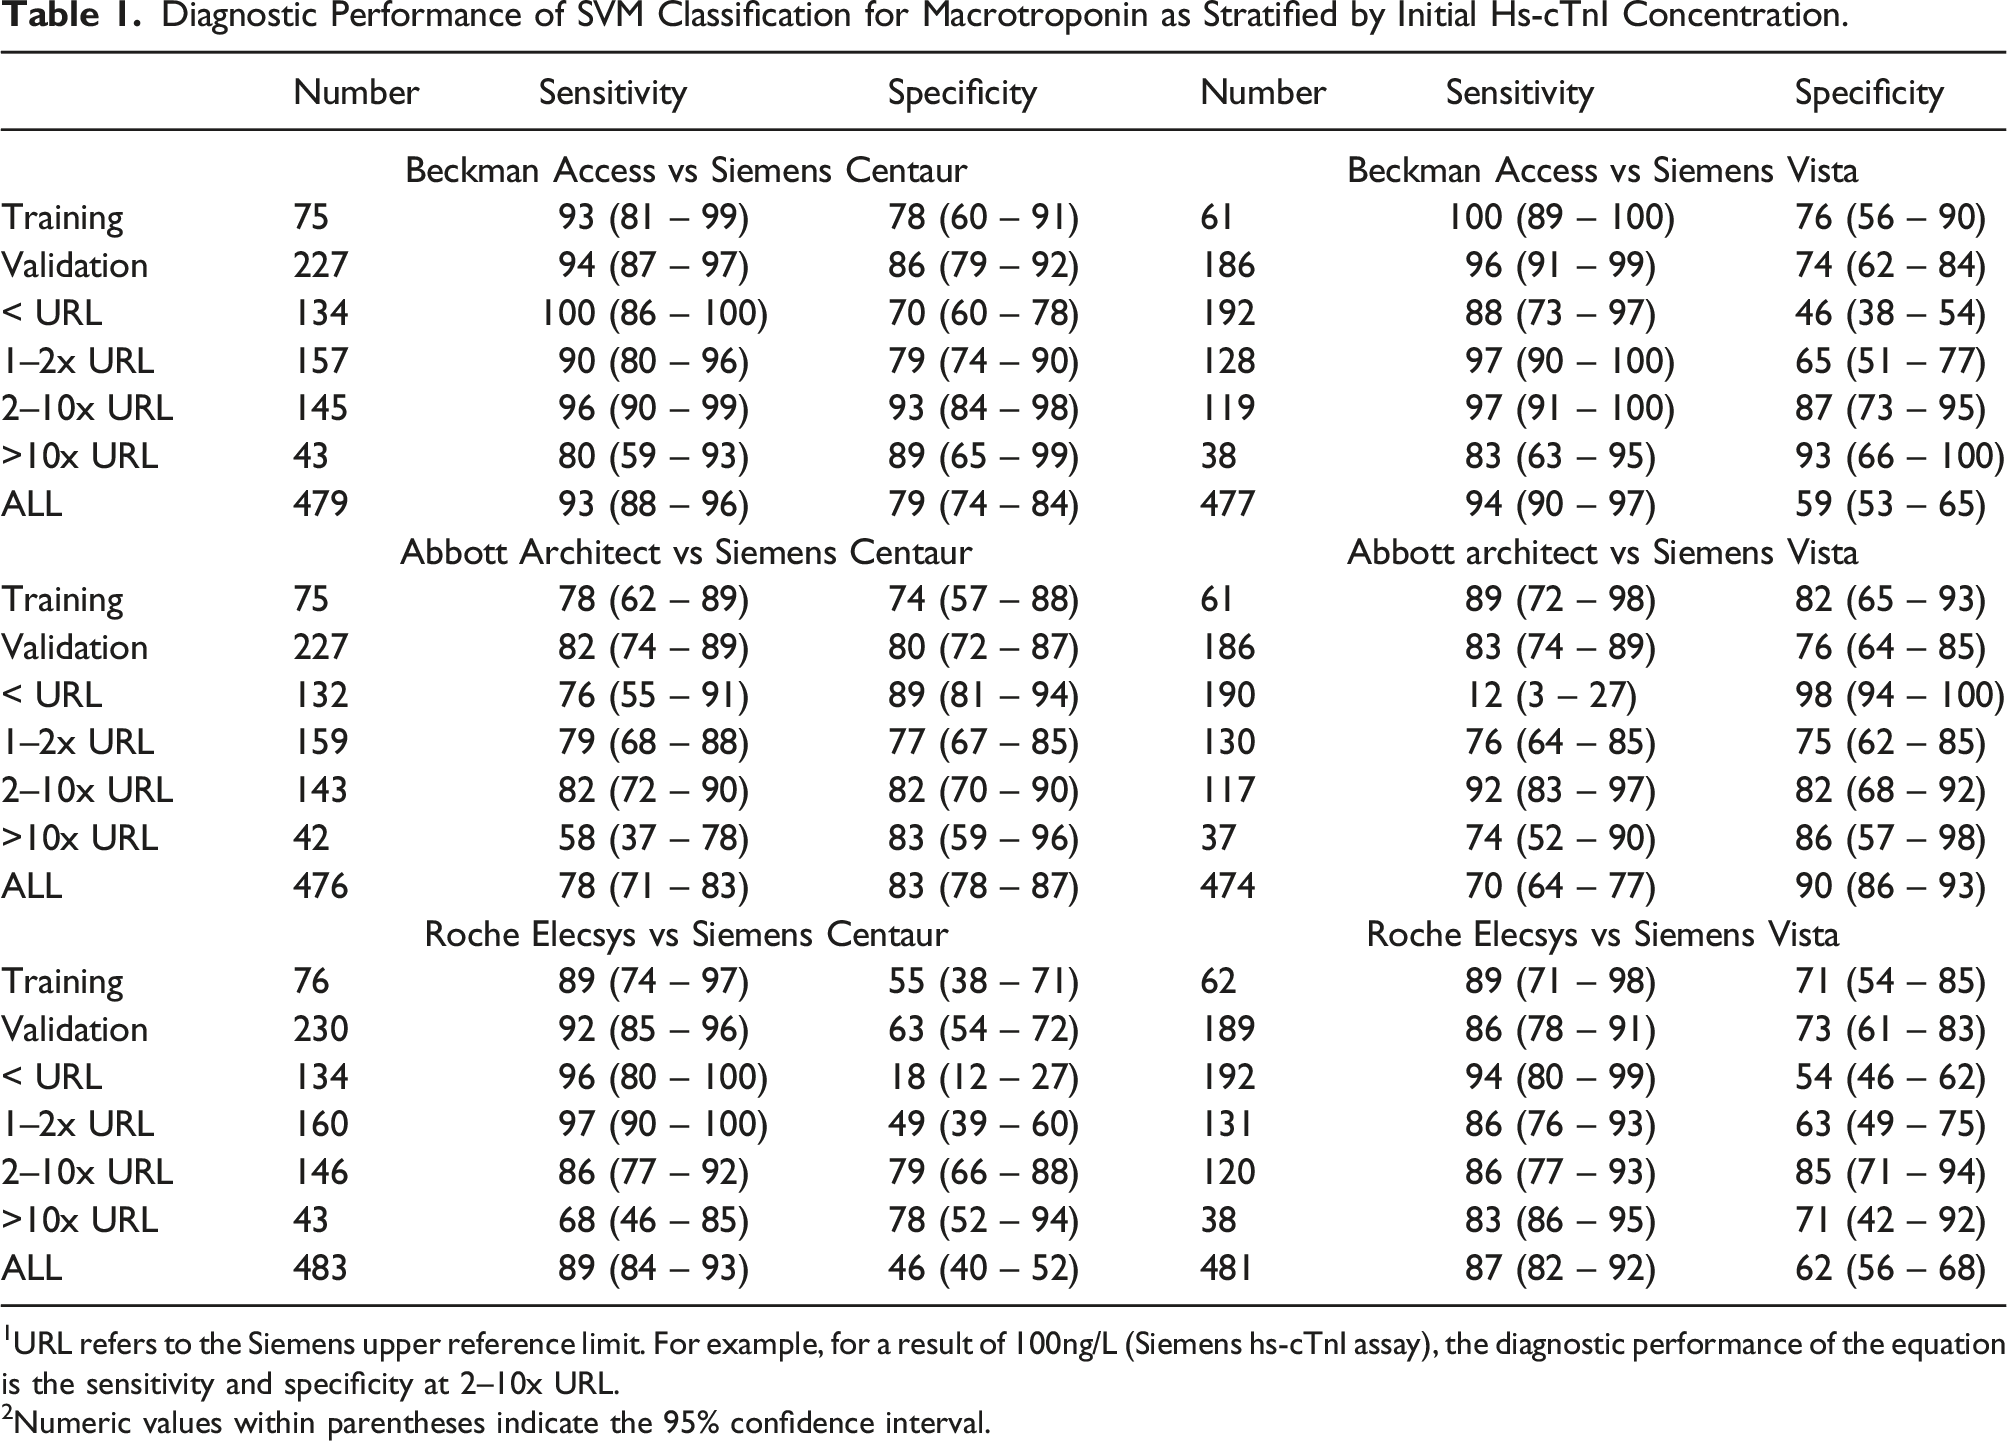
Of note, we achieved high classification performance, comparable with PEG precipitation, using pairs of results between the Beckman hs-cTnI Access assay and both Siemens hs-cTnI assays for results between 2 and 10x non–gender-specific URL of the Siemens hs-cTnI assay.
Diagnostic Performance of SVM Classification for Macrotroponin as Stratified by Initial Hs-cTnI Concentration.
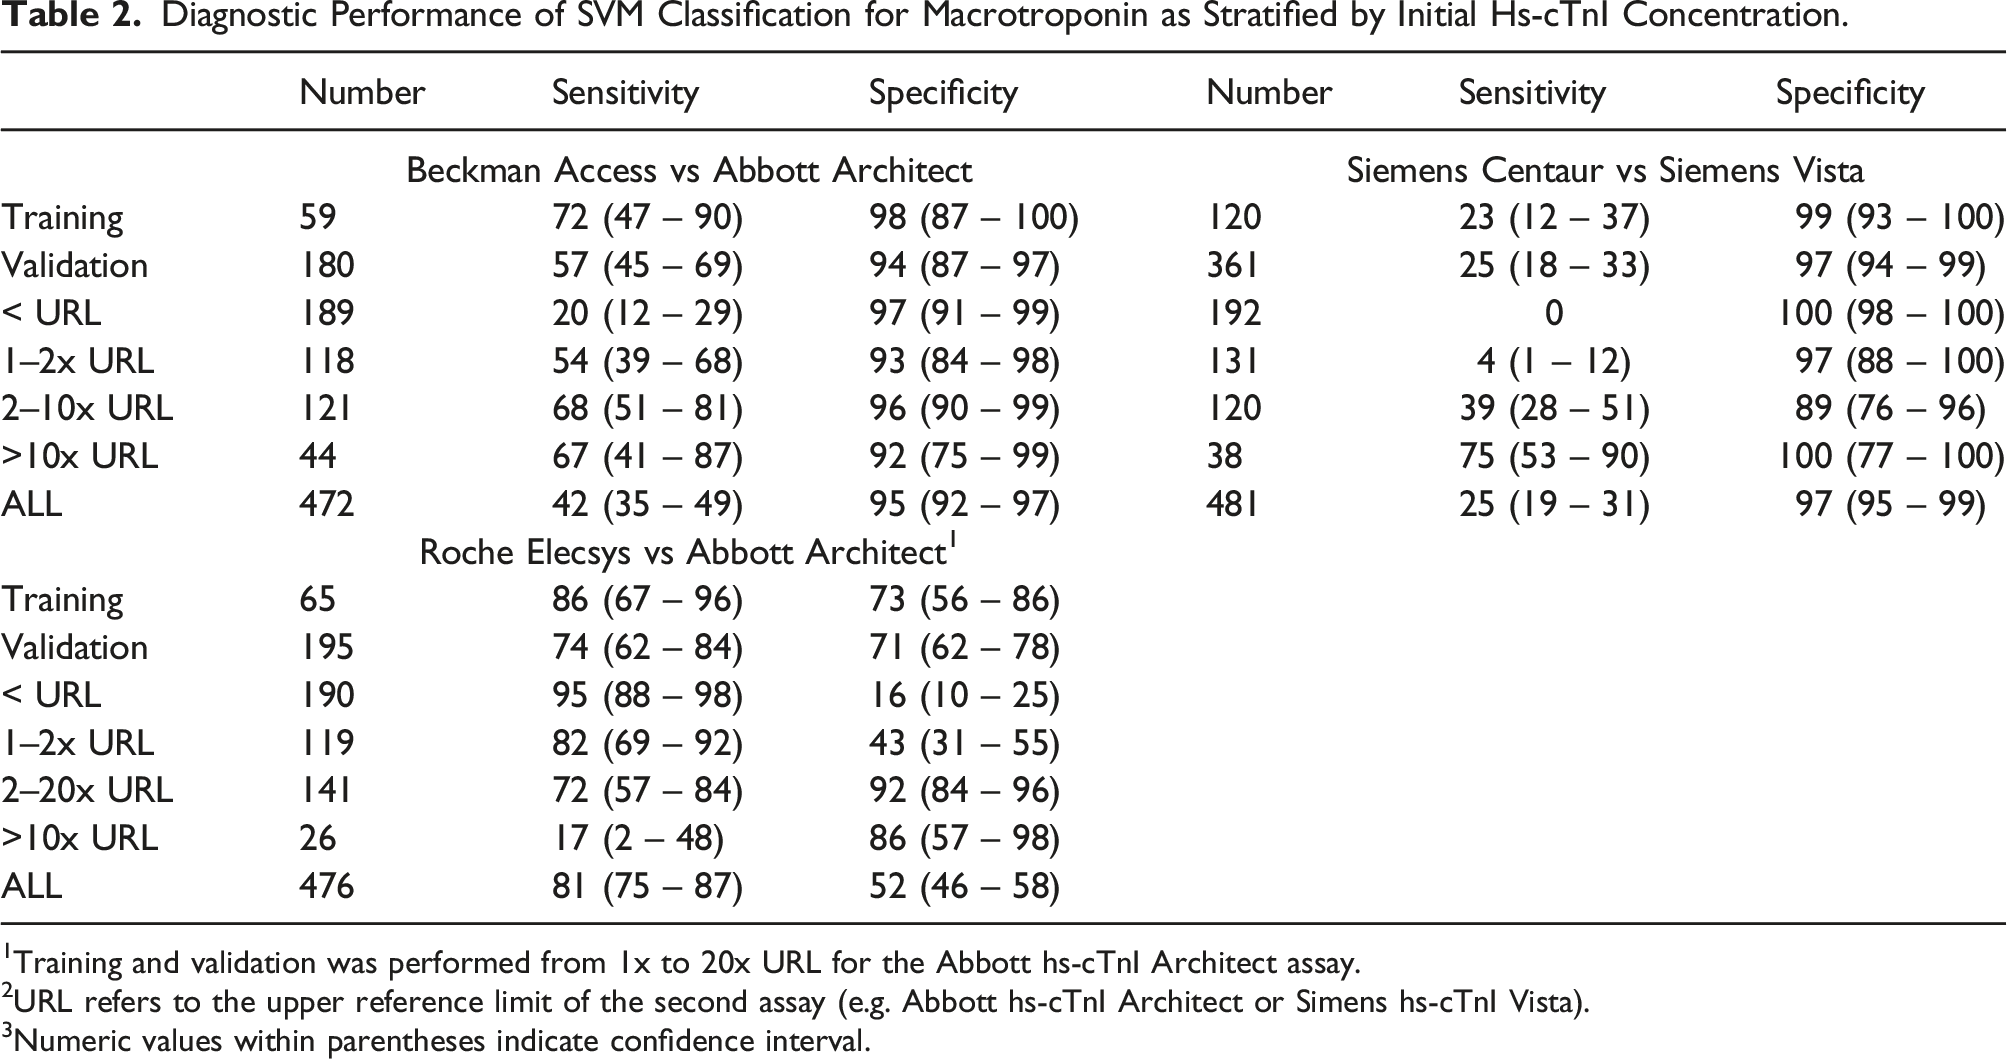
1Training and validation was performed from 1x to 20x URL for the Abbott hs-cTnI Architect assay.
2URL refers to the upper reference limit of the second assay (e.g. Abbott hs-cTnI Architect or Simens hs-cTnI Vista).
3Numeric values within parentheses indicate confidence interval.
Discussion
In this study, we examined the performance of two methods of detecting macrotroponin. Our findings indicate high specificity by PEG precipitation can be achieved on two assays, including the Siemens hs-cTnI Vista and the Abbott hs-cTnI Architect assays, allowing the detection of macrotroponin when recovery by PEG precipitation is low (e.g. < 20%). Furthermore, our study indicates SVM classification could achieve similar sensitivity and specificity to PEG precipitation when comparing results from the Siemens hs-cTnI Vista or Siemens hs-cTnI Centaur assays between 2x and 10x URL with results from the Beckman hs-cTnI assay. SVM classification can also generate high specificity for detecting macrotroponin for certain other assay combinations; however, the sensitivity was lower. The combination of these methods allows rapid identification of macrotroponin, reducing the need for complex, time-consuming and expensive laboratory testing.
In this study, we demonstrated that the prevalence of macrotroponin varied between laboratories. Assay reactivity to macrotroponin likely contributes to the observed discrepancy between assays (e.g. between Beckman hs-cTnI Access and Siemens hs-cTnI assays). The lowest and the highest apparent prevalence of macrotroponin between laboratories demonstrated a 5-fold difference. Our findings previously indicated that specimens with macrotroponin typically had a lower result by the Beckman hs-cTnI Access assay than the Abbott hs-cTnI architect. 2 However, this study identified a higher prevalence of macrotroponin from a community laboratory using the Beckman hs-cTnI Access assay compared to a hospital laboratory using the Abbott hs-cTnI Architect. Our findings suggest patient characteristics such as a predominant community cohort, compared to hospitalised patients, may be a significant contributor, although this was not further investigated.
Our identification of an apparently large proportion of specimens affected by macrotroponin using the Siemens hs-cTnI Centaur assay is likely related to the selection of specimens with initially elevated troponin results from a community cohort with a low to moderate risk of ACS. Once all results (including results within URL) are accounted for, the proportion of total results affected by macrotroponin is estimated at 3.5%. 9 This is consistent with studies indicating a 0–27.6% prevalence of cardiac troponin autoantibodies, depending on underlying cardiac disease. 10 The pretest probability based on clinical information and local prevalence will determine how PEG, the discrepancy between assays, or other macrotroponin detection methods is most helpful in the local setting.
We found the presence of apparent ‘baseline’ immunoreactivity on all assays we have examined, although the effect can be mitigated for some assays by limiting the analysis to specimens with elevated cTn. This matrix effect caused by the PEG solution leads to increased recovery at low hs-cTn concentration in those without macrotroponin. Variable or low protein content may be a contributing factor.11,12 Interestingly, different hs-cTn assays are affected to varying extents. At a high cTn concentration, however, all assays showed some ability to differentiate macrotroponin. For our study, we identified two assays, the Siemens hs-cTnI Vista and the Abbott hs-cTnI Architect, that were suitable for PEG precipitation for initial results above URL. For both assays, a low post-PEG recovery of < 20% residual immunoactivity carried a high specificity and could be used to detect the presence of macrotroponin with a low false positive rate.
SVM analysis is a supervised machine learning method, which allows for efficient classification and discrimination between data pairs. In our study using data from pairs of hs-cTn assays, our approach seeks to identify a linear equation with the maximal distance (separation) between the data points and the line itself. This is performed by identifying a subset of decision points, referred to as support vectors. The analysis minimises misclassification by calculating and optimising a ‘cost parameter’. Thus, the method is less prone to the effects of outliers.
SVM classification follows our working theory that differences in immunoreactivity to macrotroponin account for a significant proportion of the discrepancy observed. This classification method does not account for other physiological or assay-related factors (e.g. post-translational modifications, truncations and heterophile antibodies), which may also contribute to the discrepancy between cTnI assays. It also does not account for the potential interindividual heterogeneity of cTnAABs. Indeed, we identified significant interindividual variation for those with and without macrotroponin following the addition of cTn-TIC standards [3]. SVM classification was also unsuitable for detecting macrotroponin for certain assay combinations (Beckman hs-cTnI access vs Roche hs-cTnT Elecsys; Figure 4). Despite this, our study demonstrates the potential to often rapidly confirm a patient with macrotroponin, when initial results are > 2x URL. Discrepant results > 2x URL on the Abbott hs-cTnI Architect have also been used to indicate specimens potentially affected by macrotroponin. 13 This approach is highly specific, similar to PEG precipitation, when certain assay combinations are used.
Using a Criteria of ≥2x URL and ≤URL for the Detection of Macrotroponin.
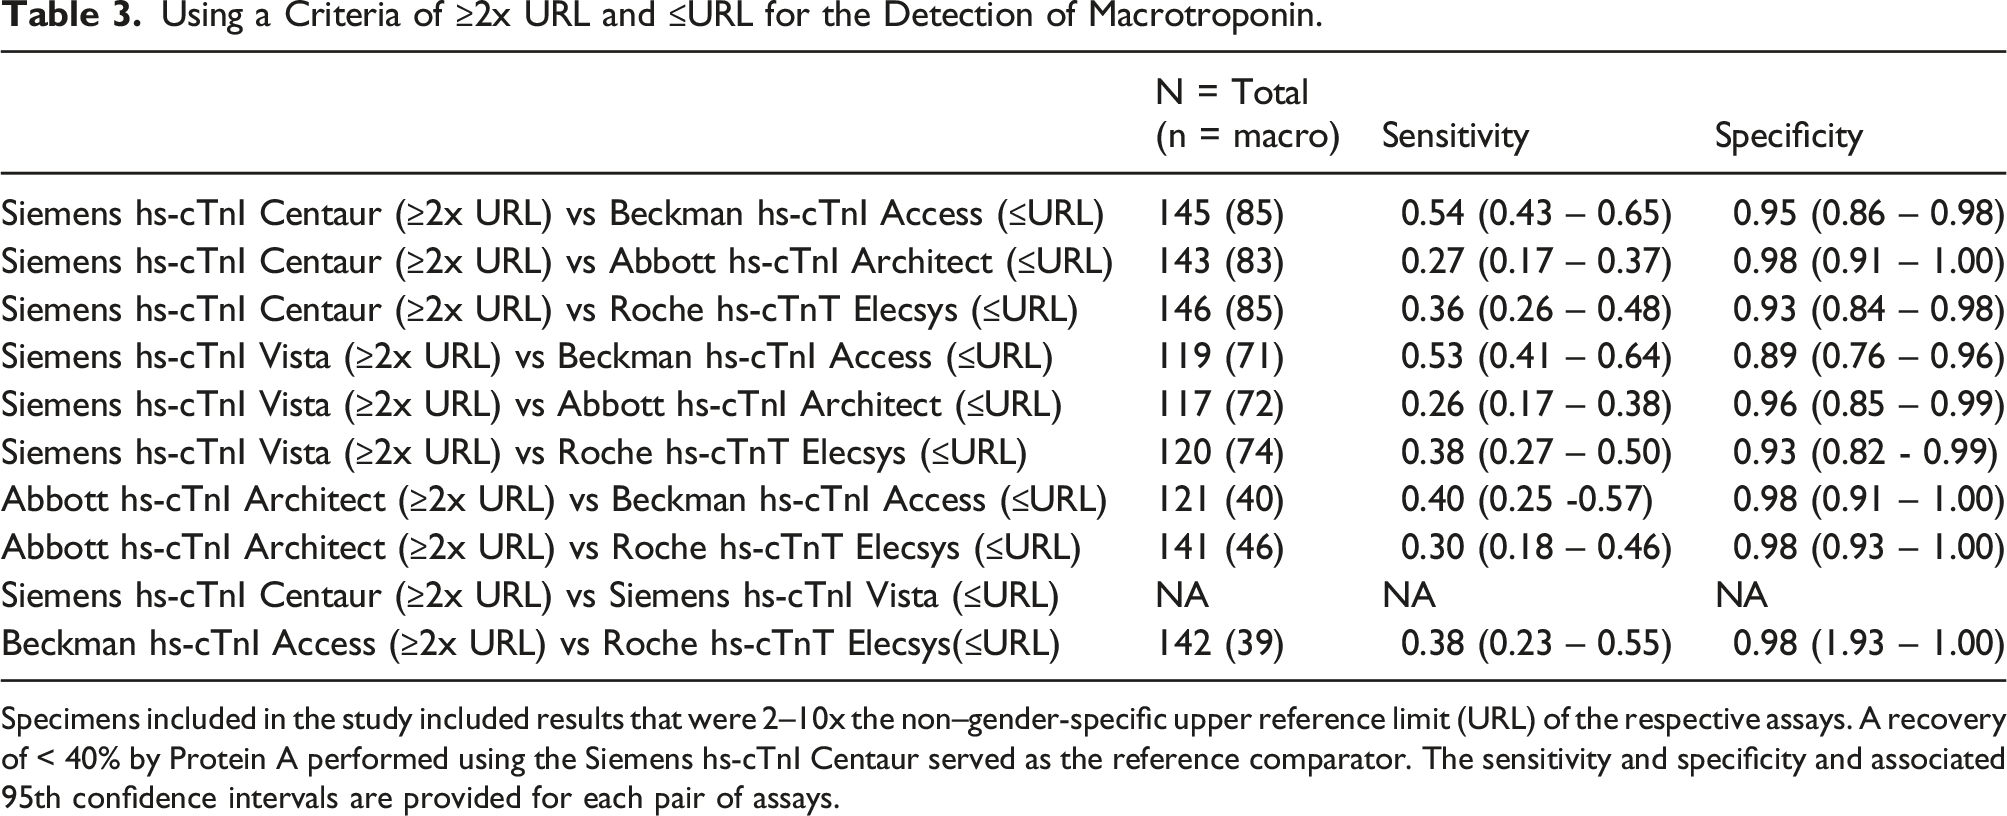
Specimens included in the study included results that were 2–10x the non–gender-specific upper reference limit (URL) of the respective assays. A recovery of < 40% by Protein A performed using the Siemens hs-cTnI Centaur served as the reference comparator. The sensitivity and specificity and associated 95th confidence intervals are provided for each pair of assays.
The latest recommendations from IFCC recommend laboratories to investigate for antibody-mediated interferences when results are incongruent with clinical findings. 8 PEG precipitation and assay by an alternative hs-cTn method are routinely available investigations. Where clinical suspicion of macrotroponin is high, performing multiple methods such as heterophile blocking tube, PEG precipitation and testing on alternative hs-cTn platforms simultaneously can significantly reduce analysis time. As the methods we present here demonstrate high specificity (i.e. low false negative), findings consistent with macrotroponin can be shared with the clinician. Where macrotroponin is not detected by these methods, a specimen can be sent to a reference laboratory for further evaluation by methods such as Protein A, gel filtration chromatography or sucrose gradient ultracentrifugation.
We have recently demonstrated that macrotroponin is frequently associated with the elevation of troponin results without a clear cardiac cause. Such patients have improved survival compared to those without macrotroponin.1,4 Furthermore, patients with macrotroponin have a longer length of stay when admitted to a hospital using an assay with greater macrotroponin reactivity. The findings suggest that rapid identification of macrotroponin may be useful for both prognostication and reducing hospital stay. 14 However, until further evidence is at hand, routine testing of macrotroponin is not recommended.
Although there is a low correlation between hs-cTnI and hs-cTnT as these are fundamentally different biomolecules being assayed, the combination of Roche hs-cTnT Elecsys with some hs-cTnI assays was also able to identify macrotroponin with high specificity. Interestingly, a PEG precipitation cutoff for the hs-cTnT of ≤ 85% yielded a high specificity of 97.7% (95%–100%), with a sensitivity of 21% (11%–32%; Supplemental Table 5 and Supplemental Figure 1). The findings are consistent with our previous description of a small group of patients with macrotroponin (15%) who have simultaneously low recovery for cTnT and cTnI following Protein A immunoglobulin depletion. 2 However, using PEG precipitation for hs-cTnT to identify macrotroponin affecting troponin I assays may cause difficulty in interpretation due to the potential presence of isolated macrotroponin T. 15
This study’s limitations include using freeze-thawing of specimens, which may limit transferability. However, some studies indicate that macrotroponin complexes are stable for long periods. 16 Other specimen types such as EDTA plasma, a potentially important factor, have also not been evaluated in this study. 15,17 In this study, we did not compare every specimen with a molecular weight-based method (e.g. GFC or sucrose gradient method 18 ) due to the impracticalities of testing a large number of samples. However, the Protein A method used in this study, including some specimens presented in this study, has been extensively compared to gel filtration chromatography.2,3 Additionally, mixing studies with HyTest cTn-TIC demonstrates two distinct populations reflecting those above and below a recovery of 40%. 3
The Protein A method used in this study, may have a high imprecision, particularly at low concentrations. A number of specimens in this study (n = 16; 3.3%) have a Protein A recovery between 35 and 45%, which, on repeat, may alter classification. Although not implemented in this study, reliability of Protein A or related immunoglobulin depletion can be enhanced by measuring IgG following Protein A immunoglobulin depletion (< 0.3 g/L) and duplicating measurements. Finally, as described for macroprolactin, further optimising the PEG precipitation method may lead to a better correlation with measurements as determined by Protein A or GFC size analysis. 19
In summary, we describe and identify practical alternatives for detecting macrotroponin, which may be used by clinical laboratories or on existing datasets where multiple troponin assays have been evaluated. These methods can be optimised for high specificity, reducing the need for more complex, specialised and laborious laboratory methods.
Supplemental material
Supplemental Material - Practical approaches to the detection of macrotroponin
Supplemental Material for Practical approaches to the detection of macrotroponin by Leo Lam, Campbell Kyle in Annals of Clinical Biochemistry
Footnotes
Acknowledgements
The authors acknowledge Associate Professor Chris Florkowski, Canterbury Health Laboratories, Dr Carol Siu; Wellington SCL laboratories and Mr John Woodford; PathLab New Zealand for arranging specimen exchanges between laboratories.
Declaration of conflicting interests
The author(s) declared no potential conflicts of interest with respect to the research, authorship, and/or publication of this article.
Funding
The author(s) received no financial support for the research, authorship, and/or publication of this article.
Ethical approval
This study utilised biospecimens and data that were de-identified. The Health and Disability Ethics Committee of New Zealand considered this work as a laboratory quality activity outside the scope of its review process. The study received locality approval from LabTests, Auckland, New Zealand.
Guarantor
LL and CK.
Contributorship
All authors have made a substantial contribution to the concept or design of the article; or the acquisition, analysis, or interpretation of data for the article; and drafted the article or revised it critically for important intellectual content.
Supplemental material
Supplemental material for this article is available online.
References
Supplementary Material
Please find the following supplemental material available below.
For Open Access articles published under a Creative Commons License, all supplemental material carries the same license as the article it is associated with.
For non-Open Access articles published, all supplemental material carries a non-exclusive license, and permission requests for re-use of supplemental material or any part of supplemental material shall be sent directly to the copyright owner as specified in the copyright notice associated with the article.