
Abstract
Background
The European Society of Cardiology (ESC) guidelines recommend a dynamic (0-1h) cardiac troponin (cTn) determination for non-ST elevation myocardial infarction diagnosis. For patients with low cTn levels, a discharge from emergency can be considered. Nevertheless, cTn cutoffs for discharge are lower than the limits of quantification proposed by laboratory reagent suppliers.
Aim
Validate cTn assay on the Elecsys STAT kit.
Materials and methods
Precision, trueness, repeatability and within-laboratory variability were calculated from internal quality control and plasma pooled at 5.78 and 10.73 ng/L. Accuracy was calculated from external quality control. Uncertainty of measurement was calculated from (i) the uncertainty of the standard and control values and (ii) by precision from pooled plasma. Distribution of precision results from pooled plasma has been evaluated by bootstrap simulations. Dilution linearity tests with patient plasma were performed to evaluate the method for values near 5 ng/L.
Results
Precision and trueness ranged from 1.35 to 4.45% and from 0.14 to −3.74%, respectively. Accuracy results ranged from 101.40 to 104.90%. Within laboratory variability was 2.91%. Uncertainty ranged from 3.66% to 19.90% for higher (2188) to lower values (5.78 ng/L). Bootstrap simulations allowed utilization of precision data from pooled plasma to evaluate cTn assay. The method was linear from 4.48 to 39.80 ng/L. A linear regression model best described the data.
Conclusion
Elecsys STAT method provides accurate cTn results, including patients with cTn results categorizing them as ‘rule-out’ in the ESC guidelines.
Introduction
High-sensitivity cardiac troponin (hs-cTn 1 , 2 ), 1 I or T, is recommended for the diagnosis and management of patients with chest pain suspected of non-ST elevation myocardial infarction (NSTEMI 3 ). 2 This assay is critical for emergency departments as it involves the ability to rule out a large proportion of patients. The algorithm is relevant in the context of overwhelmed emergency medical services, partly by successive waves of Covid.
Thus, for the Roche Elecsys® hs-TnT 4 kit, 3 patients with concentrations at first sampling (T0 5 ) < 5 ng/L or T0 <12 ng/L and with a delta 6 T0/T1 (or 0h/1h rule-out and rule-in algorithm as named by the ESC) less than 3 ng/L where T1 7 as a second sampling at 60 +/− 10 min from the first sampling can be ruled out. 2 In this way, in terms of length of stay, resource utilization and predicted diagnostic accuracy, 4 it is important that the laboratory's hs-cTn methods can quantify low cTn 8 concentrations, following ESC 9 guidelines.
However, for the Elecsys® hs-TnT kit, but also for other hs-cTn suppliers, concentrations of interest to categorize ‘rule-out’ patients are lower than the limit of quantification (LLOQ) 10 proposed by the supplier (<13 ng/L for Elecsys Roche®). 3 While cTn quantification is likely possible, little data describes kit performance (e.g. precision and trueness) at low concentrations. Besides, to achieve the shortest possible turnaround time (Tat 11 ), suppliers provide STAT 12 (Short Turnaround Time) 5 kit, reducing quantification delay (9 instead of 18 min for Elecsys®). However, there is limited data comparing STAT and non-STAT reagents, especially for conditions not recommended by the supplier.
Consequently, to fulfil the ESC recommendations, 2 the objective of our study was to evaluate the performance of the hs-TNT STAT Elecsys® assay, especially for cTn concentrations categorizing patients as ‘rule-out’.
Material and methods
Immunoassays
Assays were performed at Montauban Hospital, on a Cobas® Pro e801 module (Roche Diagnostics®, Meylan, France), on a single measuring cell. The used kit was Elecsys® TnT Gen 5 STAT, with a TaT of 9 min. Briefly, the reaction implies ruthenium and biotin-labelled antibodies. They form sandwich complexes with TnT from the sample, corresponding to an electrochemiluminescence sandwich immunoassays. 6 According to instructions shift from the manufacturer, following guidelines from CLSI EP17-A2 13 7 lower limit of quantification (LLOQ 14 ) and limit of detection (LOD) 15 are 13 and 5 ng/L, respectively. The manufacturer performed an internal study to evaluate LOD and LLOQ with a precision coefficient of variation (CV) lower to 20% for hs-TnT STAT Elecsys®. LLOQ for a CV 16 below 10 and 20%, and LOD were 3.22, 1.00 and 2.72 ng/L. The manufacturer data was used to compare the reagent evaluation results for concentrations <13 ng/L, as no further data is available in the literature.
Samples
Assays to evaluate hs-TnT quantification performances were conducted on two types of samples, Roche® internal quality controls (IQC) and patient samples. IQCs were PreciControl® (PC) TN1 and 2 17 , for targets (peer) at 25.7 and 2115 ng/L, respectively.
Because IQCs do not evaluate the performance of the method for values <13 ng/L, assays were performed on patient samples for this range of concentrations. Plasma samples were all collected from lithium heparin tubes (Alloga®, France) and used within 8 h from patient sampling. On arrival at the laboratory, the samples were centrifuged at 2000g 18 for 10 min. Samples were first analyzed according to the physician's prescription and then stored for subsequent use in this study. To assess within-day and interday precision and bias, plasma samples were pooled to achieve concentrations close to 5 and 10 ng/L (pool plasma 1 and 2 [PP1 (5,78) and PP2 (10,73)]). 19
To assess linearity, plasmas from patients with cTn (i) <3, (ii) 15, (iii) 20 and (iv) 150 ng/L were selected. Samples with cTn <3 ng/L were used to dilute plasmas with higher concentrations. After appropriate dilution, the samples were pooled to achieve a suitable volume for processing. The concentration from the resulting pool was measured to determine the initial concentration.
Troponin quantification was part of routine patient care, without any additional procedures. Therefore, no institutional review board or ethics-committee approval was required, in accordance with the French regulations on biomedical research.8,9
External quality controls (EQC 20 ) were also used to evaluate the accuracy of the method for concentrations >13 ng/L. 10 The EQC were provided by Probioqual®, a French supplier and member of EQALM 21 (European organization for external Quality Assurance providers in Laboratory Medicine).
Precision, trueness, accuracy, and uncertainty of measurement
Roche® IQC were performed on hs-TnT method as recommended by the supplier. For pooled plasma between-run assays, samples were stored at −20°C, as recommended by kit supplier. Before the assay, the plasma was thaw at room temperature (23°C), vigorously shaken and then centrifuged at 10,000g for 5 min.
Trueness and precision were evaluated from within-day and between-run assays. For within-day validation, 56 samples from the four levels (PCTN1/2 26,3 and 2188 ng/L, respectively, and the two levels of plasma 5,78 and 10,73 ng/L, respectively) were analyzed 2 times per day. For between-days validation was determined one sample by level from PCTN IQC during 7 days and 2 samples by level for pooled plasma also during 7 days. Trueness was defined as the percentage deviation from the nominal level (trueness = [(concentrationn - target concentration)/concentrationn]*100, and precision as the coefficient of variation, calculated by the equation CV = (sd/m)*100; where CV= coefficient of variation, sd 22 = standard deviation, m 23 = mean.
Within-laboratory reproducibility was calculated by the following equation:

where Rw: within-laboratory reproducibility and RSD: relative standard deviation.
Within-run precision (repeatability) was calculated and was used as a target to evaluate between-run precision (between run precision = 0.75*repeatability precision).24,2511,12
For IQCs, trueness was obtained from the TIQCON® software 13 and inter laboratory IQC system.
The method accuracy was evaluated using the EQC program from Probioqual® (France; member of EQALM). 14 The accuracy was expected to be within 80%–120% range. 15
Uncertainty of measurement (UM
26
)16–19 was calculated according to two equations, one considering IQCs and the other precision data from pooled plasma. From the IQC, UM calculation was based on (i) UM associated to calibration standard (supplier data) and (ii) IQC (PCTN) data analyzed using TIQCON® inter laboratory quality control. Then, UM was calculated according to the following equation:

As suggested by international guidelines, if no calibration UM is available, precision data generated from pooled plasma was used to calculate the UM by the following equation:

For both methods to calculate uncertainty, the expanded value (U) can be predicted as:

To evaluate the evolution of UM with cTn concentration, concentration was plotted against UM.
Linearity
To evaluate the linearity 20 of the method on concentrations <13 ng/L, four pooled plasma samples were diluted with samples free of cTn (initially measured <3 ng/L). The selected model (e.g. linear and quadratic), better describing the data, allowed to conclude about the linearity of the method.
Each dilution point obtained was repeated (n = 10). The mean achieved during repeatability was used as the theoretical target. The cTn quantified during repeatability was compared to this theoretical target to evaluate the trueness of the repeatability. Repeatability precision was assessed as described in Precision, Trueness, Accuracy, and Uncertainty of Measurement section.
cTn from patients
T0, T1 and deltaT0/T1 of patients from emergency department were recorded for 6 months in order to compare biological variability of cTn to UM. Data analysis focused on samples with cTn results <10 ng/L, at which value (i) patients are often at low risk for NSTEMI and (ii) UM is strongly increasing. The variation of T1–T0 was calculated by the following equation: variation (%) = (DeltaT1-T0/T0)*100.
Statistics
The distribution of the plasma pooled results (normal distribution) was evaluated by a Shapiro–Wilk test. If the distribution was normal, the data was used for parametric bootstrapping or variance comparison of precision results.
A parametric bootstrap method was applied to precision data from pooled plasma to assess the distribution and dispersion of results. A simulation of n=100,000 was used on the initial data (n = 10 and 10 for PP1 and PP2, respectively). The simulation results were expressed as mean and 95% prediction interval (m; [IP5;95]). Precision results were considered valuable in assessing the method if the bootstrap simulations led to a small dispersion of results. Bootstrap simulations were assessed using wessa® online software 21 and R software (R4.3.1; ‘function [bootstrap_result, alpha]’). To evaluate the linearity of the method up to low cTn values (<13 ng/L), dilution data was combined into a single dataset. To determine whether the model that best describes the method is a line or a curve, a linear regression was compared to a quadratic regression. The model selected was the one with the highest r^2 and adjusted r^2 and lowest Akaike information criterion (AIC)/Bayesian Information Criterion (BIC) scores. Goodness of fit were assessed using Mycurvefit 22 online software and R software (R4.3.1; function ‘lm’, ‘ggplot2’).
The level of significance was set at p < 0.05.
Results
Precision, trueness, accuracy, and uncertainty of measurement
Precision, trueness, accuracy, and uncertainty of measurement for IQC and pooled plasma.
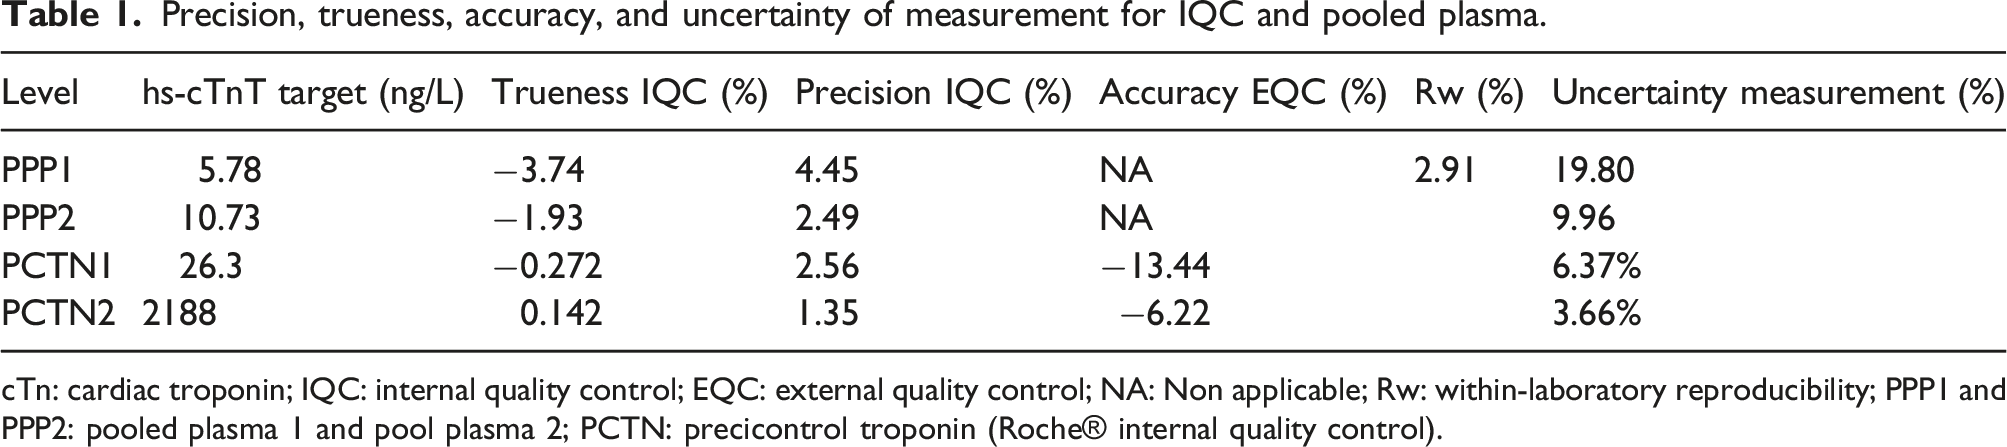
cTn: cardiac troponin; IQC: internal quality control; EQC: external quality control; NA: Non applicable; Rw: within-laboratory reproducibility; PPP1 and PPP2: pooled plasma 1 and pool plasma 2; PCTN: precicontrol troponin (Roche® internal quality control).
Precision results from bootstrap simulation were 5.75 ng/L IP95 [5.70; 5.81] and 10.52 ng/L IP95 [10.43; 10.63] from wessa software and 5.75 ng/L IP95 [5.68;5.82] and 10.53 ng/L IP95 [10.43; 10.63] for pooled plasma 1 and 2, respectively.
Uncertainty measurement was plotted against cTn concentration in Figure 1. Uncertainty of measurement applied to cTn concentrations.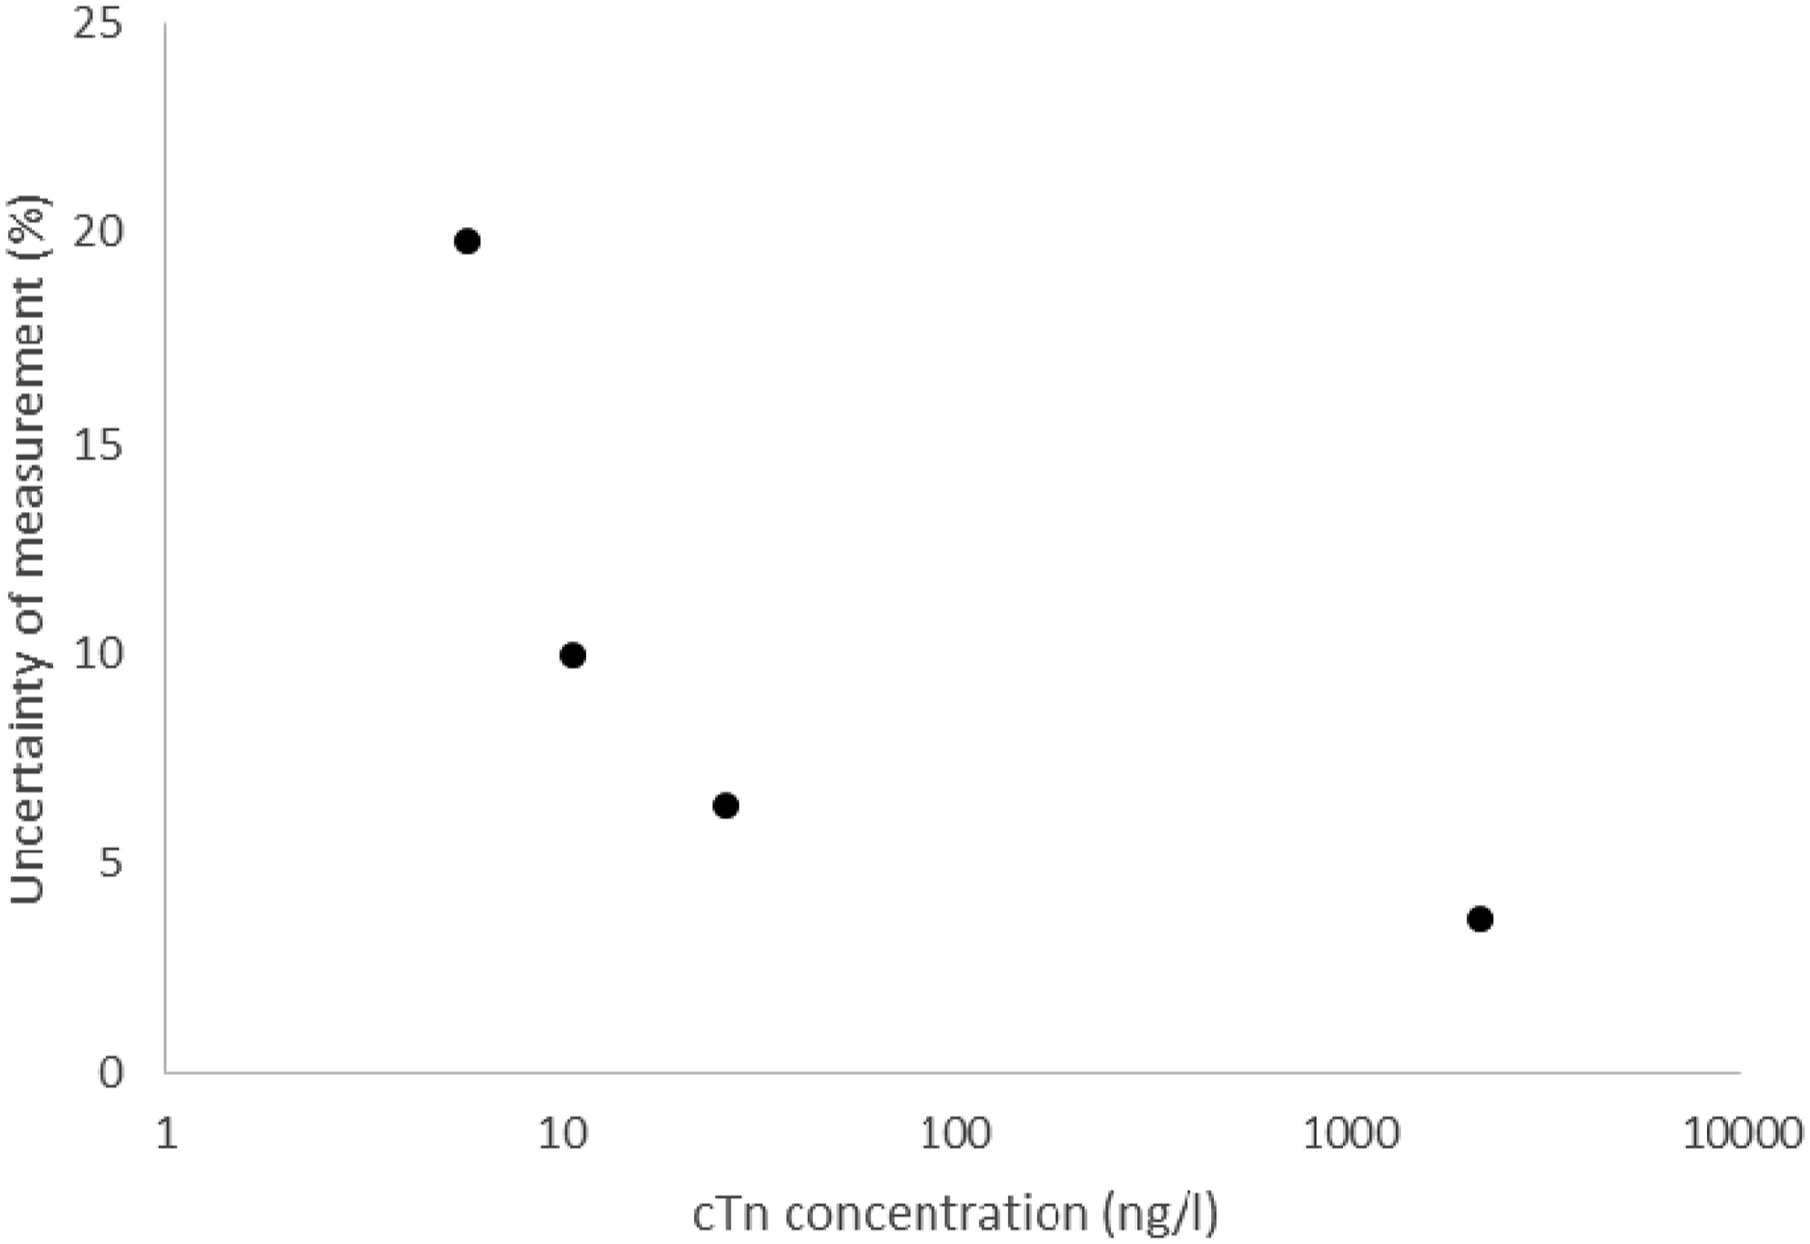
Linearity
Results of dilution to assess the linearity of the method.
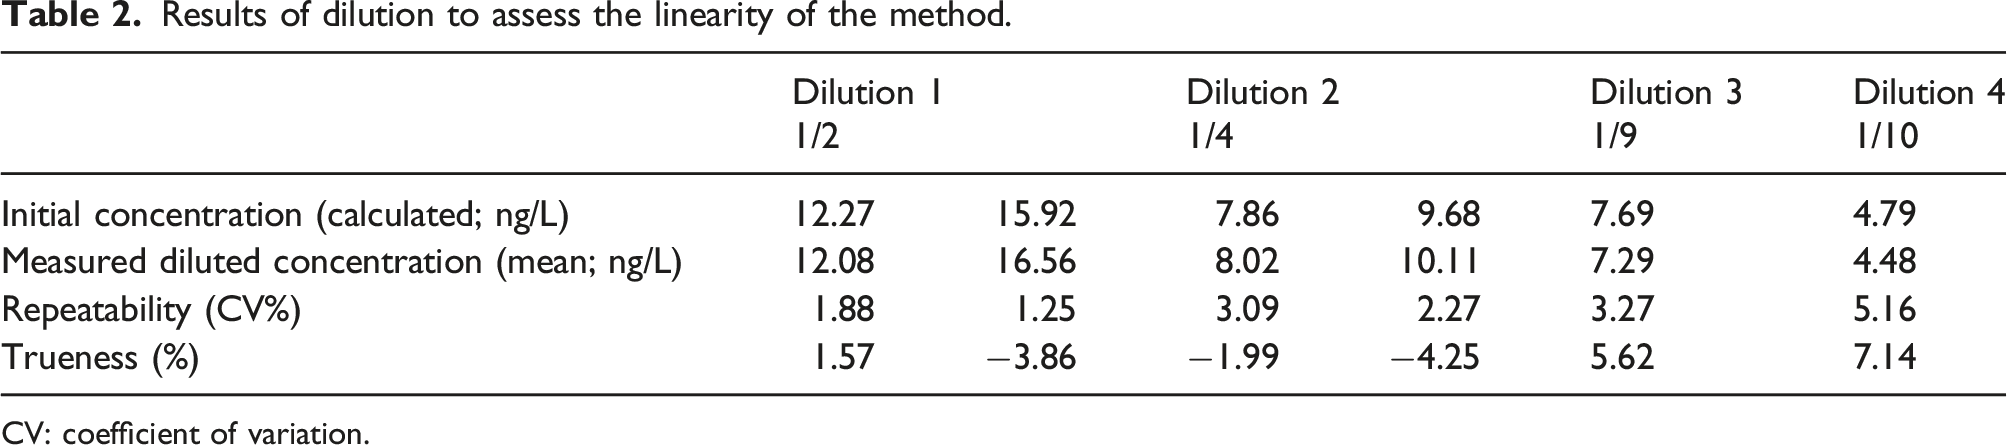
CV: coefficient of variation.
A linear regression (y= −0.36 + 1.01x + ε with ε describing random error; r^2 = 0.9985 and adjusted r^2 = 0.9981 for Mycurvefit software; y = 0.348 + 0.989*x + ε with r^2 = 0.9985, adjusted r^2 = 0.9981 from R) was the model that best described the data, compared to a quadratic equation (y = −0.3739347 + 1.011,893*x - 0.00004518025*x2 + ε for Mycurvefit software; y = 0.00,287 + 1.04*x −0.00,127*x2 + ε with r^2 = 0.9986, adjusted r^2 = 0.9976 from R), based on AIC and BIC scores 27 (2.952 and 3.346 for AIC and BIC; 4.947 and 5.539 for AIC and BIC, for linear and quadratic models, respectively, from Mycurvefit and 7.364 and 6.739 for AIC and BIC; 9.129 and 8.296 for AIC and BIC, for linear and quadratic models, respectively, from R). The regression was linear between 4.48 and 39.8 ng/L.
Discussion
The aim of our study was to explore the performance of the hs-TnT 23 assay by the Roche Elecsys® STAT kit, especially for low cTn values (<13 ng/L). Indeed, the latter are of particular interest for the rule-out strategy of the ESC recommendations. 2 ESC algorithm require quantification of low cTn concentrations (<5 and delta T0-T1<3 ng/L for Elecsys Roche®). 2 However, few studies detail analytical validations for cTn kit within these measured ranges.
Thus, the linearity was validated over a range from 4.48 to 39.80 ng/L. The best model to describe the data was a linear plot like Chenevier-Gobeaux et al. 20 Such data is relevant to interpret sandwich reaction signal measurements. Indeed, measurement range linearity on low values is not consistent for the sandwich immunoassay.
Quantification performance for low cTn values is supported by precision and trueness data, both from IQC and PP. Indeed, the latter are consistent with those observed in other studies.20,24 Between-run assay data (precision, trueness) interpretation, obtained from pooled plasma, could have been limited by the number of samples used. This limitation has been overcome by data simulated by bootstrap, 12 which confirms the validity of the results obtained in these tests. By resampling the observed data, bootstrap provides a way to estimate the variability of an analytical method. It allows to generate multiple ‘bootstrap samples’ by randomly selecting observations from the original dataset with replacement. Besides variability, bootstrap is of particular interest to assess the precision of an analytical method for small sample sizes. Indeed, this method generates additional synthetic datasets by resampling the available data. It provides more robust estimates of variability. Few teams applied this simulation tool in biochemistry. Nevertheless, it has been validated in several fields, including haematology, 12 and is useful to study the distribution of results on small samples, as in our study.
In fact, different analytical performances between instruments could explain discrepancies in sensitivity/specificity for the diagnosis of NSTEMI between methods. Varying performance, and therefore UM, would lead to a variation in cTn around the ‘rule-out’ threshold at T0 but also in the delta T0/T1. A knowledge of UM at such levels would allow a grey zone to be established in order to avoid misrecognized patients requiring extended management (e.g. measurement of cTn at T3 28 ). However, a proper estimation of UM is required. Indeed, given the performance of our method (UM = 20%) and ESC algorithm, 2 one should observe many values in T1<T0 where physiologically cTn does not vary. Therefore, such performance could lead to an error in management, with an inappropriate rule-out. Nevertheless, (i) data from clinical trials are reassuring 2 and (ii) only 11% of T0–T1 pairs observed in our laboratory have a cTn 20% different at T1, compared to T0, with no accounting for cTn biological variability in these results. Consequently, UM, but also precision, increase seems analytically consistent with decreasing cTn concentrations. Considering precision data detailed from other studies, one can expect UM (equation (2) prediction) to be close to those calculated in our study. However, these performances cannot be achieved for all cTn measurement methods.
Indeed, point-of-care (POCT) 29 systems2,25 are (i) not sufficiently sensitive and (ii) precision data may lead to large UM, to effectively distinguish patients in rule-out situations. Nevertheless, POC technologies are improving26–28 and recently proposed systems have analytical performance close to that of laboratory instruments. For our activity, this approach is still not appropriate because (i) the management of POCs 30 with clinical departments can be challenging, (ii) they are expensive compared to automated measurements and (iii) our system can deliver a result with an optimal TaT (pneumatic transport of samples, centrifugation of Barricor™ tubes in 3 min on a dedicated centrifuge and a STAT reagent that delivers results in 9 min; average turnaround time in our laboratory of 30 min after receipt of the sample). Furthermore, the TaT cannot be an argument on its own, as the ESC recommends sampling at T1 without waiting for the T0 result.
The ability to provide a result with a short TaT relies mainly upon the configuration of STAT to quantify cTn.5,29 This involves merging the two reaction steps into one. However, limited data is available on the analytical performance of this reagent configuration, from Roche® or other suppliers. Available Roche® data for cTn suggests that performance is not quite the same with or without STAT.25,30 No comparison was made between the two approaches in our study. But based on (i) data described in our study, with performance close to that observed for values > LLOQ and (ii) Roche Elecsys® reagent data without STAT, it could be assumed that the STAT method is robust for low concentrations (<13 ng/L) of cTn.
Conclusions
In conclusion, our study supports that the Elecsys® STAT hs-TnT assay to accurately determine cTn, even for values below the LLOQ documented by the supplier. From an analytical point of view, it is therefore possible to follow the ESC recommendations, especially for ‘rule-out’ orientation of patients.
Footnotes
Declaration of conflicting interests
The author(s) declared no potential conflicts of interest with respect to the research, authorship and/or publication of this article.
Funding
The author(s) received no financial support for the research, authorship and/or publication of this article.
Ethical approval
None (part of laboratory activity).
Guarantor
MD.
Contributorship
All authors contributed to the design and execution of the study. All authors reviewed and edited the manuscript and approved the final version.