
Abstract
Background
The management of patients presenting with symptoms suggestive of acute coronary syndrome is a significant challenge for clinicians. Guidelines for the diagnosis of acute myocardial infarction require a rise and/or fall of cardiac troponin, along with other criteria. Knowing what constitutes a significant delta change from baseline is still unclear and the literature is varied.
Methods
We compared three methods for determining cardiac troponin delta changes (relative, absolute and z-scores) for detecting acute myocardial infarction in 806 patients presenting to an emergency department with symptoms suggestive of acute coronary syndrome. Blood specimens were collected at admission and 2, 3, 4 and 6 h postadmission and tested on the Roche Elecsys high-sensitivity troponin T assay.
Results
A positive diagnosis for acute myocardial infarction was found in 39 (4.8%) patients. ROC AUC showed better performance for the absolute and z-score delta change (0.959–0.988 and 0.956–0.988, respectively) compared with relative delta change (0.921–0.960) at all time points in the diagnosis of acute myocardial infarction. Optimal timing for the second sample was at 4–6 h postadmission.
Conclusions
Although not statistically significant, the results show a trend of absolute and z-score delta change performing better than relative delta change for the diagnosis of acute myocardial infarction. The z-score approach allows for a single cut-off value across multiple high-sensitivity assays which could be useful in the clinical setting. Our study also highlighted the importance of interpreting cardiac troponin changes in the clinical context with a combination of the patient’s clinical history and electrocardiogram.
Keywords
Introduction
The management of patients presenting with symptoms suggestive of acute coronary syndrome (ACS) to any emergency department is a significant challenge, due to the wide differential diagnosis and the associated broad spectrum of risk from benign to life-threatening. Recommendations state that a rise and/or fall of cardiac troponin (cTn) with at least one cTn concentration above the 99th percentile limit of a normal reference population, in the context of a clinical presentation consistent with ACS is essential for the diagnosis of acute myocardial infarction (AMI).1,2
Implementation of high-sensitivity cTn assays at the 99th percentile has vastly improved the sensitivity and negative predictive value (NPV) for the early detection of AMI compared with previous generations of assays.3,4 However, this lowering of the 99th percentile value has resulted in lowered specificity and positive predictive values (PPV), with more patients negative for ACS detected with a cTn above the 99th percentile. This has been shown to increase invasive management without substantial benefit in patient prognosis. 5 The increased analytical sensitivity of the cTn assay and improved precision at the 99th percentile concentration has raised the issue of use of delta change to detect acute changes in cTn at an earlier time. Knowing what constitutes a significant delta change from baseline is still unclear, and the literature is varied, resulting in a lack of consistency for use of delta cTn in the diagnosis of AMI. There are still no clear guidelines for assessing changing cTn concentrations in patients presenting with symptoms suggestive of ACS. Different techniques for measuring delta change from baseline are used, including relative change (%Δ), absolute change (Δ), reference change value and z-scores3,4,6–16 and delta velocity. 17 An expert consensus group has recommended using %Δ of >20%. 18 However, there is evidence that shows Δ performs better than relative delta changes. 3 Decision limits for optimal %Δ and Δ vary between studies and use different timing intervals for the second sample. 19
The z-score approach, as described by Pretorius et al., converts each individual observed difference into a probability or z-score utilizing analytical and biological variation. 14 A z-score of 1.96 is associated with a confidence interval of 95% for a two-tailed test, and the diagnostic sensitivity and specificity of z-scores at this cut-off were shown to perform equally well across numerous cTn assays. 14 This allows for a consistent cut-off, as opposed to needing to empirically determine assay-specific cut-offs for every cTn assay on the market. This would help to simplify the definition of a significant cTn change; however, much would rely on laboratory information systems or clinical databases for calculation of the score. The z-score has the advantage of taking the analytical imprecision into account over the range 1–100,000 ng/L, which may improve its performance at higher cTn concentrations (i.e. >100 ng/L). This is compared with Δ where the use of a constant cTn concentration (7 ng/L for example) is independent of the patient cTn concentration and may overestimate a clinically significant change at high cTn concentration. By contrast, a fixed %Δ (20% for example) may be less useful at low cTn concentration close to the 99th percentile due to greater assay imprecision and may overestimate a clinically significant change at low cTn concentration.
It is important to note that patients with chronically elevated cTn concentrations but no significant delta most likely have significant cardiac pathology needing further investigation making these false-positive results less acutely clinically significant.
The confusion surrounding how to best utilize high-sensitivity cTn assays along with the number of different delta change algorithms being utilized makes it difficult for clinicians to assess patients presenting with symptoms suggestive of ACS. This could lead to unnecessary treatment of patients who have cTn concentrations above the 99th percentile without significant acute changes. This paper aims to compare these three methods (%Δ, Δ and z-scores) for determining cTn delta changes, including sensitivity, specificity and predictive value for detecting AMI and how they can best be used in a clinical setting.
Materials and methods
This study was approved by the Bellberry Human Research Ethics Committee (HREC) – reference number: 2011–11-525.
Study design and population
This study was undertaken from December 2011 until November 2013 and approached all patients presenting to a private metropolitan chest pain emergency department with symptoms suggestive of ACS, unless they met any of the following exclusion criteria on arrival; ST elevation myocardial infarction, age less than 18 years, women who were pregnant or lactating or patients who were unable to provide consent (e.g. dementia, non-English speaking). In addition to the exclusion criteria above, patients who refused consent, from whom it was difficult to obtain multiple blood samples and who were discharged or transferred before being able to obtain a second blood sample were not included in the study.
Signed informed consent was obtained from all participants who agreed to take part. Patient characteristics were collected from current and previous medical notes.
Blood specimens were collected from each patient at admission (0 h), 2, 3, 4 and 6 h postadmission unless discharged earlier than 6 h or unable to collect the specimen due to blood collection issues or patient withdrawal.
Analytical testing
Whole blood specimens were collected into Lithium Heparin tubes for laboratory testing. A time frame of ±15 min was allowed at each time point for blood collection. After centrifugation, samples were frozen at –20°C. Thawed and re-centrifuged samples were analysed in batches of patient sample sets on the Roche Elecsys high-sensitivity troponin T (hs-TnT) assay (Roche Diagnostics, Mannheim, Germany). The mean time to testing was 10 days (range: 0–46 days), which is within the manufacturers’ guidelines of 12 months stability at –20°C. An independent study has also shown that samples are stable for at least three months at these conditions for this hs-TnT assay. 20 According to the manufacturer, the 99th percentile cut-off for a healthy reference population is 14 ng/L, the limit of blank is 3 ng/L, with a limit of detection of 5 ng/L and a limit of quantitation of 13 ng/L. The assay has intermediate precision (CV) of 15.0% at 7.5 ng/L, 5.2% at 13.5 ng/L, 3.1% at 24.0 ng/L and 1.3% at 300 ng/L. Koerbin et al. 21 performed precision analysis of the assay, the 10% CV corresponded to a concentration of 11.9 ng/L and the 20% CV was at 6.8 ng/L. From a cardio-healthy population, 44/104 had an hs-TnT concentration above the limit of detection and 77/104 had a concentration above the limit of blank. 21 It should be noted that this assay performance does not achieve the accepted benchmark for classification as high sensitive (>50% of results above the limit of detection). 22
Other analytes shown in the supplementary data were obtained from the patient’s routine laboratory testing. NT-proBNP was also analysed on the presentation sample for each patient (Roche Diagnostics, Mannheim, Germany).
Clinical assessment and final diagnosis
All patients underwent a standard clinical assessment which included clinical history, physical assessment, 12 lead electrocardiogram (ECG), serial measurements of hs-TnT and laboratory blood tests. It should be noted that the patient’s care and serial laboratory hs-TnT testing were at the discretion of the treating doctor, according to hospital protocols.
All patients had a final diagnosis determined by an independent cardiologist according to the universal definition of AMI. The cardiologist reviewed all available medical records and pathology results which were part of the patient’s routine care, while being blinded to the study cTn results. At the time of the study, the hospital laboratory did not report quantitative hs-TnT results less than 29 ng/L.
Data analysis
Statistical analyses were performed with MedCalc version 12.7.0.0 (MedCalc Software, Ostend, Belgium) and STATA 13 (StataCorp, Texas, United States). Patient characteristics were compared between those with an AMI diagnosis and those without using two-tailed statistical significance testing as a 5% significance level (P < 0.05). The equations for calculating each of the delta change methods in this paper are
With Result1 being the baseline measurement at admission.
A constant biological variation (SDbiological) of 2.5 ng/L was assumed for hs-TnT. 13 Analytical variation was taken from the mean of the measured patient results according to the precision profile of the assay. The precision profile of the assay was calculated using laboratory precision data at multiple concentrations across the measuring range.
PPVs, NPVs, diagnostic sensitivity and diagnostic specificity were assessed at each change cut-off %Δ (10%, 20% and 50%), Δ (5 ng/L, 7 ng/L and 10 ng/L) and z-score (1.96). This analysis was performed at all time points, compared with the baseline hs-TnT concentration taken upon admission. At least one result must have been above the 99th percentile limit of a normal reference population (14 ng/L) to be classified as a positive result. Data presented in this paper will concentrate on the %Δ and Δ changes of 20% and 7 ng/L, respectively, as they had the best performance overall. z-score was categorized as positive if greater than 1.96.
To compare the diagnostic performance of each delta change for detecting AMI, receiver operating characteristic (ROC) curves were constructed, and the area under the curve was compared between time points.
Results
The baseline characteristics of all 806 patients are shown in the supplementary data. A positive diagnosis for AMI was found in 39 (4.8%) patients. AMI patients were significantly older, had increased NT-proBNP and glucose concentrations and increased average length of stay (P < 0.01) compared with non-AMI patients.
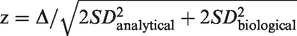
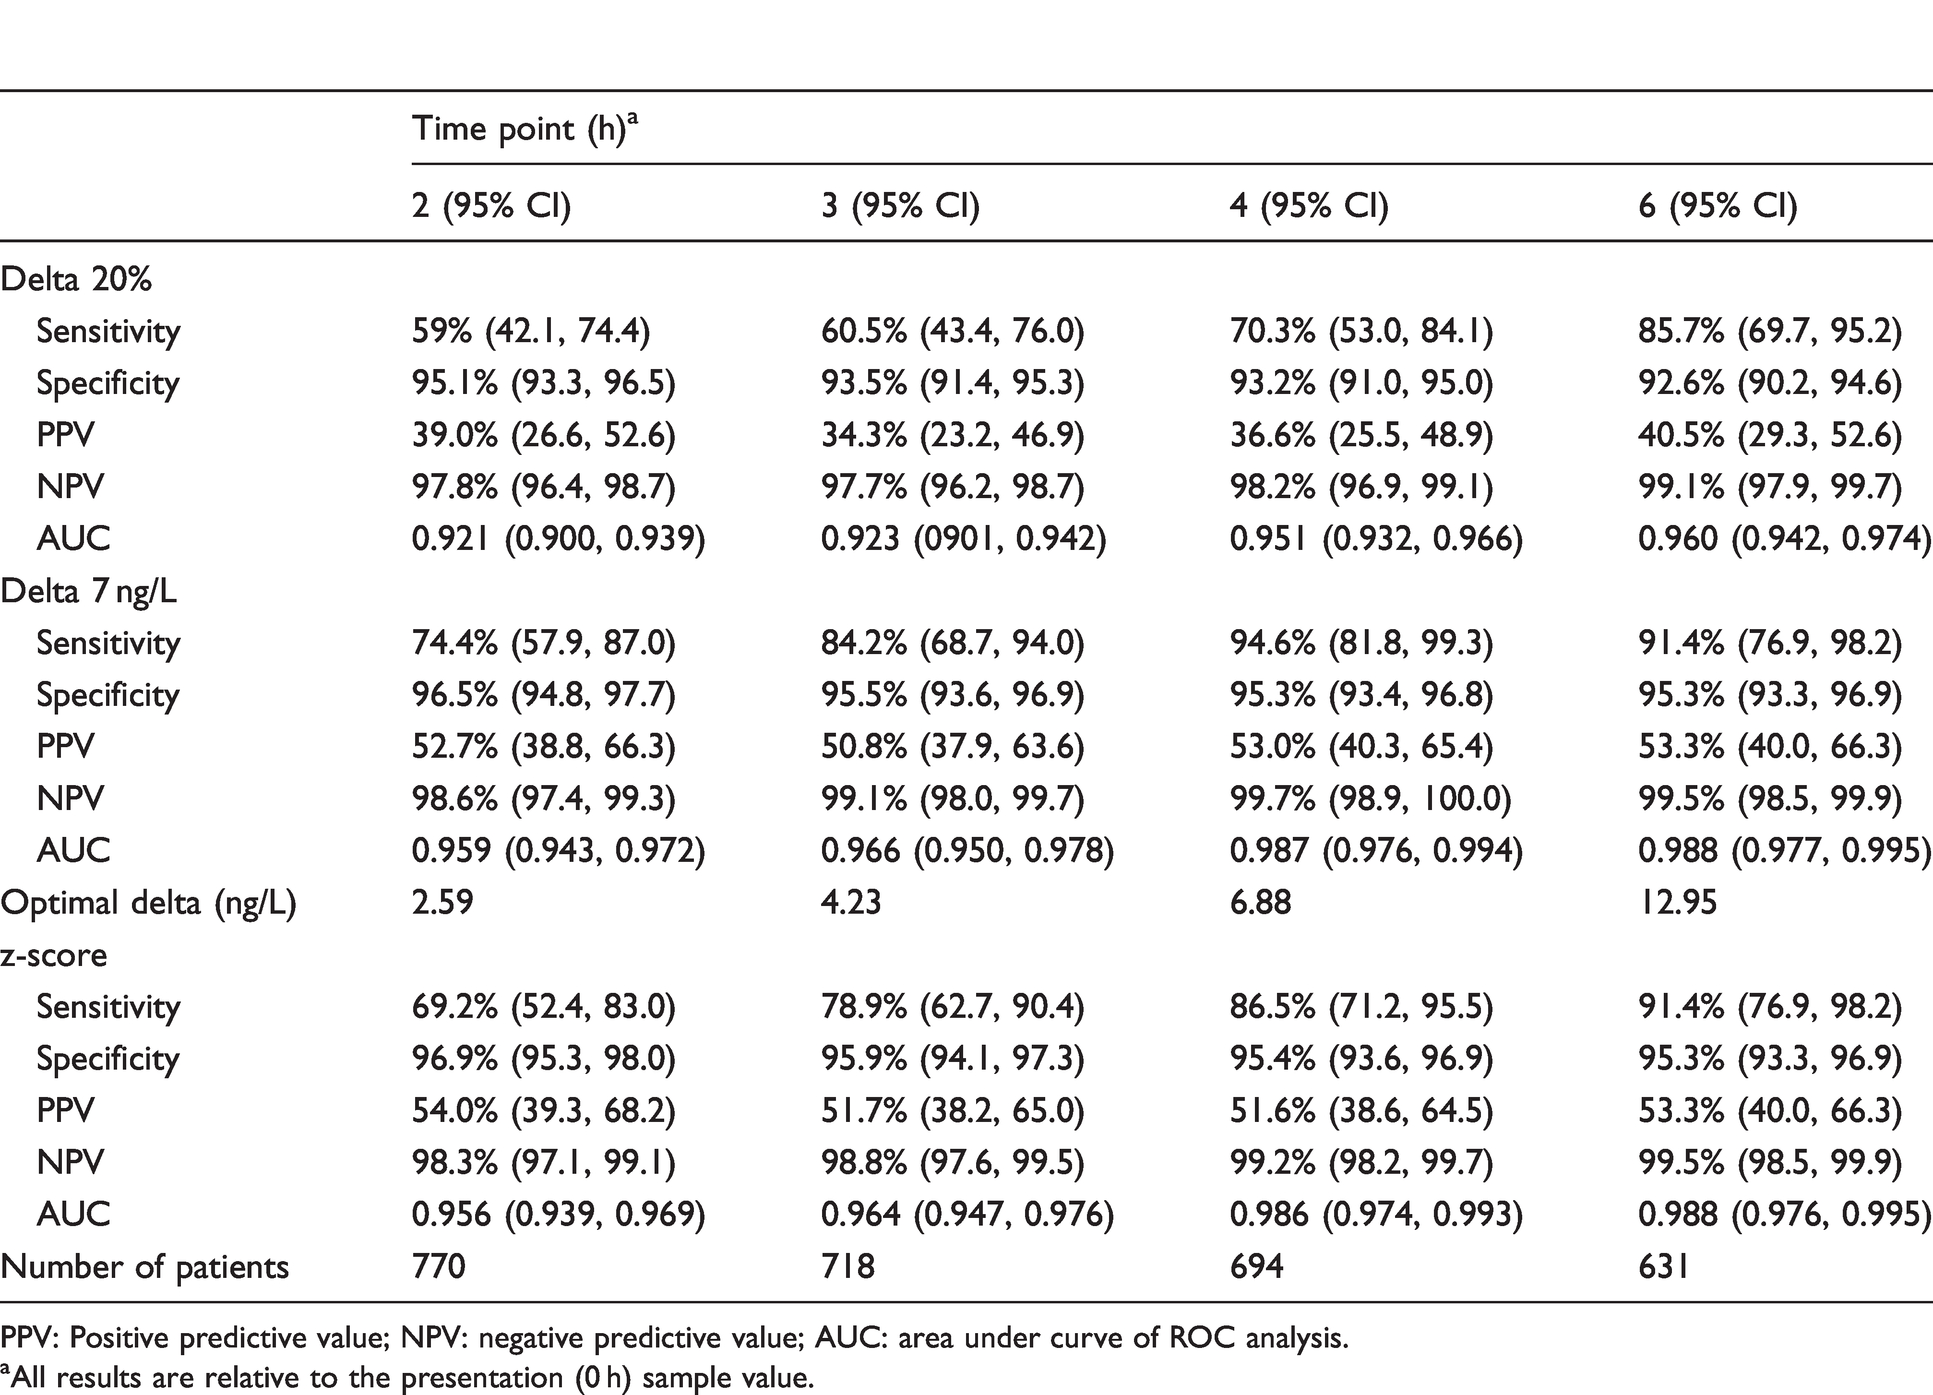
Comparisons of the ROC AUC showed better performance for the Δ and z-score compared with %Δ at all time points in the diagnosis of AMI (AUC: 0.921–0.960 for %Δ compared with 0.959–0.988 for Δ and 0.956–0.988 for z-score). However, it should be noted that there is overlap of the 95% confident intervals (CIs) for the different methods, indicating no statistically significant difference in performance. Optimal timing for the Δ analysis was at 4 h which resulted in sensitivity, specificity, PPV, NPV and ROC AUC of 94.6%, 95.3%, 53.0%, 99.7% and 0.987, respectively. z-Score was optimal at 6 h with sensitivity, specificity, PPV, NPV and ROC AUC of 91.4%, 95.3%, 53.3%, 99.5% and 0.988, respectively (Table 1). The ROC analysis at 4 h for each of the different methods is shown in Figure 1.
Sensitivity, specificity, positive predictive value, negative predictive value and ROC area under the curve for cTn measurments at all time points for detecting AMI.
PPV: Positive predictive value; NPV: negative predictive value; AUC: area under curve of ROC analysis.
aAll results are relative to the presentation (0 h) sample value.
ROC analysis of %Δ, Δ and z-scores at 4 h for detecting AMI.
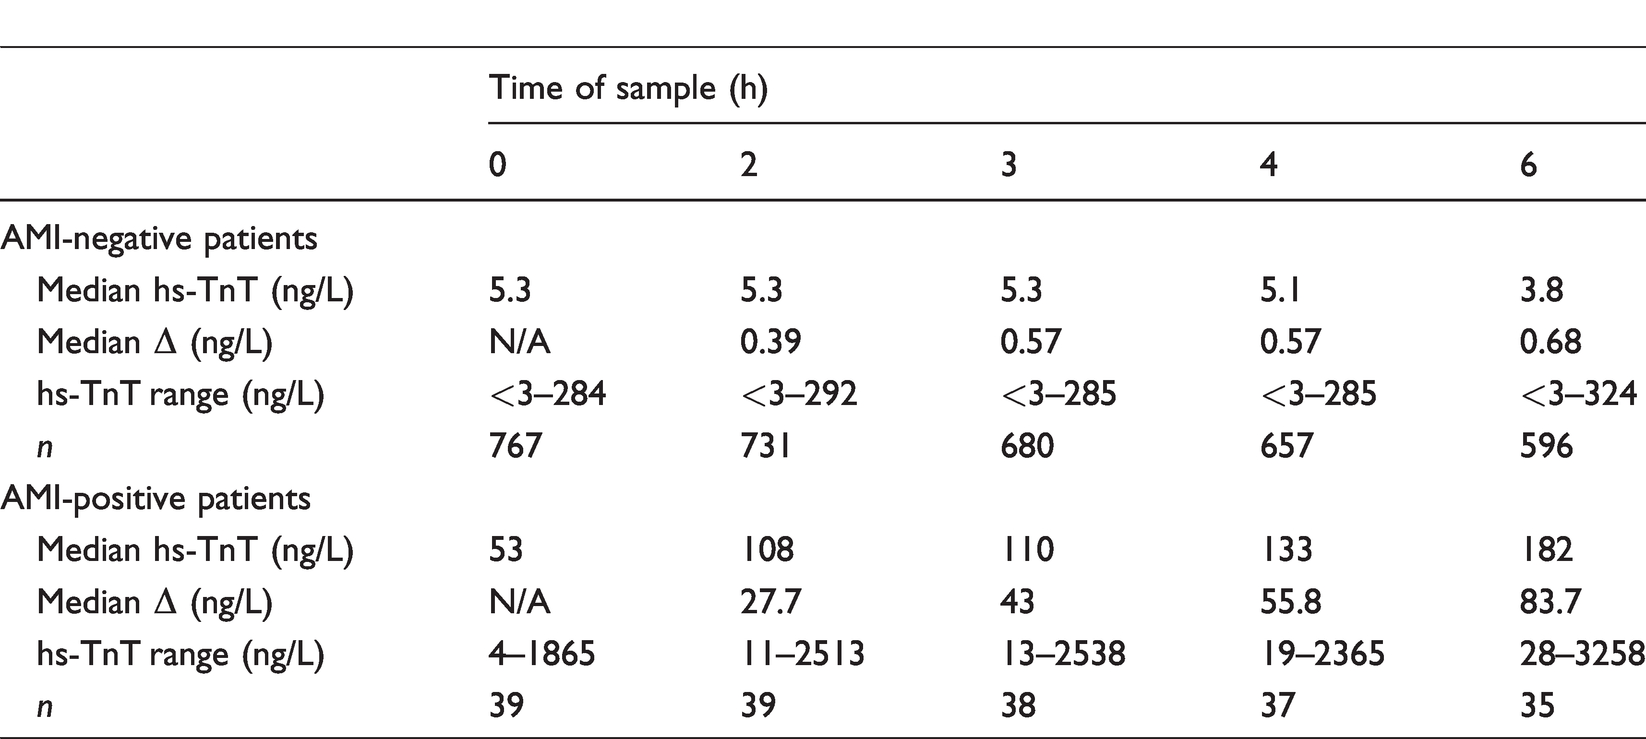
The Δ change for AMI patients increased as the timing of the second sample extended (Table 2). This correlates with the data shown in Table 1 for the optimal Δ at each time point which demonstrated an increased optimal Δ at later time points (i.e. 7 ng/L at 4 h vs. 13 ng/L at 6 h). These higher Δ’s at the later time points increased the specificity and PPV for detection of AMI. The Δ change between hs-TnT concentrations at presentation compared with the second sample was significantly higher at all time points for AMI patients compared with non-AMI patients (P = 0.002).
Median absolute delta change hs-TnT concentrations in patient categorized by AMI diagnosis.
Examples of the hs-TnT release kinetics over 6 h postpresentation to the emergency department are shown for five AMI-positive patients and five AMI-negative patients (Table 3). In Case 4, the admission hs-TnT was above the 99th percentile, neither absolute delta nor z-score reached significance at any time point. In Case 5 of a late presentation of AMI, Δ and z-score demonstrated varying accuracy for diagnosing AMI at different time points. The raised hs-TnT concentration at presentation (248 ng/L) remained around this concentration (within the precision of the assay) out to 6 h. In non-AMI cases 6, 7, 8 and 10, Δ and z-scores were generally elevated at all time points. Case 9 had hs-TnT values that were close to the decision limit at all time points.
Examples of absolute delta change and z-scoresa calculated in patients with and without AMI diagnosis at four time points over 6 h postpresentation.
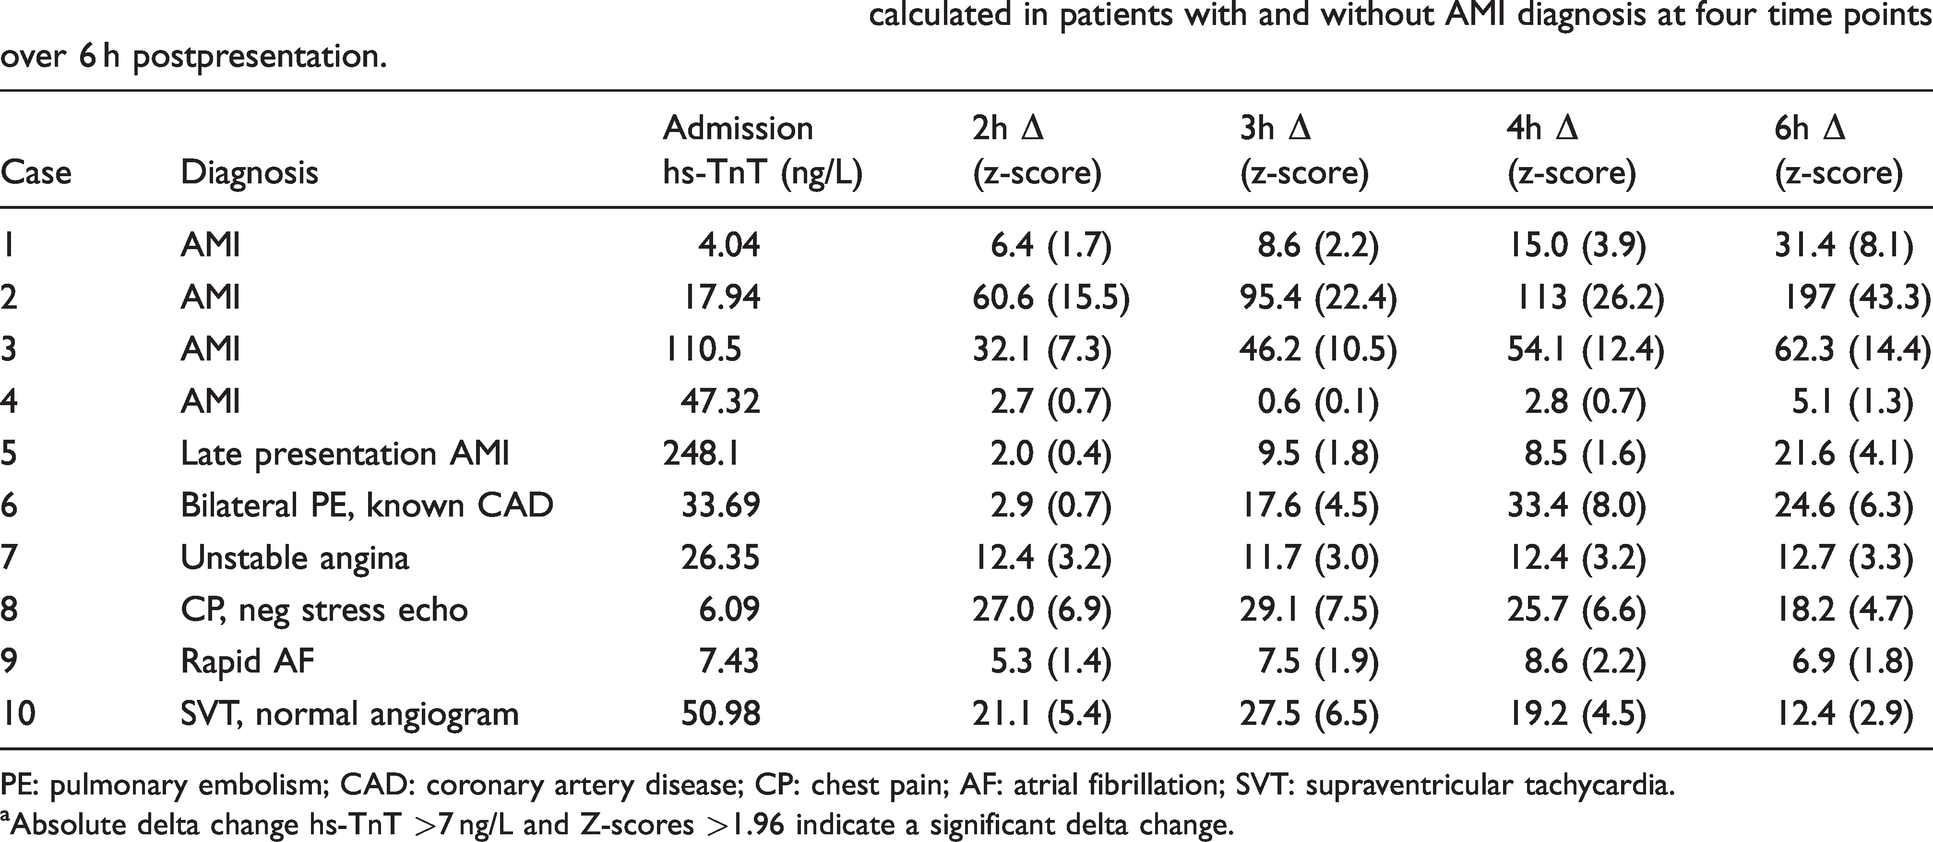
PE: pulmonary embolism; CAD: coronary artery disease; CP: chest pain; AF: atrial fibrillation; SVT: supraventricular tachycardia.
aAbsolute delta change hs-TnT >7 ng/L and Z-scores >1.96 indicate a significant delta change.
Discussion
In this study, the performances of %Δ, Δ and z-scores on patients presenting to a chest pain emergency department with serial samples were directly compared. Although not statistically significant, the results show a clear trend of Δ performing better than %Δ for the diagnosis of AMI in patients presenting with symptoms suggestive of ACS. This is consistent with a number of other studies which directly compared at different time points.3,12,14,23 The better performance of Δ could be explained by improving analytical sensitivity and performance of cTn assays which are able to more precisely measure smaller changes in blood concentrations. The high NPV for Δ and z-scores is vital in a clinical setting to ensure that positive AMI patients are not missed. It is possible that the performance of the different delta change methods will vary based on the initial cTn concentration. Due to the limited number of AMI-positive patients in this study, we were unable to evaluate this and further research is warranted.
Due to the design of our study, we were able to compare different Δ and %Δ at four time points following admission (2, 3, 4 and 6 h). The ROC optimal-derived absolute delta change correlates well with the use of 7 ng/L at 4 h for the second sample. With the increasing use of early rule out protocols (1/2 h), further research into comparing the different delta methods at earlier timings may be required.
The results of this study also confirm the finding by Pretorius et al. that z-scores are comparable to Δ for the hs-TnT assay. 14 Importantly, the Pretorius et al. study also showed that there was no significant difference in the performance of z-scores for the hs-TnT assay when compared with two hs-TnI assays (Beckman Coulter and Abbott). This could allow z-scores, with a single cut-off value at all cTn concentrations across multiple high-sensitivity assays, to be used in the clinical setting with similar performance, which would mean that optimal delta change algorithms would not need to be calculated for every cTn assay.
Another important finding is the dependence of the ROC-derived optimal absolute delta change on time postadmission of the second sample, with longer timings requiring a larger change in hs-TnT concentrations for the diagnosis of AMI. Table 2 shows that Δ increased for both AMI-negative and -positive patient groups as the time of the second sample increased. This increase was much more pronounced in the AMI-positive patient group. This finding may be important for the determination of protocols in a hospital or clinic setting, although more analysis of the performance (sensitivity, specificity, PPV and NPV) is needed.
The cases in Table 3 demonstrate that the release profile of cTn in patients presenting to the emergency department with symptoms suggestive of ACS is not uniform and that there is no ‘one size fits all’ algorithm for cTn in the diagnosis of AMI. This indicates that delta change algorithms will miss some positive AMI patients. A similar situation is seen in AMI-negative patients with a rise and/or fall in hs-TnT concentrations which are not attributable to an AMI. The vast majority of patients who had positive delta hs-TnT results in this study had some existing cardiac disease or condition which can affect cTn. The importance of the clinical context used with ECG, clinical history and cTn cannot be overemphasized.
Case 5 was a good example of a patient presenting late following an AMI. The hs-TnT was elevated but relatively stable which resulted in the Δ and z-scores not being positive at all time points meaning that if these algorithms were used in a clinical setting, clinical history and ECGs (along with the highly elevated hs-TnT) would be relied upon for identifying further investigation and diagnosis. Case 6 was a non-AMI patient having an hs-TnT profile which increased acutely like a typical AMI. This was caused by a bilateral pulmonary embolism in a patient with known coronary artery disease and is an example of a non-AMI cause of positive cTn results.
It is important to remember that cTn is a biomarker of myocardial injury, not AMI. Thus, it is of great importance to interpret cTn results in conjunction with the patient’s clinical picture.
Limitations of this study
There was a low rate of AMI-positive patients in this study population compared with an expected rate such as that observed in the snapshot ACS Australia study (4.8% vs. 25.5%, respectively, when STEMI’s were excluded). 24 The reason for the lowered AMI rate in this study is unknown, although possible causes could include the fact that patients presenting to the private chest pain emergency department as per this study are at lower risk than those presenting to a tertiary teaching hospital. This study also did not recruit consecutive patients, as only those presenting Monday–Friday, 7:00–18:00 were enrolled. This lower proportion of AMI-positive patients may influence the NPV of this study; however, the study was undertaken in a ‘real-life’ emergency department, and the results are still representative of a clinical environment. A number of patients enrolled in this study did not have samples collected at all time points due to withdrawal from the study, being discharged or blood collection issues.
The hs-TnT assay was affected by a calibration change to the assay during the study. The 99th percentile did not change, and as this study is looking at changes in concentration of hs-TnT, it is not believed that this would have affected the outcome of the study as paired samples were performed using the same calibration data.
As discussed in the method, the hospital laboratory did not report quantitative hs-TnT results less than 29 ng/L which limited the information available to the clinicians and placed more reliance on clinical judgement for diagnosis of AMI as an endpoint. This may have resulted in patients with hs-TnT results below this (but above the 99th percentile) being less likely to have a final diagnosis of AMI. As %Δ is potentially more sensitive at these lower concentrations, this may have had an impact on the conclusions of this study.
It would also be beneficial for all patients to have an angiogram to help with final diagnosis; however, this was not feasible in this study population.
In conclusion, given the good precision of the hs-TnT assay reported at concentrations below 30 ng/L (CV range at 14.2 ng/L: 2.9%–10.7% for a multisite study of 8 labs and 11 analysers and including up to 3 reagent lots and 4 calibrations 25 ) and the importance of using an absolute delta or z-score at low concentrations to detect acute cTn changes, hs-TnT values should be reported down to the limit of detection of the assay to enable calculation of a delta cTn. In addition, one may be disadvantaging patients with small but clinically significant changes consistent with ACS that would be detected earlier using delta parameters (Case 1 for example). On the other hand, one cannot overemphasize the importance of interpreting cTn changes in the clinical context with a combination of the patient’s clinical history and ECG.
Supplemental Material
ACB876671 Supplemental Material - Supplemental material for A comparison of cardiac troponin T delta change methods and the importance of the clinical context in the assessment of acute coronary syndrome
Supplemental material, ACB876671 Supplemental Material for A comparison of cardiac troponin T delta change methods and the importance of the clinical context in the assessment of acute coronary syndrome by Paul Simpson, Rosy Tirimacco, Penelope Cowley, May Siew, Narelle Berry, Jill Tate and Philip Tideman in Annals of Clinical Biochemistry
Footnotes
Acknowledgments
We would like to thank all the nursing staff at the Flinders Private Hospital who helped recruit patients into the study and for collecting bloods throughout.
Declaration of conflicting interests
The author(s) declared the following potential conflicts of interest with respect to the research, authorship, and/or publication of this article: Roche Diagnostics have sponsored education for iCCnet CHSA and iCCnet CHSA staff members.
Funding
The author(s) disclosed receipt of the following financial support for the research, authorship, and/or publication of this article: Roche Diagnostics provided funding for this study.
Ethical approval
This study was approved by the Bellberry Human Research Ethics Committee (HREC) – reference number: 2011–11-525.
Guarantor
RT.
Contributorship
RT and PT researched the literature and conceived the study. PS, RT, PC and MS developed the study protocol, gained ethical approval, recruited patients and tested the blood samples. PS, RT and NB undertook data analysis. PS wrote the first draft of the article. JT researched the literature for development of the article draft. All authors reviewed and edited the article and approved the final version of the article.
Supplemental material
Supplemental material for this article is available online.
References
Supplementary Material
Please find the following supplemental material available below.
For Open Access articles published under a Creative Commons License, all supplemental material carries the same license as the article it is associated with.
For non-Open Access articles published, all supplemental material carries a non-exclusive license, and permission requests for re-use of supplemental material or any part of supplemental material shall be sent directly to the copyright owner as specified in the copyright notice associated with the article.