
Abstract
Introduction
The prevalence of vitamin B12 deficiency is high in at-risk populations with sometimes irreversible consequences. Beside total B12 (TVB12), active B12 (AVB12) is a promising first-line marker. Only Abbott AVB12 assays were largely evaluated and generally demonstrated benefit in clinical practice. More recently developed Roche AVB12 still requires some investigations.
Objectives
Our study aimed to evaluate the Roche Elecsys® AVB12 immunoassay performance versus Roche Elecsys® TVB12 competition assay.
Design
and Methods: We included 175 patients at Rouen University Hospital who had a TVB12 value <300 pmol/L. We evaluated performance of AVB12 by comparing the results with TVB12 and MMA values in case of disagreement.
Results
Positive correlation was found between the AVB12 and TVB12. We found a disagreement between TVB12 and AVB12 in 18.8% of cases. Among 33 cases of disagreement, 76% had normal AVB12 but low TVB12, whereas 24% had low AVB12 and normal TVB12. Thirty-one MMA determinations were performed: 71% showed agreement between MMA and AVB12, versus 29% between MMA and TVB12. TVB12 reported a sensitivity (Se) at 66.7%, specificity (Sp) at 20%, positive predictive value (PPV) at 16.7% and negative predictive value (NPV) at 71.4% for the prediction of MMA elevation. We determined an optimized cut-off value of 45.5 pmol/L for AVB12, which reported a Se 66.7%, Sp 60%, PPV 30.7%, and NPV 88.9%.
Conclusions
Our results provide preliminary evidence that Roche AVB12 may offer better discrimination than Roche TVB12 in the diagnosis of vitamin B12 deficiency. Further more detailed evaluation is warranted.
Keywords
Introduction
The prevalence of vitamin B12 (VitB12) or cobalamin deficiency is estimated at 1–2% of the general population and more than 10% in people over 65 years. It is frequent in at-risk populations such as the elderly, patients with low dietary intakes of animal proteins, pregnant women, children and patients who have undergone digestive surgery. 1 However, prevalence varies according to the diagnostic criteria used: clinical or subclinical deficiency, threshold values of biomarkers, population of interest. The consequences of VitB12 deficiency can be serious with symptoms that are often unspecific or unknown. 2 Various plasma biomarkers are available to assess vitamin B12 deficiency, with varying levels of diagnostic performance: total B12 (TVB12), holotranscobalamin or active B12 (AVB12), methylmalonic acid (MMA) and homocysteine (Hcy).1–3 TVB12 represents the total circulating concentration of VitB12, that is, the sum of haptocorrin-B12 and transcobalamin-B12 complexes, the last form being a minor part but the only one to enter the body cells. TVB12 is an accessible and inexpensive automated assay. It is the most used test and corresponds to the assay performed in first-line. However, TVB12 lacks of sensitivity and specificity for VitB12 deficiency due to variations in the synthesis of the transport protein haptocorrin.4,5 Moreover, various physiological situations, like age or ethnicity,6,7 and few analytical interferences, like anti-intrinsic factor antibody or IgG-VitB12 complex, have to be taken into consideration in the interpretation of the results. 8 At last, there is no definitive consensus on reference values of TVB12 despite standardization effort, making it more difficult to interpret the results. 9 VitB12 is involved as a coenzyme in two pathways of cellular metabolism. MMA and Hcy are functional metabolic markers of these pathways. They increase when there is a cellular deficiency of VitB12. MMA and Hcy are considered as indirect markers of VitB12 deficiency and are mostly used as second intention markers. However, Hcy determination suffers from many preanalytical biases and biological interferences. Hcy level depends on age, gender, alcohol, caffeine and tobacco use. In addition, there are false positive results in case of vitamin deficiencies (B6 or folate), renal insufficiency or deficiency of enzymes involved in Hcy metabolism. MMA is less problematic preanalytically and is not influenced by folate and B6 status. For many specialists, MMA represents the best reference standard to diagnose B12 deficiency. However, the cost of MMA is high, and its availability limited in routine laboratories. MMA and Hcy are not systematically used to detect VitB12 deficiency, 10 and direct markers remain in first line. Transcobalamin-cobalamin complex also called active vitamin B12 (AVB12) or holotranscobalamin corresponds to the bioavailable fraction. Beside ELISA and RIA methods for AVB12 determination, automated immunoassays became available after 2008 on Abbott instruments Axsym and Architect. AVB12 generally demonstrated better performances in the diagnosis of vitamin B12 deficiency than TVB12.4,11–13 Until now, only few manufacturers were offering AVB12, limiting its availability. Recently a new AVB12 assay was presented by Roche manufacturer: Roche Elecsys® Active B12 immunoassay. In 2019, Heil et al. evaluated the analytical performance of this assay and compared it to Abbott active B12, showing a significative positive bias of 9 pmol/L between both assays. Authors concluded that there was a need to establish a novel cut-off value for Roche AVB12 by calculating sensitivity and specificity against MMA concentrations before an application as first-line screening test in the diagnosis of vitamin B12 deficiency. 14
The aim of our study was to evaluate for the first time, Roche Elecsys® Active B12 and Roche Elecsys® total B12 performances in patients with deficient or low total vitamin B12. In addition, we compared the B12 results to MMA results in case of disagreement to evaluate respectively diagnostic performances and to determine a first AVB12 cut-off value adapted to B12 deficiency screening.
Material and methods
Patients
This prospective study was conducted from November 2018 to March 2019. Samples of hospitalized patients who had medical requisition for TVB12, folate, blood count and creatinine analyses were selected. We included 175 patients on following criteria: aged 16 years of age or more, creatinine level <104 μmol/L for men <84 μmol/L for woman, folate >8.8 nmol/L and TVB12 concentration below 300 pmol/L. This value is the cut-off for a low probability of VitB12 deficiency. 15 Pregnant women, subjects with impaired renal function and subjects on B12 supplementation were excluded from the study.
The study was performed in accordance with the Declaration of Helsinki on biomedical research involving human subjects. The institutional review board (Rouen University Hospital) approved the study (authorization protocol number: E2023-14).
Blood collection
Samples were obtained in the course of routine analysis. Haemoglobin and MCV were measured on samples collected on dipotassium EDTA tubes (BD Vacutainer EDTA, Plymouth). TVB12, folate, creatinine were performed on fresh plasma samples from lithium heparin tubes (BD Vacutainer LH, Plymouth). Selected heparinized plasma were frozen at −20°C the day of analysis or, at the latest, the following day. The concentrations of AVB12 and MMA were determined on frozen samples within one and 6 months respectively.
Assays
Blood counts were performed on Sysmex XN-9000® automated analyser (Sysmex Corporation, Kobe, Japan).
Plasma creatinine was performed on cobas 8000 e701 analyser with CREP2 enzymatic assay (Roche Diagnostics, Mannheim, Germany). Folate was determined by ECLIA on cobas 8000 e602 analyser with Folate III assay (Roche Diagnostics, Mannheim, Germany).
TVB12 concentrations were measured by electro-chimiluminescence (ECLIA) on cobas 8000 e602 analyser with Vitamin B12 II assay (Roche Diagnostics, Mannheim, Germany). The reference range was 145–569 pmol/L (2.5–97.5 percentile). AVB12 concentrations were measured by ECLIA on cobas 8000 e602 analyser with Elecsys Active B12 assay (Roche Diagnostics, Mannheim, Germany). AVB12 reference range was 37.5–188.0 pmol/L (2.5–97.5 percentile) as determined by Heil et al. 14
Analytical performances of the new AVB12 assay were evaluated on our analyser. For intra-assay variability, we measured 15 times in a row the low and high internal controls (Preci Control Varia, Roche). For inter-assay variability, we measured twice a day over a period of 15 days, the same internal controls. Intra-assay coefficient of variation (CV) for AVB12 was 3.61% and 3.78% for low and high level controls, respectively. Inter-assay CV was 2.83 and 3.39%. Manufacturer’s recommendations indicate CV intra-assay<4% and inter-assay<6% for each level. Our results confirmed correct analytical performances in our laboratory.
In case of disagreement between AVB12 and TVB12, MMA was measured in plasma by liquid chromatography technique coupled with tandem mass spectrometry, with reference value <0.5 μmol/L. 16
Statistical analyses
Data are presented as medians ± interquartile range [IQR]. Statistical analyses were carried out using MedCalc software version 13.0 and GraphPad Prism for Windows, version 8.0.2 (GraphPad Software, San Diego, California, United States). Relationship between several variables was done by Chi-Square, McNemar test. Pearson’s correlation was used to determine the correlation between two variables. Receiver Operating Characteristic (ROC) curves were constructed to calculate the area under the curve (AUC) for significant MMA results. Statistical significance was determined at p < 0.05.
Results
General characteristics of the study population
Characteristics of study population. Data are expressed as median [IQR], except for gender (%), n is the total number of patients. TVB12: total vitamin b12, AVB12: active vitamin B12, RBCs: red blood cells, Hb: haemoglobin, MCV: mean corpuscular volume.
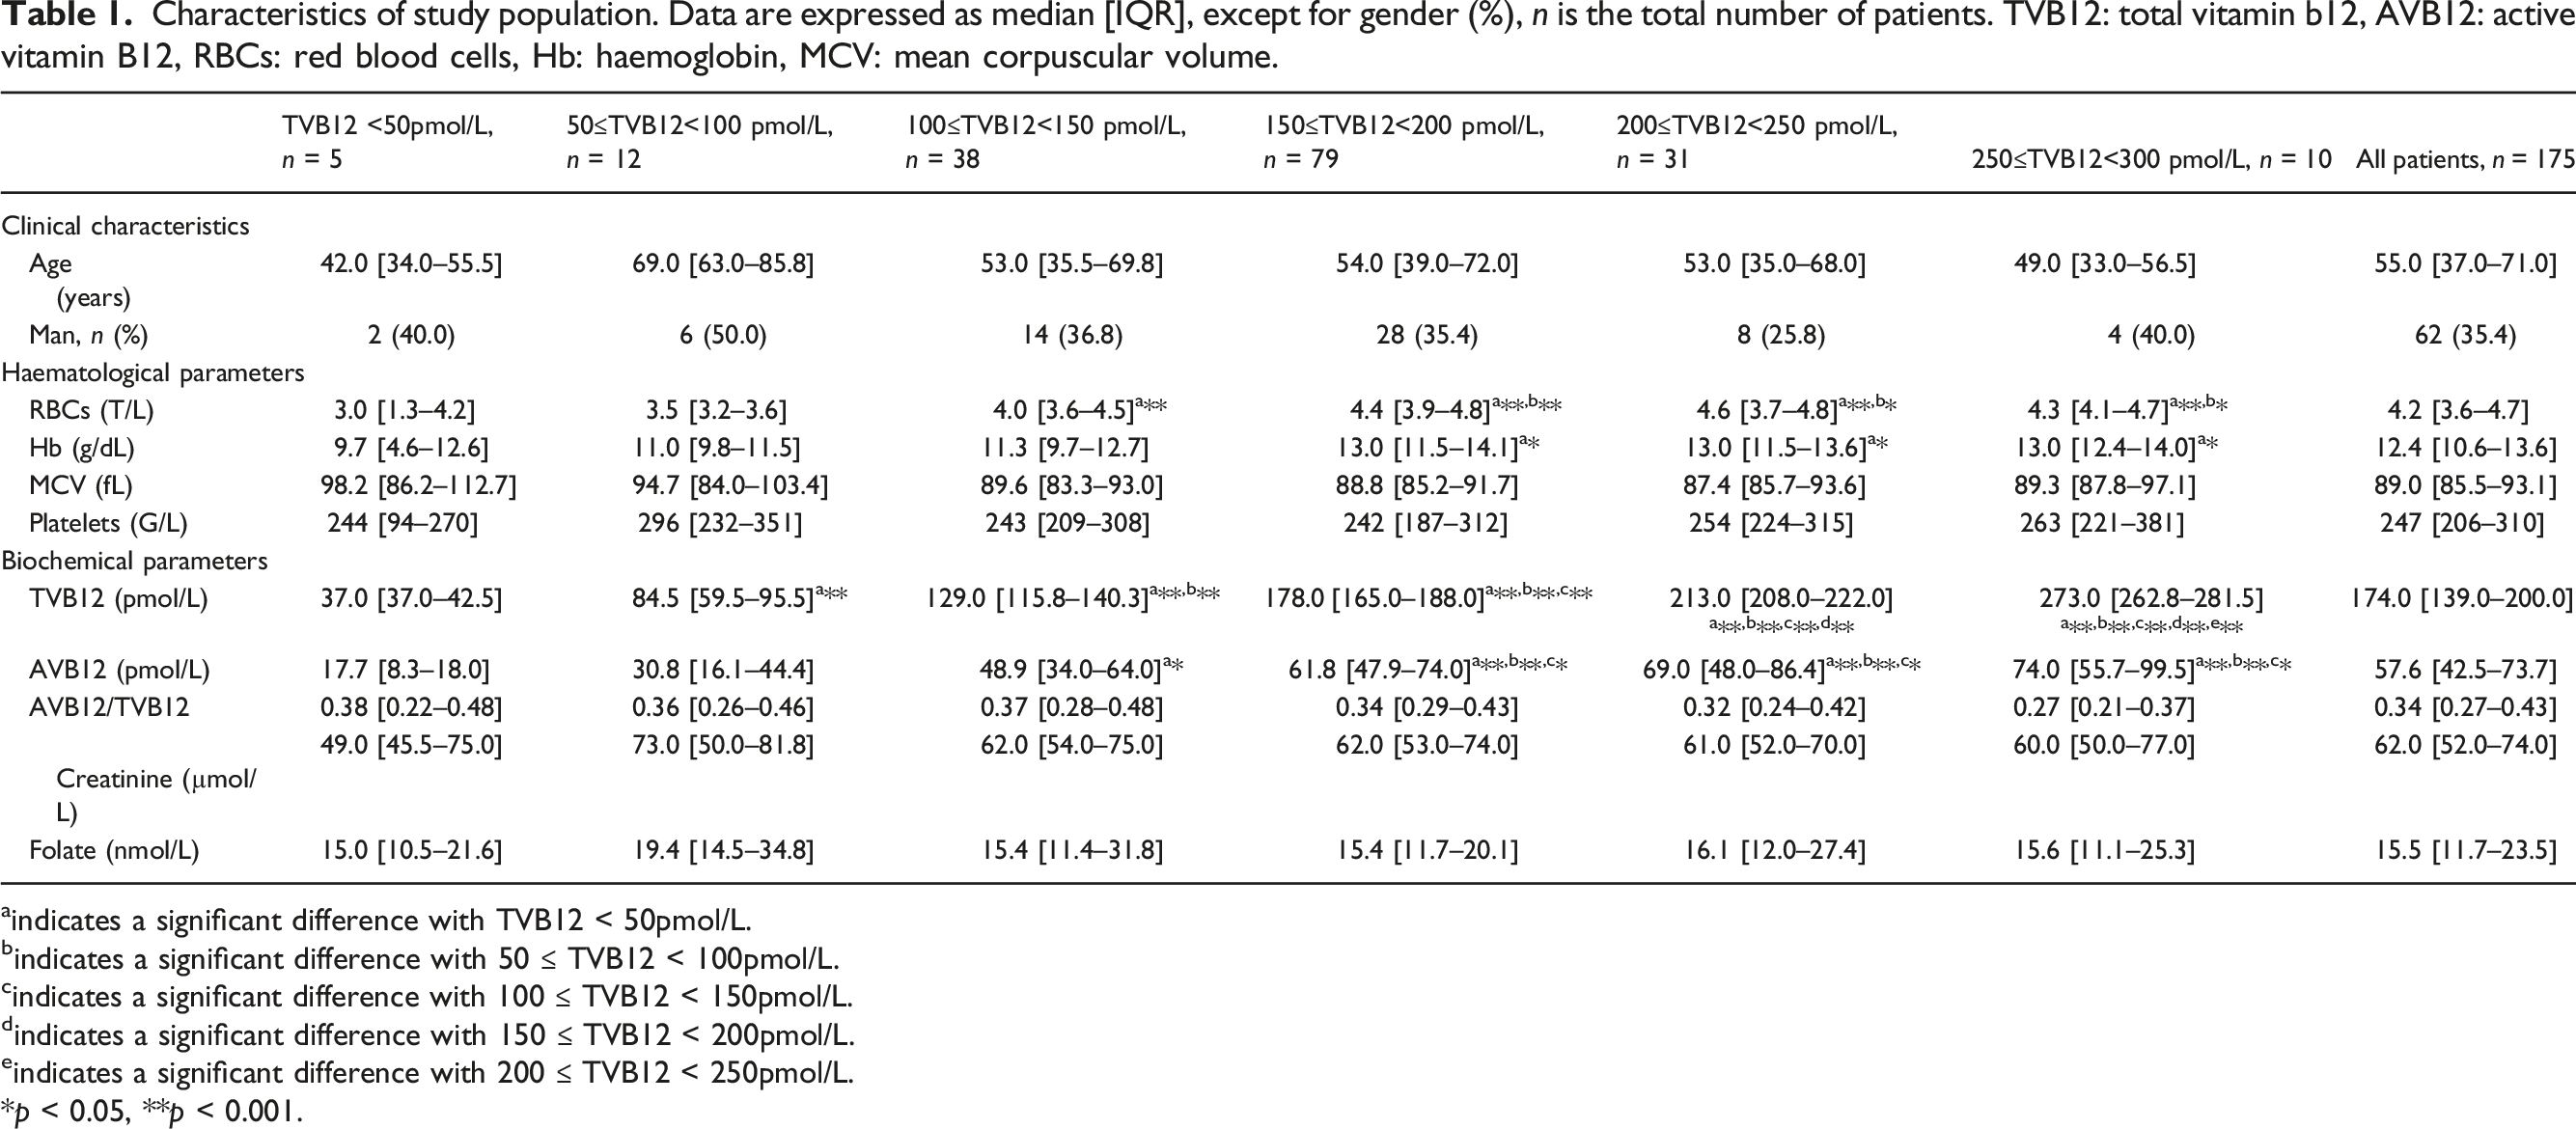
aindicates a significant difference with TVB12 < 50pmol/L.
bindicates a significant difference with 50 ≤ TVB12 < 100pmol/L.
cindicates a significant difference with 100 ≤ TVB12 < 150pmol/L.
dindicates a significant difference with 150 ≤ TVB12 < 200pmol/L.
eindicates a significant difference with 200 ≤ TVB12 < 250pmol/L.
*p < 0.05, **p < 0.001.
Correlation studies
Correlation between vitamin B12 and haematological parameters.
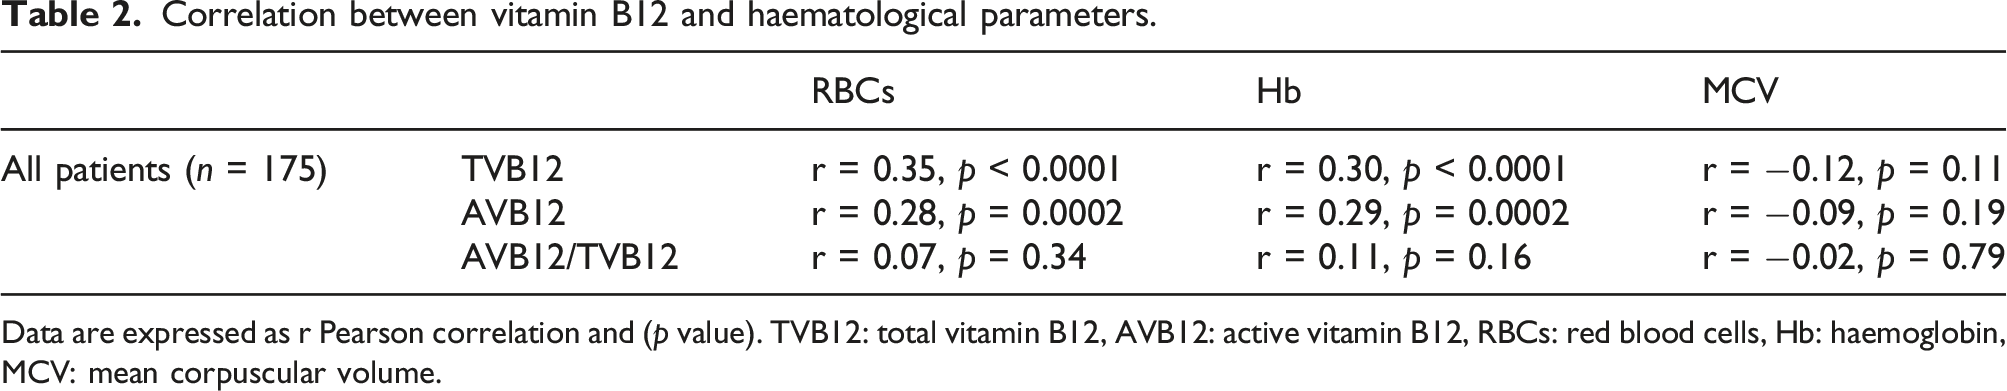
Data are expressed as r Pearson correlation and (p value). TVB12: total vitamin B12, AVB12: active vitamin B12, RBCs: red blood cells, Hb: haemoglobin, MCV: mean corpuscular volume.
Active vitamin B12 assay performances compared to total vitamin B12 and methylmalonic acid
Among patients, 26.8% (47/175) had low TVB12 (<145 pmol/L) compared to 17.1% (30/175) with low AVB12 (<37.5 pmol/L). In 18.8% of cases (33/175 patients), there was disagreement between results: 76% (25/33) had normal AVB12 but low TVB12, whereas 24% (8/33) had low AVB12 and normal TVB12 (Figure 1). There were no differences between agreement and disagreement regarding age, sex, haemoglobin and MCV. Histogram of active vitamin B12 (AVB12) status according to total vitamin B12 value in 175 patients with total vitamin B12 (TVB12) <300 pmol/L. The dotted line represents the percentage of disagreement (deficient/non-deficient) between the two methods according to the range of values of TVB12.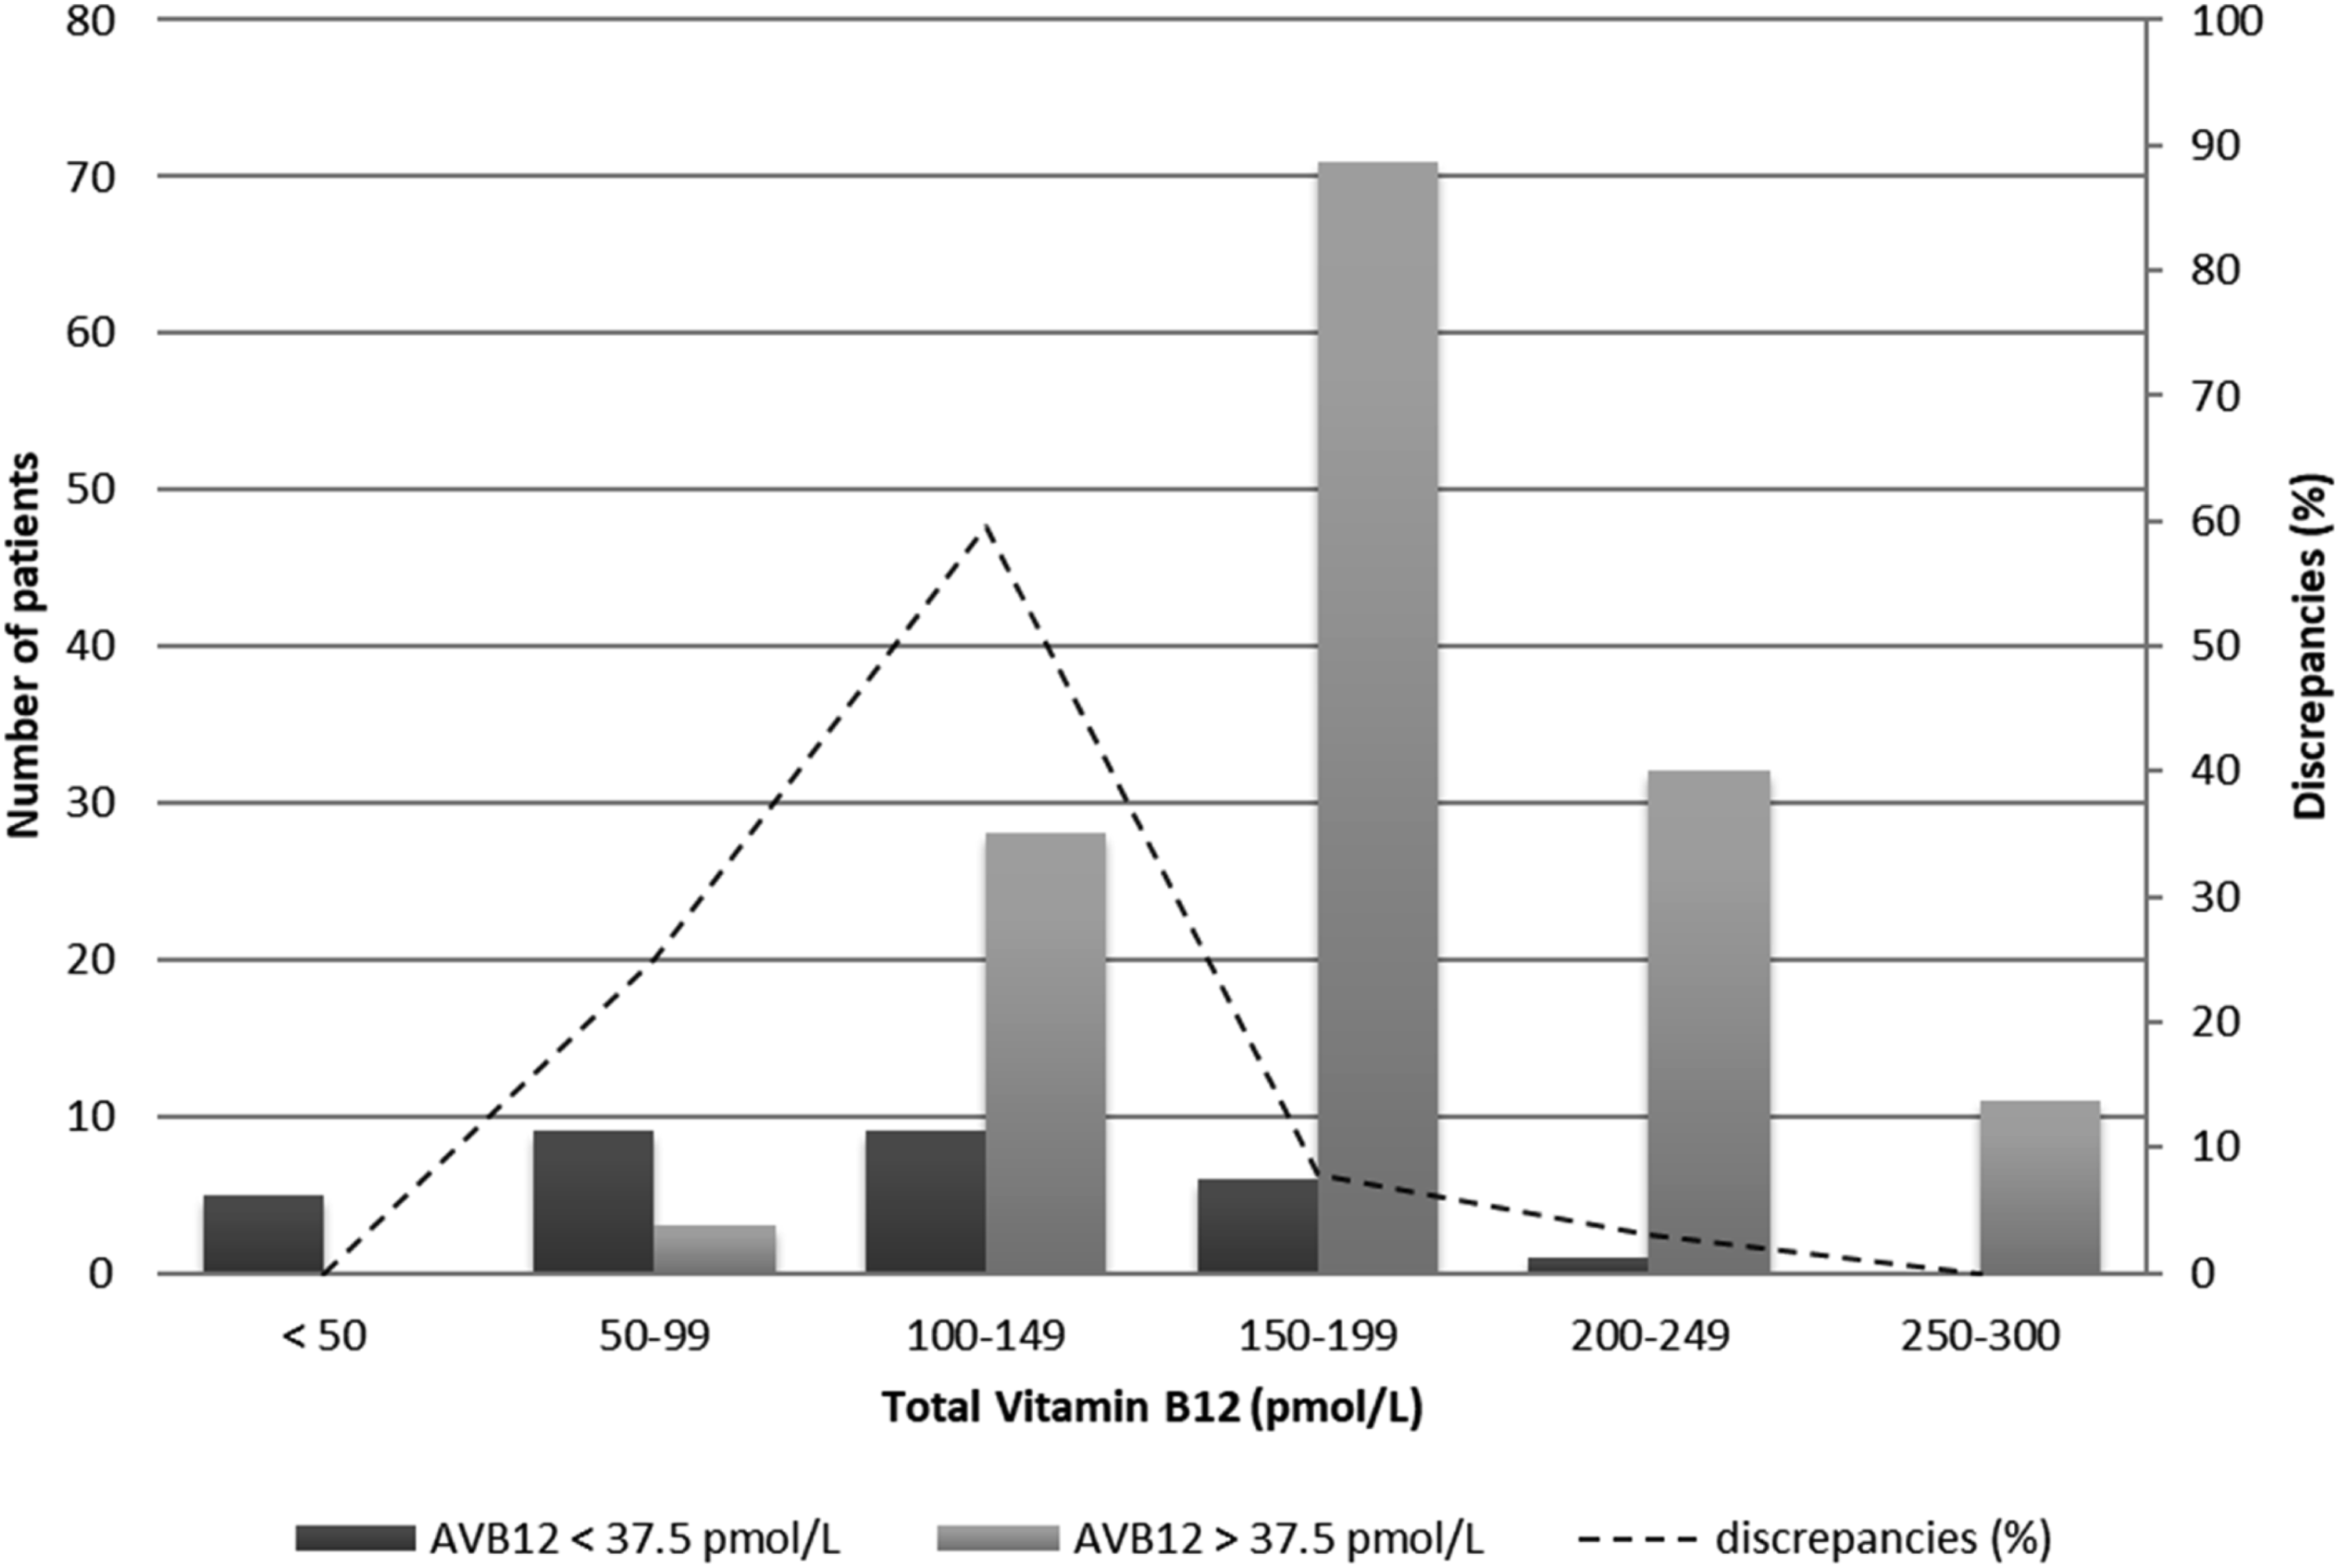
■■■.
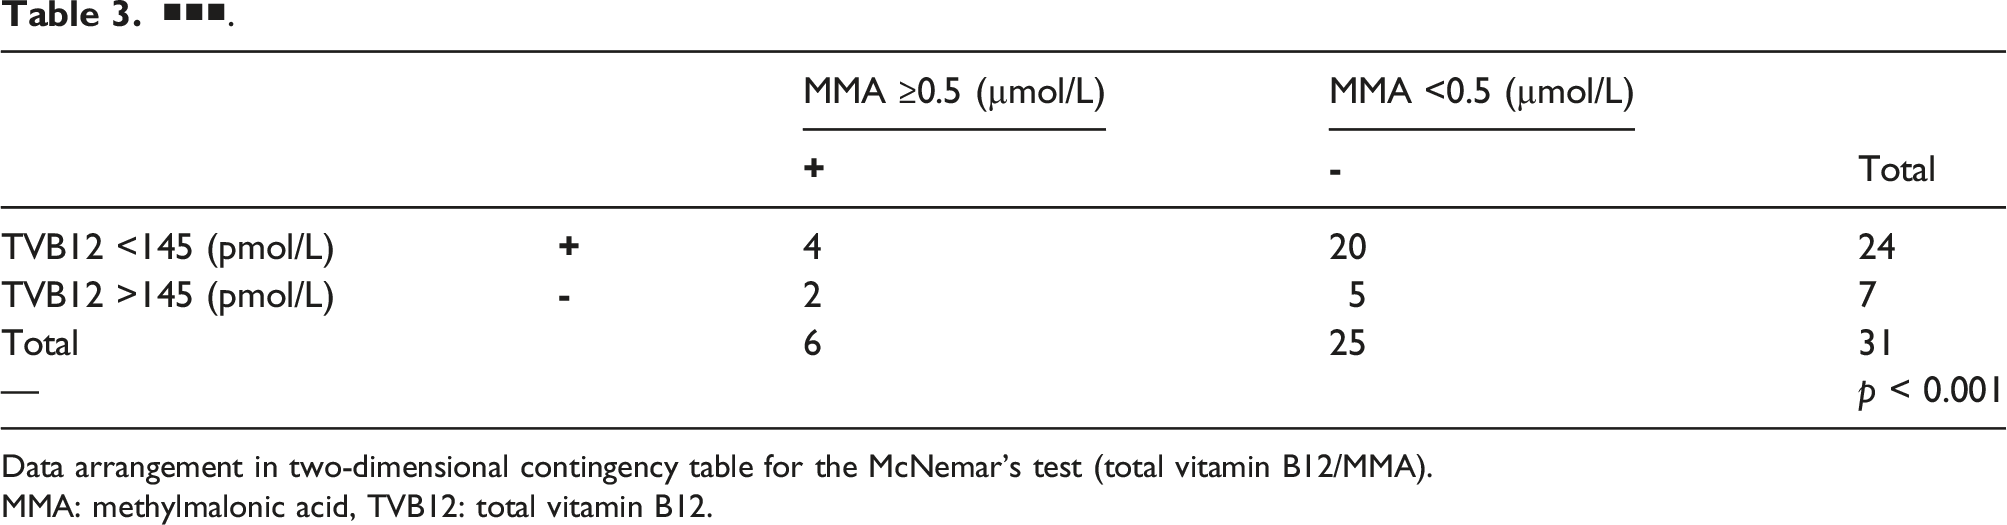
Data arrangement in two-dimensional contingency table for the McNemar’s test (total vitamin B12/MMA).
MMA: methylmalonic acid, TVB12: total vitamin B12.
■■■.
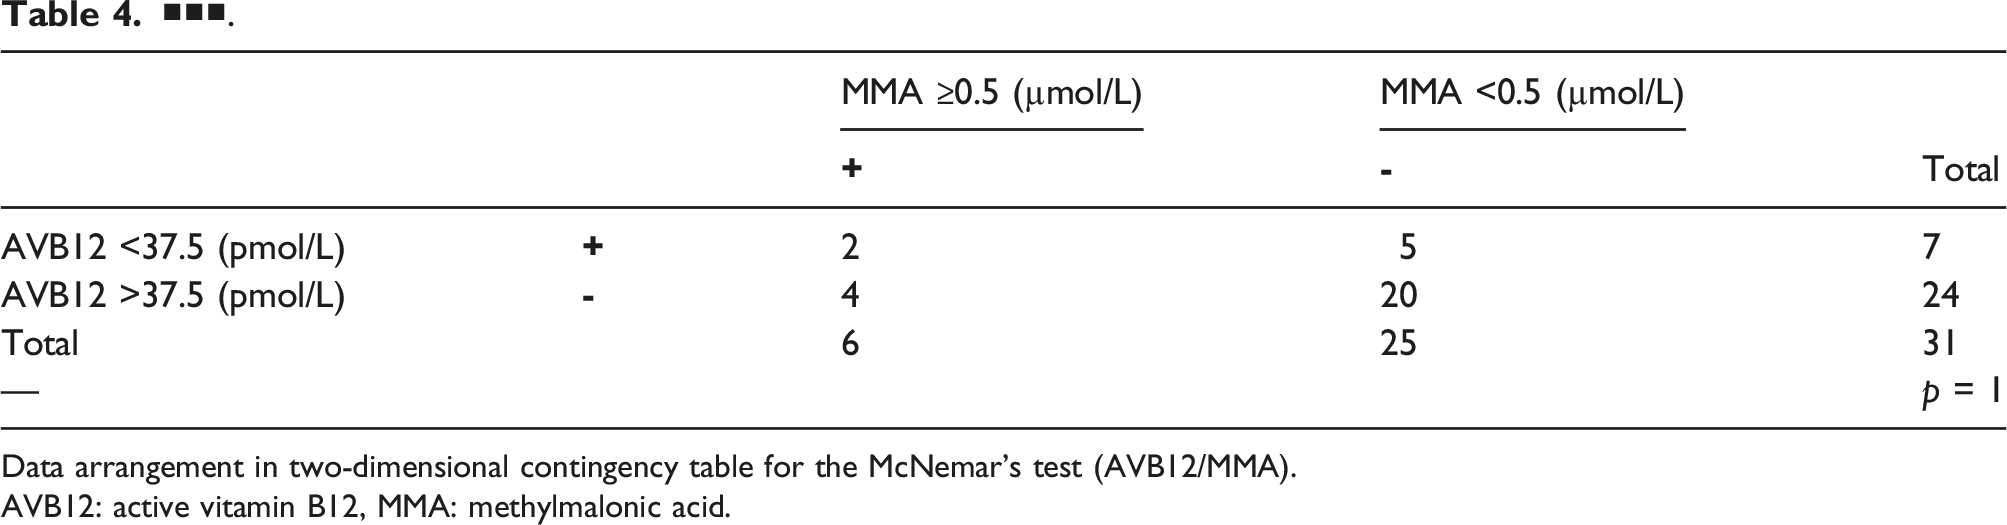
Data arrangement in two-dimensional contingency table for the McNemar’s test (AVB12/MMA).
AVB12: active vitamin B12, MMA: methylmalonic acid.
Based on the contingency table analyses, we calculated sensitivity (Se), specificity (Sp), positive predictive value (PPV) and negative predictive value (NPV) which were 66.7% (Se), 20% (Sp), 16.67% (PPV) and 71.43% (NPV) for TVB12 at the 145 pmol/L threshold and 33% (Se), 80% (Sp), 28.57% (PPV) and 83.33% (NPV) for AVB12 at the 37.5 pmol/L threshold.
Estimating that the low sensitivity of AVB12 at the threshold value of 37.5 pmol/L was not appropriate for the purpose, we determined an optimized threshold value of 45.5 pmol/L for AVB12 (AUC: 0.68), based on 31 MMA determination and ROC decision plot (Figure 2). The optimal cut-off value of 45.5 pmol/L reported Se = 66.7%, Sp = 60.0%, PPV = 28.6% and NPV = 88.2%, that is, comparable sensitivity and higher specificity than TVB12. Receiver operating characteristic (ROC) curve of AVB12 status by MMA. AVB12 > 45.5 pmol/L: AUC: 0.68, sensitivity: 66.7%, specificity: 60.0%, positive predictive value: 30.7% and negative predictive value: 88.9%.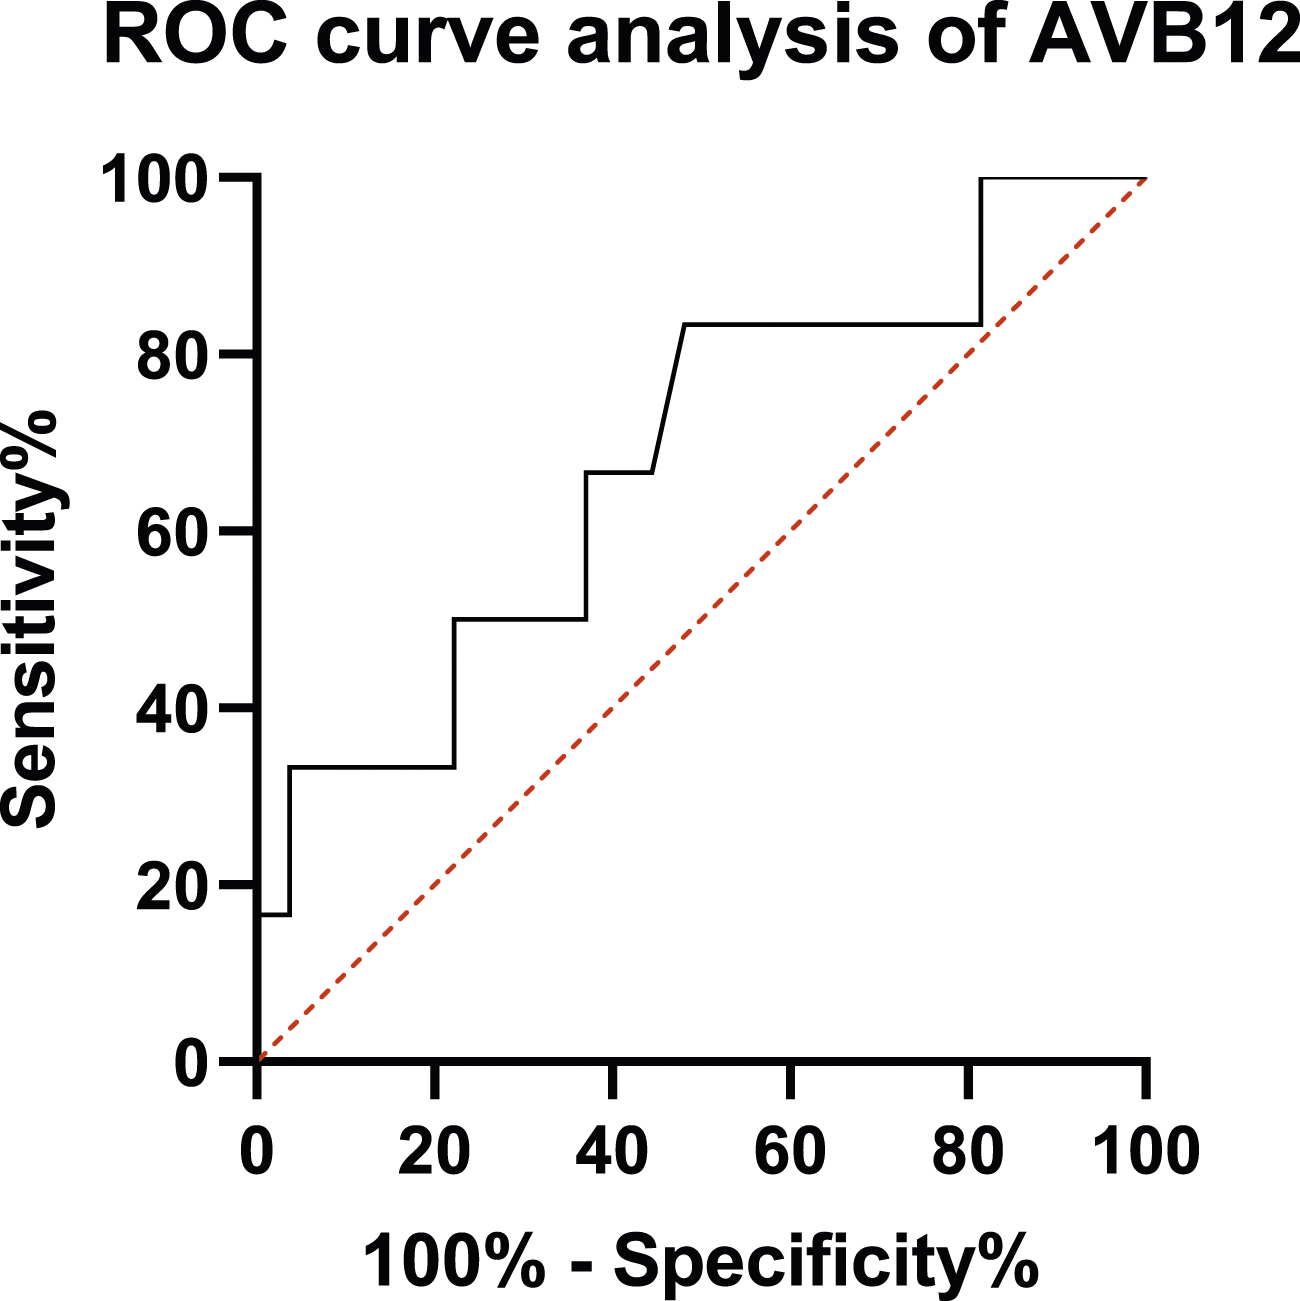
Discussion
In this study, we have shown a moderate positive correlation between Roche TVB12 and Roche AVB12 biomarkers. This result (r = 0.53, p < 0.001) seems consistent with previous studies (r = 0.42–0.882) conducted with various kits and reviewed by Golding et al. 17 The wide variation in correlation coefficients between studies is explained by the use of different assays and the inclusion of heterogeneous populations.
In this work, we found a higher percentage of low TVB12 than of low AVB12. These biomarkers showed some disagreement between results (33/175). The MMA assay showed a performance gain in favour of active vitamin B12 compared to total vitamin B12, an observation that is consistent with previous findings with Axis-Shield and Abbott kits for AVB12. We observed 20 false positives and two false negatives between TVB12 and MMA against five false positives and four false negatives between active B12 and MMA highlighting a clear gain in specificity (TVB12 Sp = 20% vs ABV12 Sp = 80%) associated with a decrease in sensitivity (TVB12 Se = 66.7% vs AVB12 Se = 33%). However, these evaluations are based on the reference values provided by the manufacturer.
Recently, Solé-Enrech et al, based on Clinical and Laboratory Standards Institute methodology (CLSI-EP28 guideline), calculated new reference values for Roche Elecsys TVB12: 111–513 pmol/L. 18 Referring to this reference interval, diagnosis performance of TVB12 was modified with better specificity (Sp = 84%) and lower sensitivity (Se = 33%), illustrating that reference range is difficult to determine and is not a robust basis for prediction of VitB12 deficiency. It may preferably be replaced by a cut-off. There is no definitive international consensus about clinical decision thresholds (and exploration strategies) to be applied to B12 evaluation for either total or active B12. Reference values defined for healthy populations are often considered insufficiently effective in the literature and the addition of a grey zone is often proposed but rarely applied in routine laboratory practice.3,19–21
Carmel et al. highlighted the absence of a gold standard for the diagnosis of vitamin B12 deficiency and insisted on cut-off variations that lead to significant changes in diagnostic conclusions (diagnostic uncertainties). 22 As suggested by Heil et al, we tried to define a first cut-off of Roche AVB12 based on the determination of MMA.
Based on ROC analysis for interdependency between AVB12 and MMA, we calculated an AVB12 cut-off at 45.5 pmol/L. This new cut-off showed a better sensitivity (Se = 66.7%) with a lower specificity (Sp = 60%) compared to the first threshold evaluated, that is, 37.5 pmol/L. Furthermore, AVB12 at 45.5 pmol/L demonstrated a clear gain of specificity (i.e. 3-fold better) without loss of sensitivity compared to the TVB12.
With previously available Abbott AVB12, a consensual cut-off value of 35 pmol/L was frequently used. Recently, a comparison between Roche AVB12 and Abbott AVB12 reported a small positive bias of 9 pmol/L14. The newly calculated threshold of 45.5 pmol/L is therefore in agreement with previous findings and we believe that it can be used for Roche AVB12 while waiting for larger studies.
In our study, one patient presented AVB12/TVB12 ratio >1 with normal AVB12 at 60.9 pmol/L and low TVB12 at 57 pmol/L. Vitamin B12 deficiency was excluded with MMA <0.5 μmol/L. However, in front of this low TVB12 value, the patient was investigated with multiple complementary explorations like anti-intrinsic factor antibodies titration, oeso-gastro-duodenal endoscopy and coloscopy to exclude Biermer anaemia or inflammatory bowel disease. All were negative. For this patient, we strongly suspect haptocorrin deficiency, which is indistinguishable from a true vitamin B12 deficiency when using TVB12. A prospective study on 565 patients with low cobalamin reported that 0.6% is associated with haptocorrin severe deficiency and 15% with haptocorrin mild deficiency. 23 AVB12 first-line testing could limit invasive investigation in these not uncommon situations. Furthermore, AVB12 performs better in pathophysiological situations where haptocorrin is modified. For example, haptocorrin is reduced in pregnancy or increased in myeloproliferative and lymphoproliferative syndromes. 5
However, all biological markers may have pitfalls and AVB12 has shown some weaknesses. Recently, a study reported discrepancies between cobalamin and holotranscobalamin which could be explained by transcobalamin autoantibodies interfering with the holotranscobalamin assay or an increased concentration of holotranscobalamin due to polymorphisms in the transcobalamin II gene. 24 Another case of AVB12 failure in pernicious anaemia was reported, due to presence of heterophilic antibodies. 25
Our study presents some limitations. Assessment of the sensitivity and specificity of the two assay methods was a challenge due to the absence of robust clinical criteria to define vitamin B12 deficiency and due to the small sample size. MMA concentration was chosen as an indirect metabolic marker because Hcy determination suffers from many preanalytical biases and biological interferences. This choice was in agreement with previous suggestions. 14 MMA is considered the best reference standard to determine vitamin B12 deficiency. However, MMA was not measured in all patients because of high costs and workload. Future studies involving the systematic analysis of MMA would be useful to complete our findings. Also, MMA has some limitations, like elevated levels in case of renal failure. For this reason, we excluded patients with a creatinine level above reference range to limit the bias induced by renal failure. To go further, we determined the estimated glomerular filtration rate (eGFR) by CKD-EPI formula for all patients explored with MMA analysis. All patients reported eGFR>60 mL/min/1.732.
To conclude, we report with this work the first comparison between Roche AVB12 and Roche TVB12 in the same group of patients. Using an optimized cut-off of 45.5 pmol/L, Roche AVB12 demonstrated equal sensitivity (66.7%) and much better specificity (60%) than TVB12 in our population. Although more detailed evaluation is warranted, our results provide preliminary evidence that Roche AVB12 may offer better discrimination than Roche TVB12 for the diagnosis of VitB12 deficiency. However, AVB12 has its own pitfalls of interpretation and does not challenge the interest of indirect markers which keep their place as second-line markers, in particular because they reflect the cellular use of B12.
Footnotes
Acknowledgements
Authors would like to thank Nikki Sabourin-Gibbs, CHU Rouen, for her help in editing the manuscript.
Declaration of conflicting interests
The author(s) declared no potential conflicts of interest with respect to the research, authorship, and/or publication of this article.
Funding
The author(s) received no financial support for the research, authorship, and/or publication of this article.
Ethical approval
The study was performed in accordance with the Declaration of Helsinki on biomedical research involving human subjects. The institutional review board (Rouen University Hospital) approved the study (Authorization protocol number: E2023-14).
Guarantor
GF.
Contributorship
JG, GF, HG, VB and MQM performed the analysis and wrote the manuscript. JG included patients. GF, JG, VB and MQM revised the manuscript and results. MQM, JG and VB designed the research. JG, GF and MQM analysed, interpreted the data, and wrote the manuscript. All authors have read and approved the final version of the manuscript.