
Abstract
Background
Running means for total calcium (Ca) results at our laboratory exhibit a stable time-of-day (TOD) periodic pattern. We examined use of TOD-dependent targets for running means in patient-based quality control (PBQC) for Ca.
Methods
Primary data were Ca results over a 3 month interval, restricted to weekday data within the Ca reference interval (8.5–10.3 mg/dL; 2.12–2.57 mmol/L). Running means were evaluated as sliding averages of 20 samples (20-mers).
Results
Data comprised 39,629 consecutive Ca measurements (75.3% inpatient (IP)) for which Ca was 9.29±0.47 mg/dL. The all data average for 20-mers was 9.29 ± 0.18 mg/dL. When parsed in 1 h TOD intervals, however, averages among 20-mers ranged from 9.1 to 9.5 mg/dL, with blocs of contiguous results above (0800–2300 h; 53.3% of results; IP = 75.3%) and below (2300–0800 h; 46.7% of results; IP = 99.9%) the all-data mean. There was thus an inherent TOD-dependent pattern of deviation of means from target when using a fixed PBQC target. Using Fourier series analysis as an example approach, characterization of the pattern to produce TOD-dependent PBQC targets eliminated this inherent inaccuracy.
Conclusions
In circumstances of periodic variation in running means, simple characterization of that variation can reduce the probability of both false positive and false negative flags in PBQC.
Introduction
For many analytes measured in hospital laboratories, the average of results over a given interval is a relatively stable number. For high frequency tests, monitoring of the running average of patient results can provide a means of patient-based quality control (PBQC), whereby systematic error in principle might be detected sooner than the interval associated with routine measurements of non-patient quality control (QC) materials.1,2,3,4,5 A basic approach to PBQC is to compare the running mean or median of n results to a target based on statistics of prior results, and to apply rules for QC interpretation in much the same way as performed for standard QC.6,7
At our institution, average interpatient total calcium (Ca) results within 1-hour blocs exhibit a reproducible time-of-day (TOD) cyclical pattern across 24 h. This circumstance is problematic for PBQC when using a fixed target (e.g. a fixed target of average of running means), as there is an inherent TOD-dependent pattern in deviation of results from a fixed target. Under such conditions, this inherent TOD-dependent error could be mitigated by use of TOD-dependent targets. We examined this premise using retrospective total Ca versus time data, and give an example of mathematical characterization of the TOD-variation in running means to provide TOD-specific QC targets for running means.
Materials and methods
Primary data and analysis
Primary data were total calcium (Ca) results from all-comers (outpatient (OP) and inpatient (IP)) over a 3 month interval (July–September 2021). For our study of PBQC, primary data were pared to weekdays (Monday–Friday, to exclude weekend variation in the daily IP/OP mix) and to results within the Ca reference interval (RI, 8.5–10.3 mg/dL; 2.12–2.57 mmol/L). These data were sorted by progressive date and time. Running means were evaluated for contiguous results of length 20 (20-mers), which were deemed to be a suitable n-mers for purposes of this study (see Results section 3.4, Properties of 20-mers). 20-mers were calculated on a sliding bloc basis of 20 results, rather than for independent blocs of 20 results; specifically, each 20-mer represented the last 20 samples, with rate of arrival of 20-mers equal to the rate of arrival of samples.
Given the periodic nature of running means data, we used Fourier sine series (FSS) analysis of those data as an example approach to their characterization. FSS provided TOD-specific targets for PBQC for comparison to use of a fixed, non-TOD-dependent target. Data manipulation and analyses were conducted by programming in R. For details on generation of FSS, see Appendix: Calculation of the Fourier sine series.
Ethics
Primary data used in this study (Ca results and time-of-day or results from laboratory records) were all de-identified upon collection. This study was classified as ‘Exempt’ by review of the Institutional Review Board of Jefferson University (#2022–1043), pursuant to federal regulations governing exempted protocol declarations. Specifically, patient consent for retrospective collection and use of de-identified data for this study was not required.
Results
Properties of results in the primary dataset
The primary dataset (prior to paring) was comprised of at-large patient results for 67,338 Ca measurements made over a 3-month interval, listed in order according to the date and time of the result. Patient demographics were 47.8% female (age 57 ± 19 y), 52.2% male (age 58 ± 18 y); 83.4% inpatient (IP), 16.6% outpatient (OP). From the overall Ca distribution, 74.6% were within the reference interval (RI, 8.5–10.3 mg/dL) (Figure 1). IP and OP distributions were distinct, with 70.8% of IP results within RI, compared to 96.5% of results within RI for OP. For IP, Ca results outside of RI were dominated by results below the RI (26.2% of total) compared to results above the RI (3.0% of total). [Ca] distributions for primary (unrestricted) dataset (n = 67,338). Medians: IP (83.4%) = 8.9 mg/dL; OP (16.6%) = 9.6 mg/dL; combined IP and OP (total) = 9.1 mg/dL. Vertical lines delineate boundaries of the Ca reference interval (8.5–10.3 mg/dL) (2.12–2.57 mmol/L).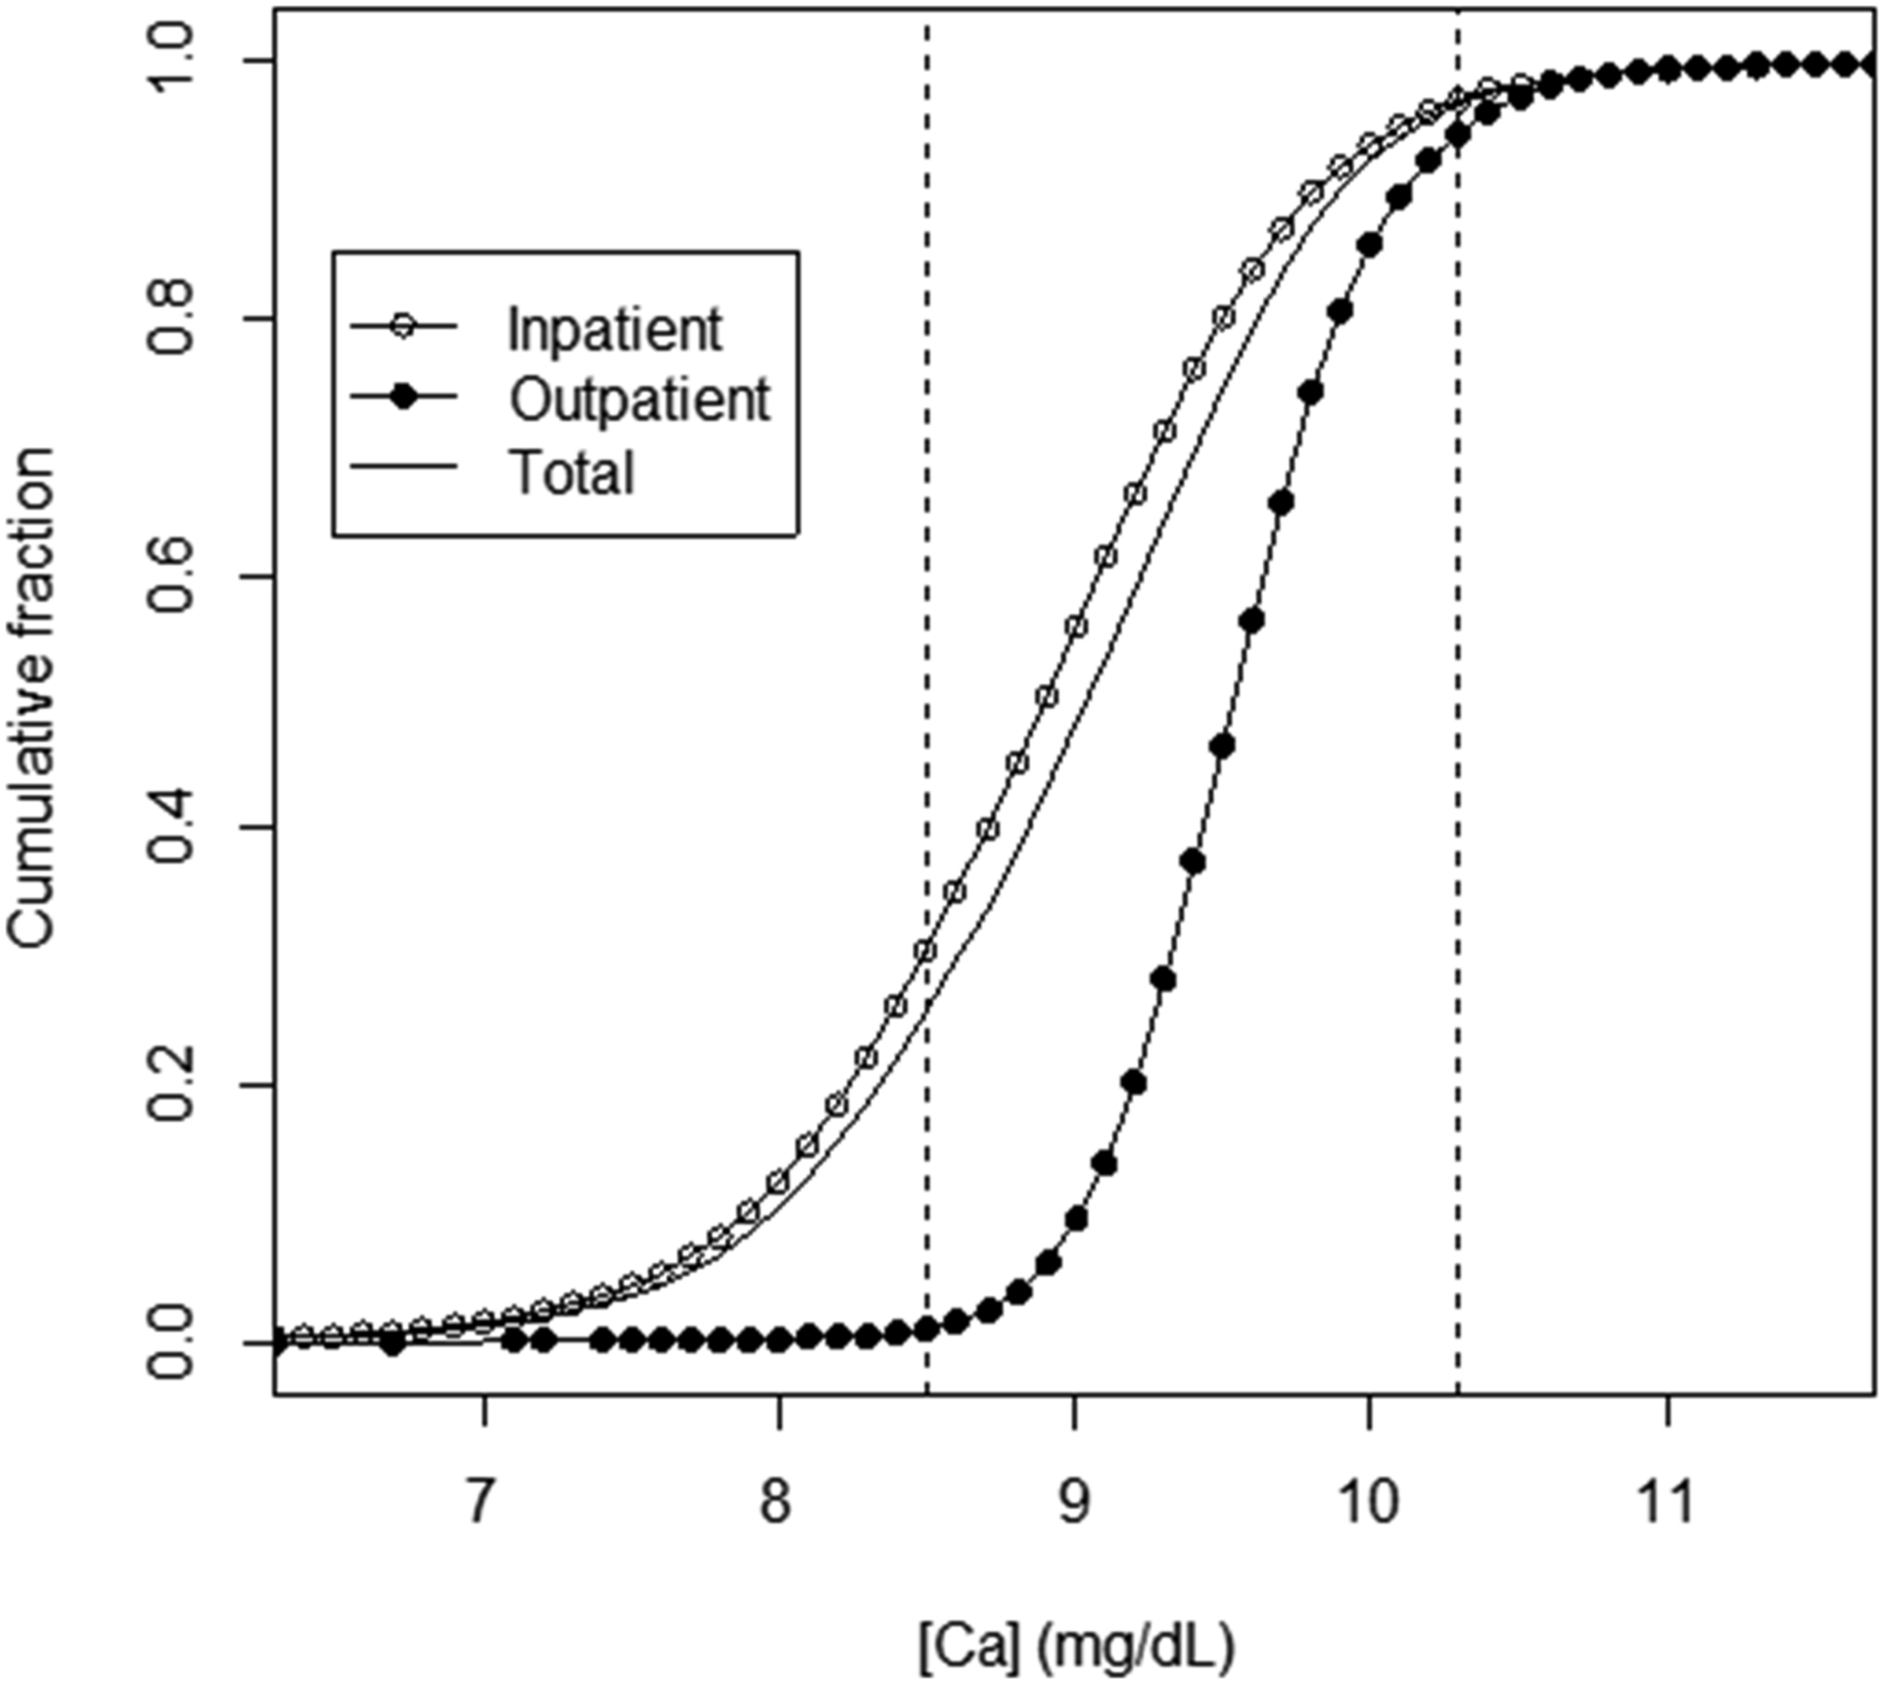
Properties of results in the pared dataset
For the pared Ca results dataset (results restricted to weekday results within RI), there were 39,629 Ca measurements (58.9% of results in the primary dataset), with IP = 75.3%, OP = 24.7%. Variation in numbers of samples per day by weekday varied by ±5% of the average number of samples per day. Overall Ca was 9.29 ± 0.47 mg/dL, compared to 9.40 ± 0.45 mg/dL for RI (assuming, for comparison, that RI is a normal distribution). For the pared database, the medians for Ca distributions for IP and OP were distinct (IP = 9.2 mg/dL; OP = 9.6 mg/dL); the median for combined IP and OP data was 9.3 mg/dL.
Time-of-day pattern for average Ca across 1-hour blocs for the pared dataset
Ca data from the pared database exhibited a significant time-of-day (TOD) pattern when parsed according to average Ca results within 1 h intervals (Figure 2). The 1-hour average Ca ranged from 9.1 to 9.5 mg/dL, with a mean of 9.29 mg/dL. This TOD pattern included two time blocs of contiguous results above (08:00–23:00 h; 53.3% of results; IP = 75.3%) and below (23:00–08:00 h; 46.7% of results; IP = 99.9%) the all-data mean. The SD within 1 h means was reasonably constant (0.12 ± 0.01 mg/dL). This general pattern was known to us from previous quality assurance (QA) investigations into stability of results distributions for all-comers Ca across different time intervals. Distribution of average [Ca] across 1-h blocs by hour of day. Horizontal dashed line: average Ca for all points within the dataset (n =39,629; [Ca] = 9.29 mg/dL).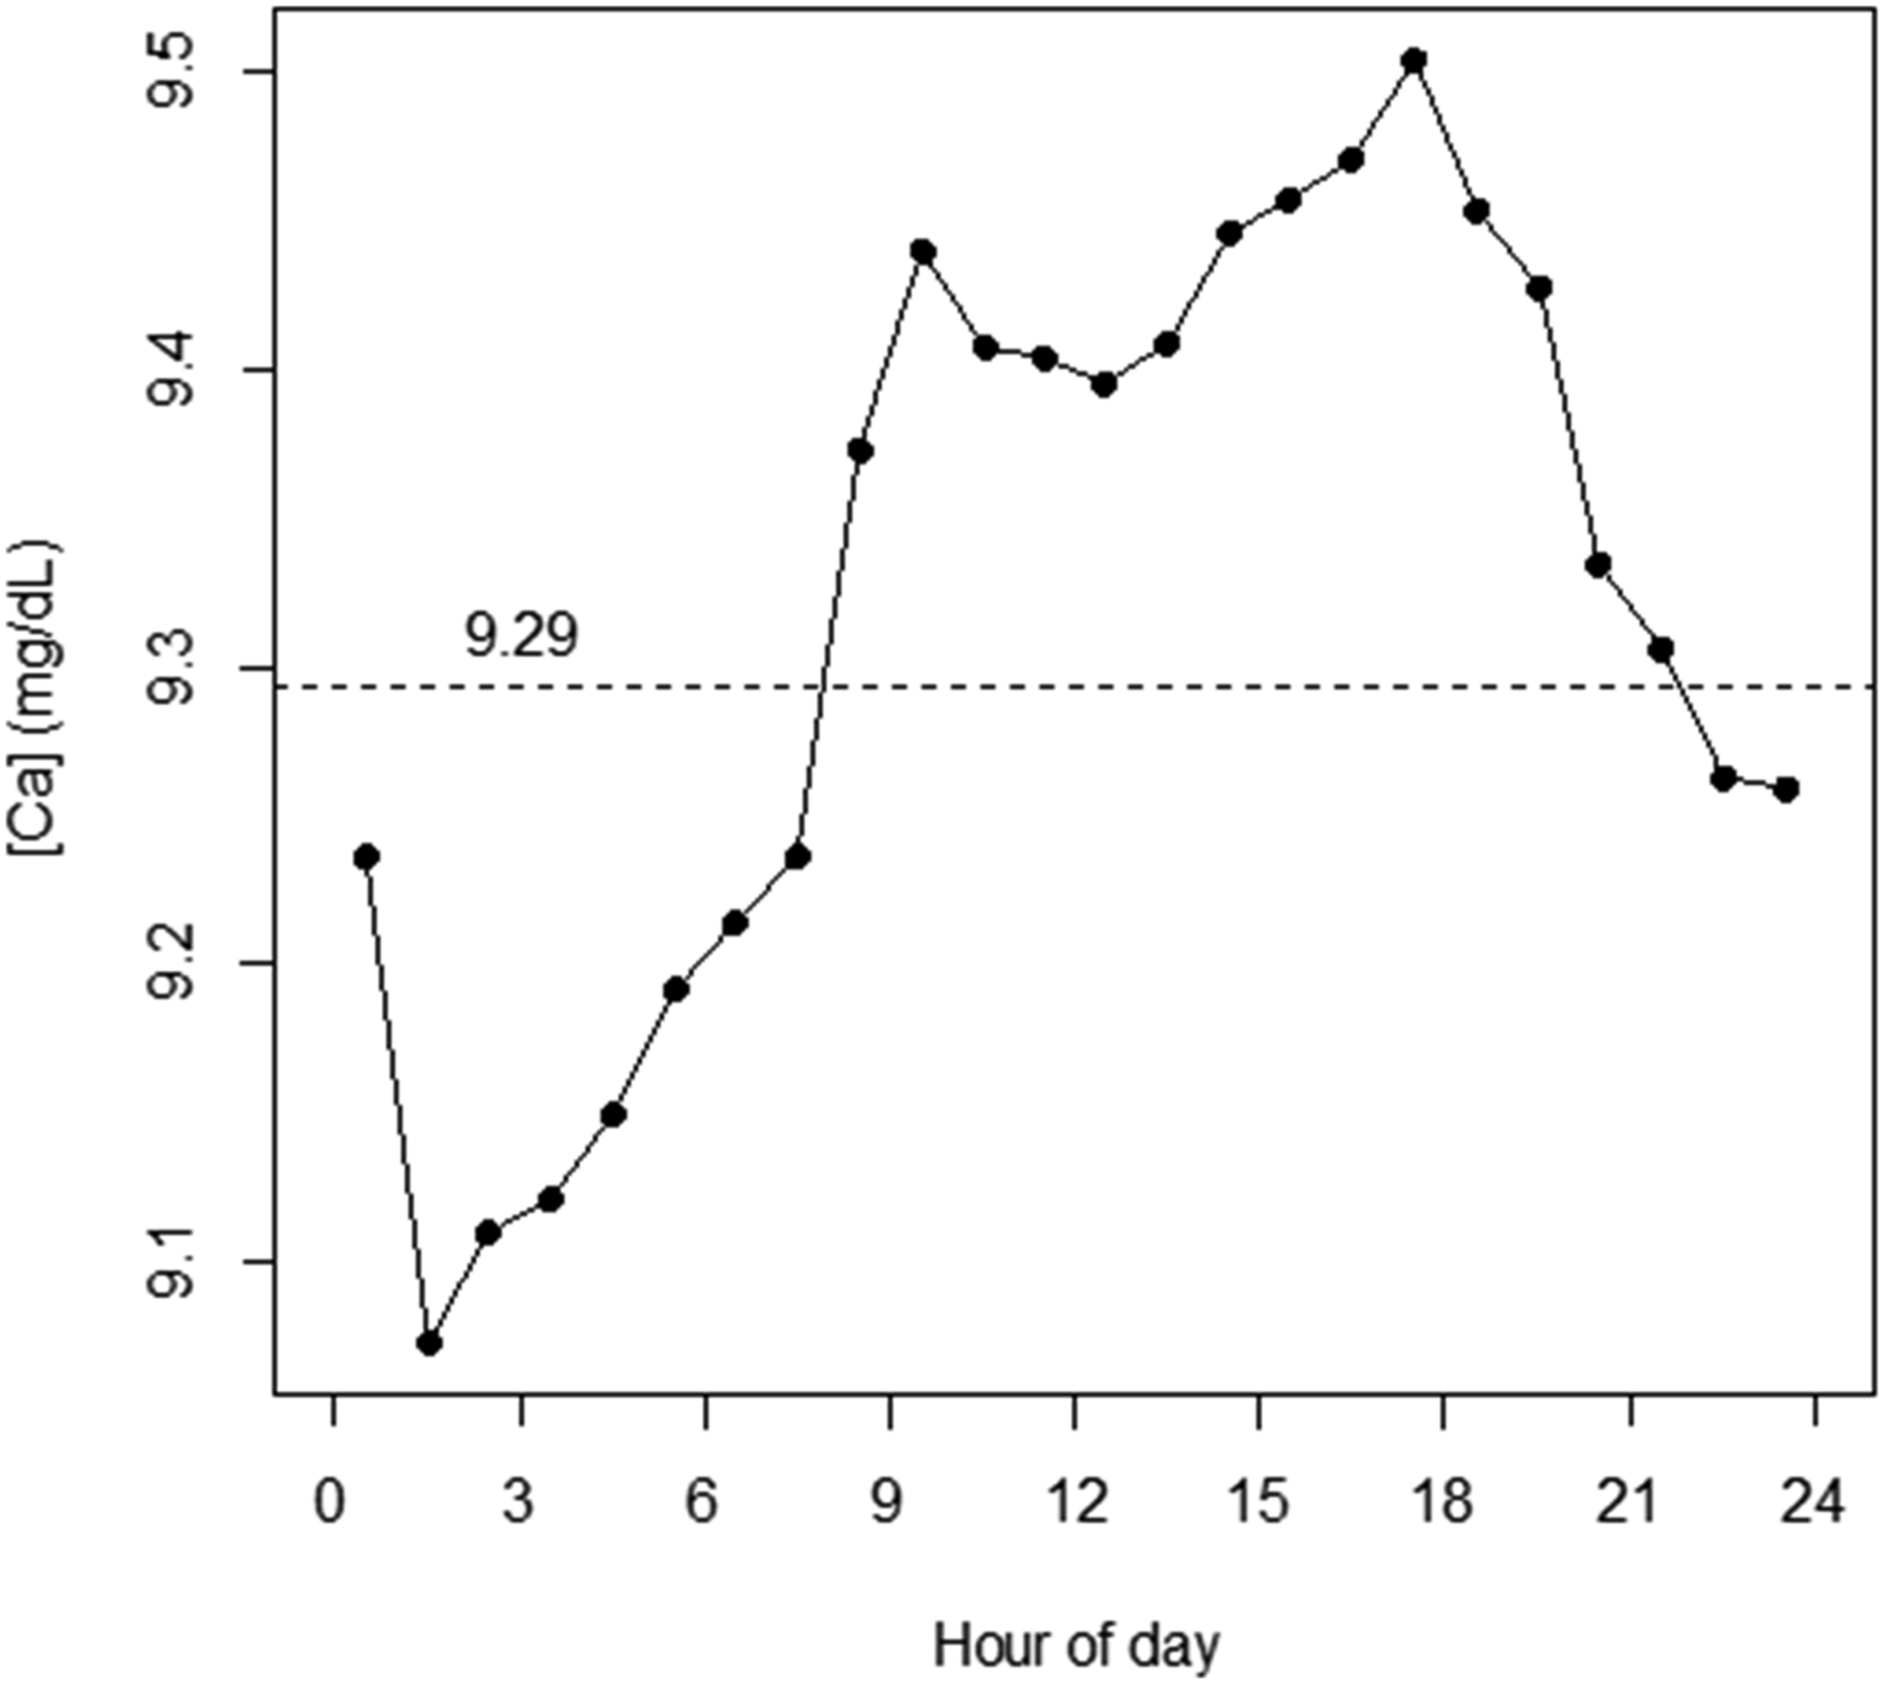
Figure 3(a) shows the distribution of numbers of samples per each hour of the 24-hour TOD cycle. Figure 3(b) shows the distribution of IP and OP fractions of samples versus TOD. Given the differences between IP and OP Ca (per Figure 1), the TOD-dependent pattern for average Ca appeared to be in part driven by the TOD-dependent IP/OP mix of samples. Properties of results counts. A. Results counts by hour of day. B. IP, OP fractions of results counts by hour of day.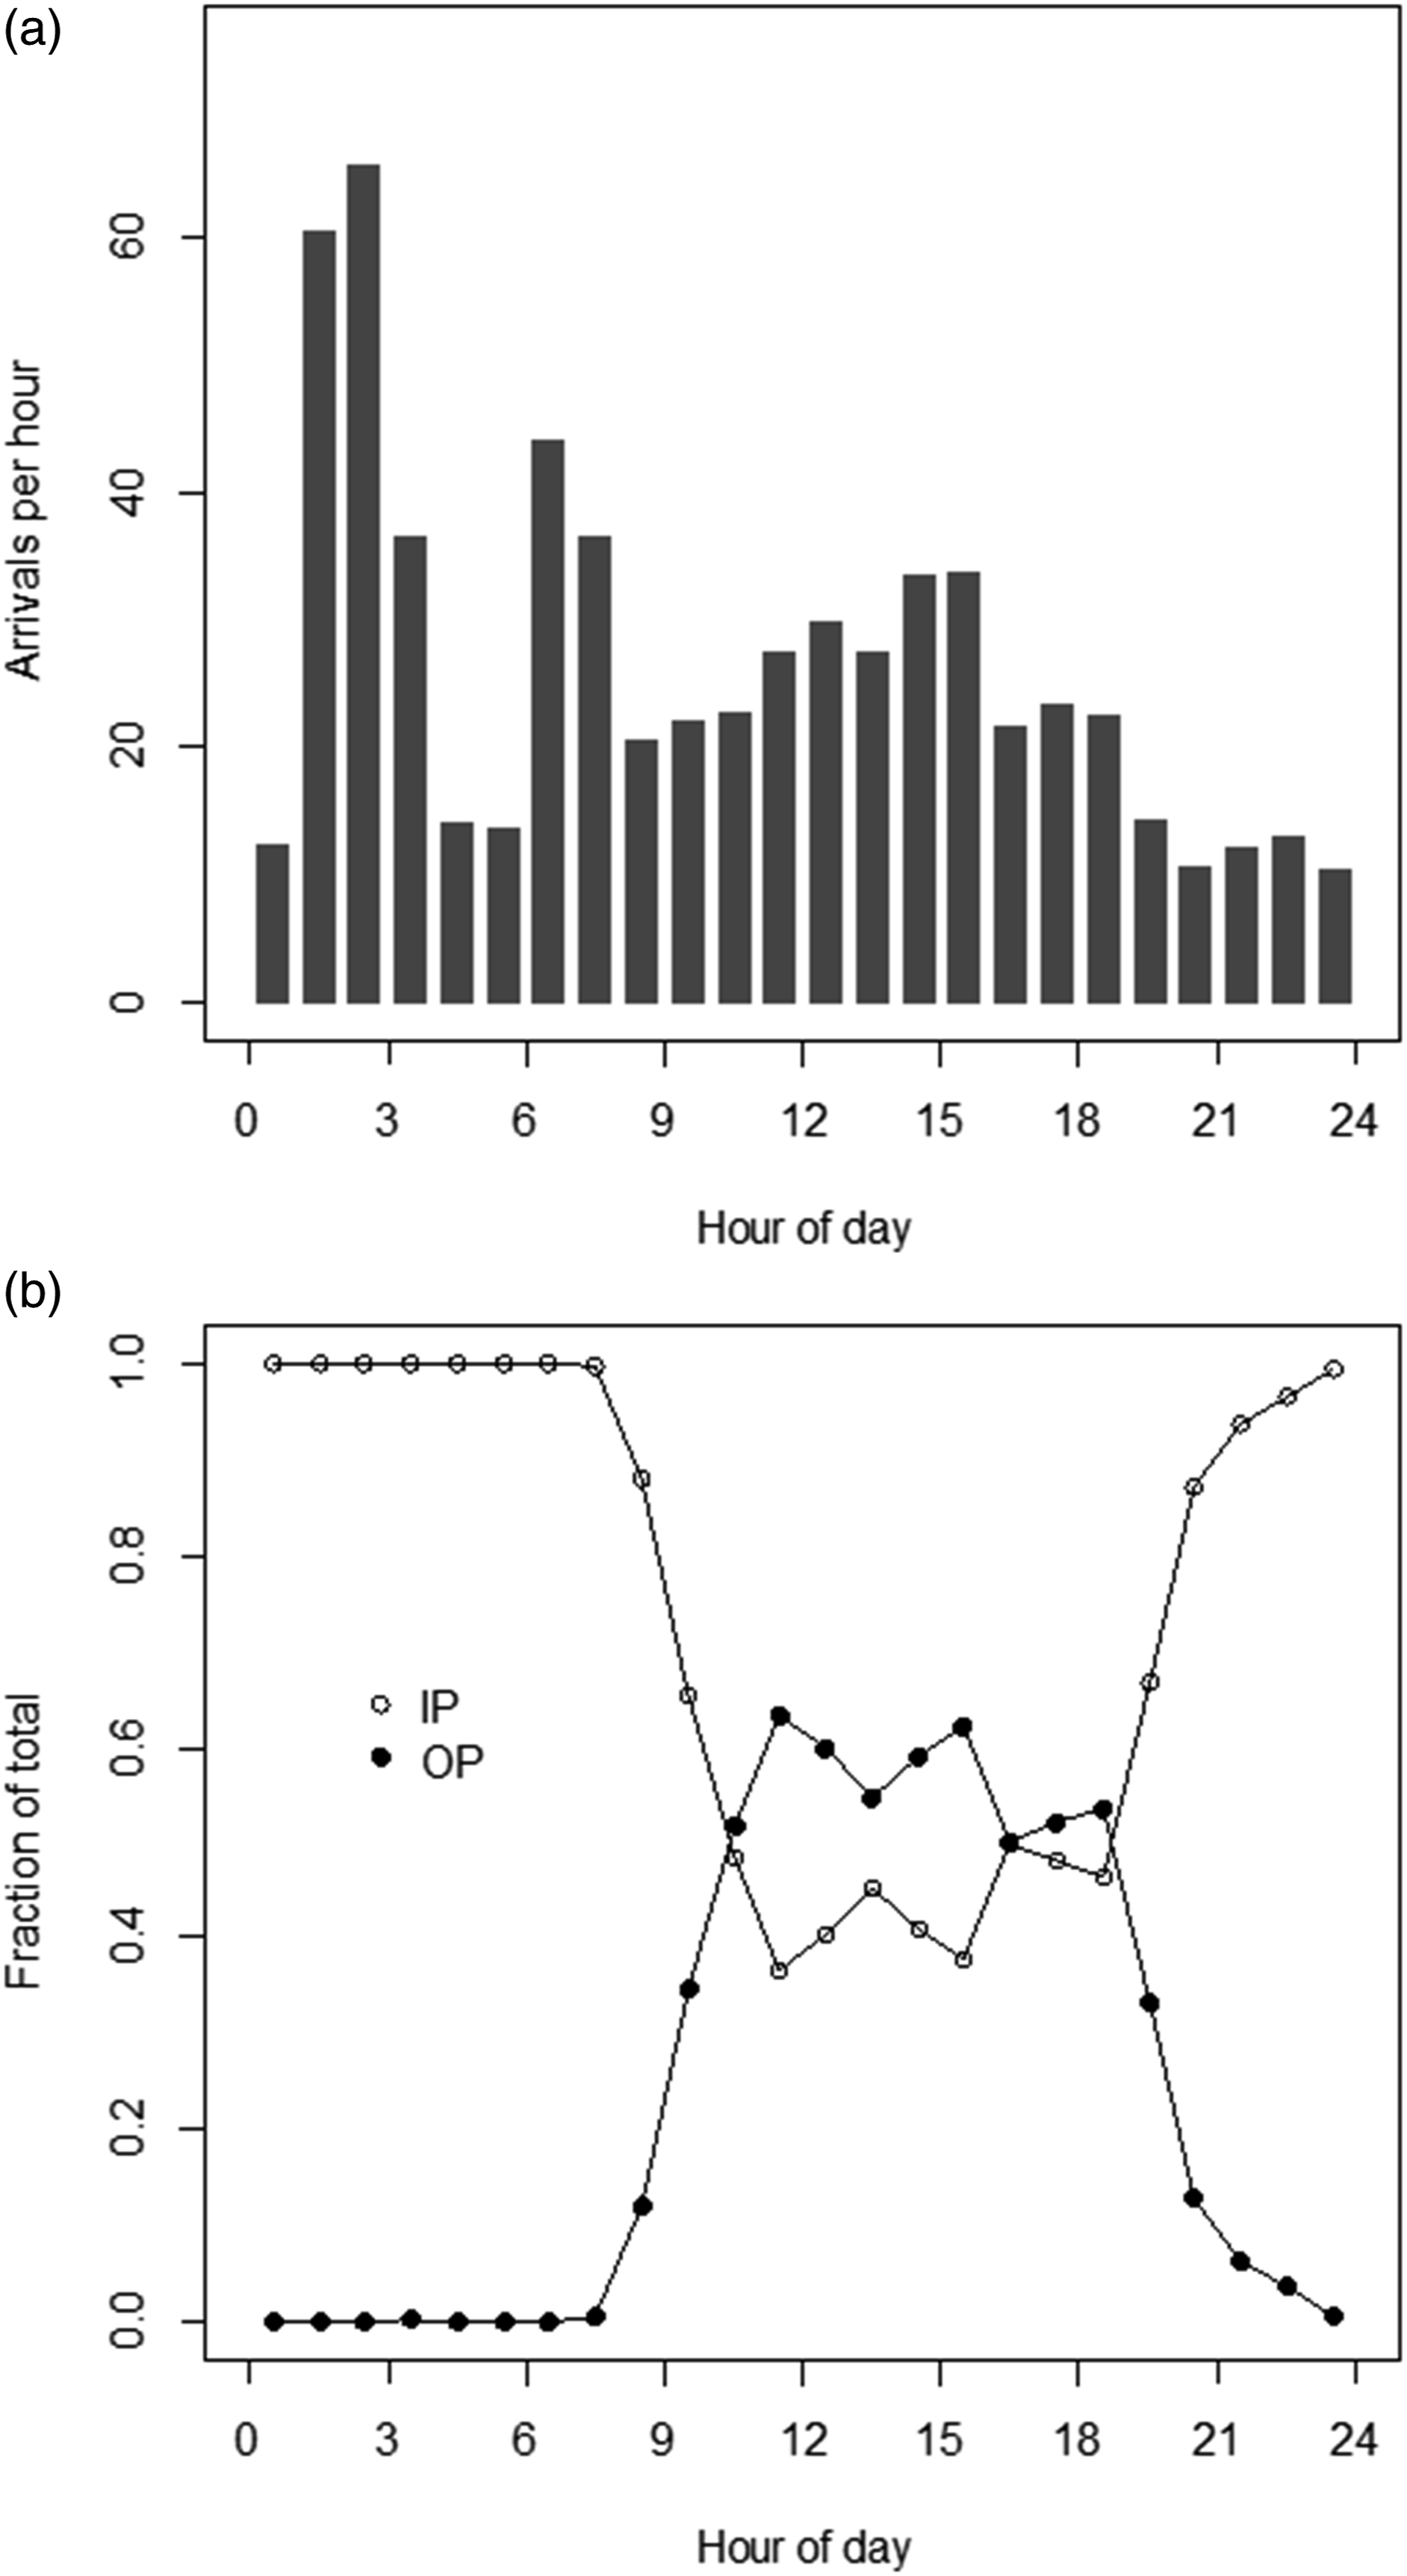
Properties of 20-mers
For PBQC analysis, we chose use of 20-mers as the input to PBQC targets. We will hereinafter use ‘20-mers’ to mean the average of a set of 20 successive Ca results rather than the 20-point dataset itself. Computing 20-mers on a sliding basis as described in Methods, there were 39,610 20-mers from the pared dataset of consecutive 39,629 results obtained over a 92 d interval.
Use of 20-mers was deemed to be suitable based simply on an evaluation of the distribution of their ‘look-back’ intervals (difference in time between first and last data points within each 20-mers). This was a skewed distribution: median = 38 min; mean = 46 min; 95th percentile = 112 min (data not shown). When segregated according to clock time of arrival in 1 h increments, the 1 h average of intervals was as low as 20 min, and did not exceed 110 min in the worst case (data not shown). Combining this information with rates of arrival of samples in Figure 3(a), the worst case scenario, for some limited interval within the 24-hour cycle, would be assessment of new input values for PBQC at a rate of approximately ten 20-mers per hour, having an average ‘lookback’ interval of not more than 2 hours, or, alternatively, inputs of non-overlapping, independent 20-mers at a rate of not less than one per every 2 hours.
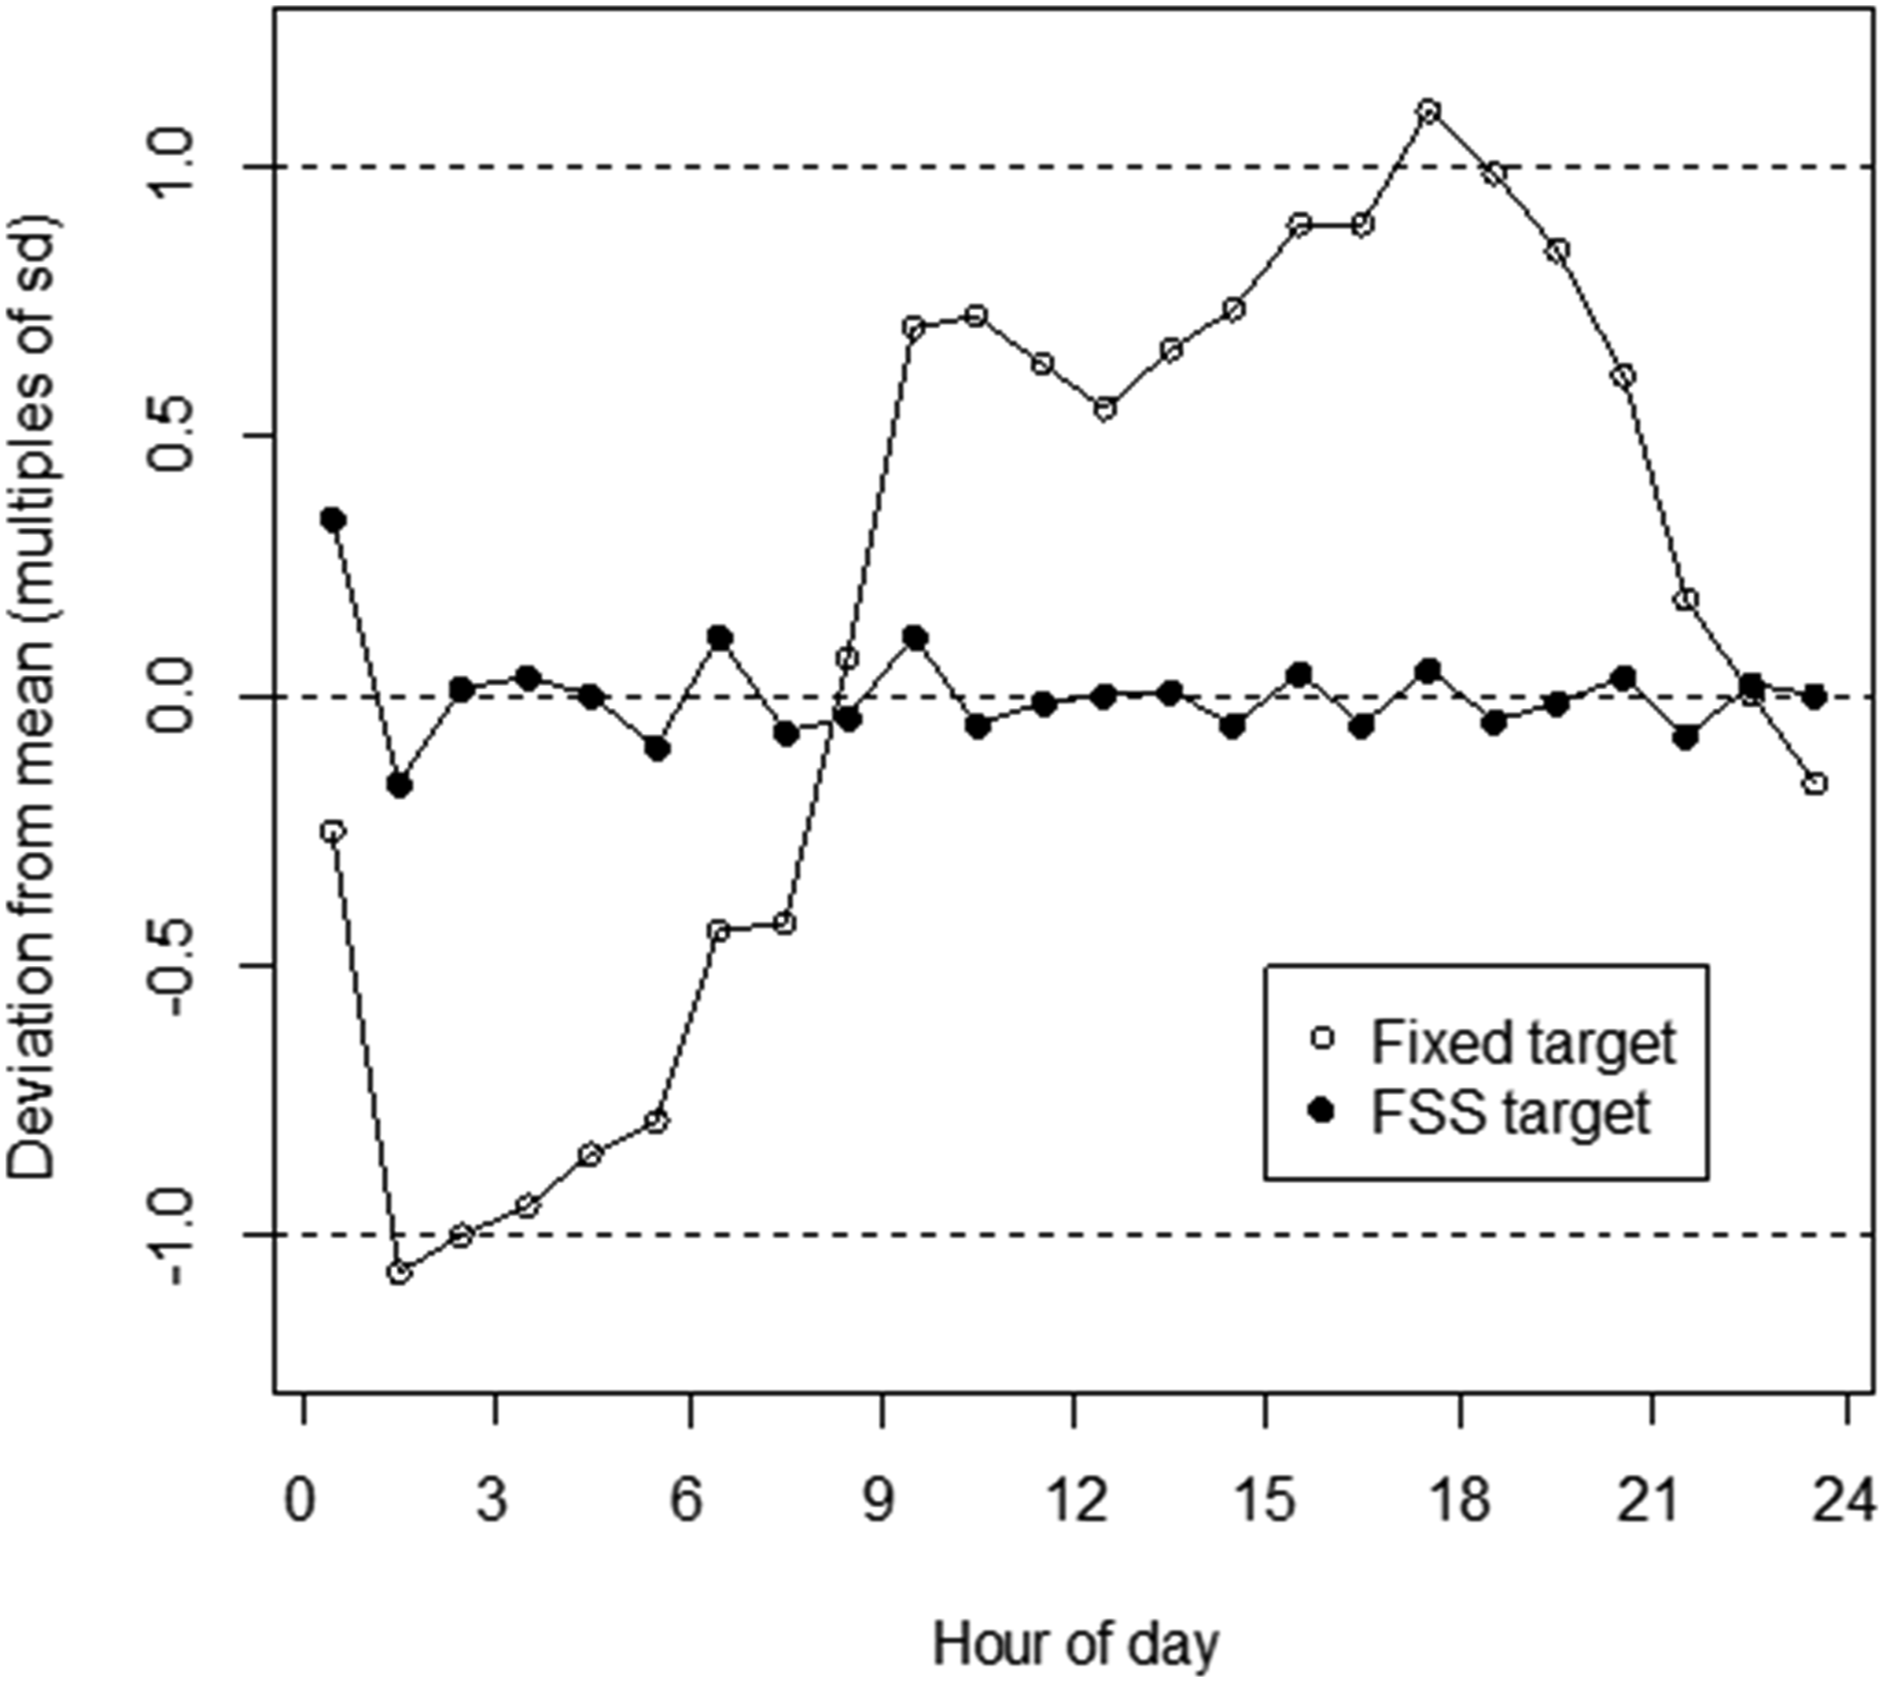
Figure 4(a) shows the Ca distribution for 20-mers. These data were essentially normally distributed, with Ca = 9.29 ± 0.18 mg/dL (mean ± 1SD). Figure 4(b) shows the TOD-dependent variation in average of 20-mers when parsed according to 1-hour intervals. The pattern reflects that shown in Figure 2. The important aspect of these data is that the range of values in Figure 5 (9.1–9.5 mg/dL) is such that the periodic variation of average 20-mers above and below their mean (roughly ±0.2 mg/dL) is of a scale that is comparable to the SD of the overall 20-mers distribution (0.18 mg/dL). Properties of 20-mers. A. Distribution of average [Ca] for 20-mers (n = 39,610; [Ca] = 9.29 ± 0.184 mg/dL). B. Average of 20-mers Ca results across 1-h blocs by hour of day. Horizontal dashed line: average Ca for all points within the dataset (n =39,610; [Ca] = 9.29 mg/dL (from Figure 4(a))). Solid line: Partial Fourier sine series (FSS) representation of data. (For details on generation of FSS, see Appendix.) Calculated errors for 20-mers (average within 1-h blocs) by hour of day. Data for errors was computed as deviation from either the fixed target (9.29 mg/dL) or TOD-dependent FSS target. Error (y axis) is represented as multiples of the standard deviation (SD) for all 20-mers results data (sd = 0.184 mg/dL, from Figure 4(a)).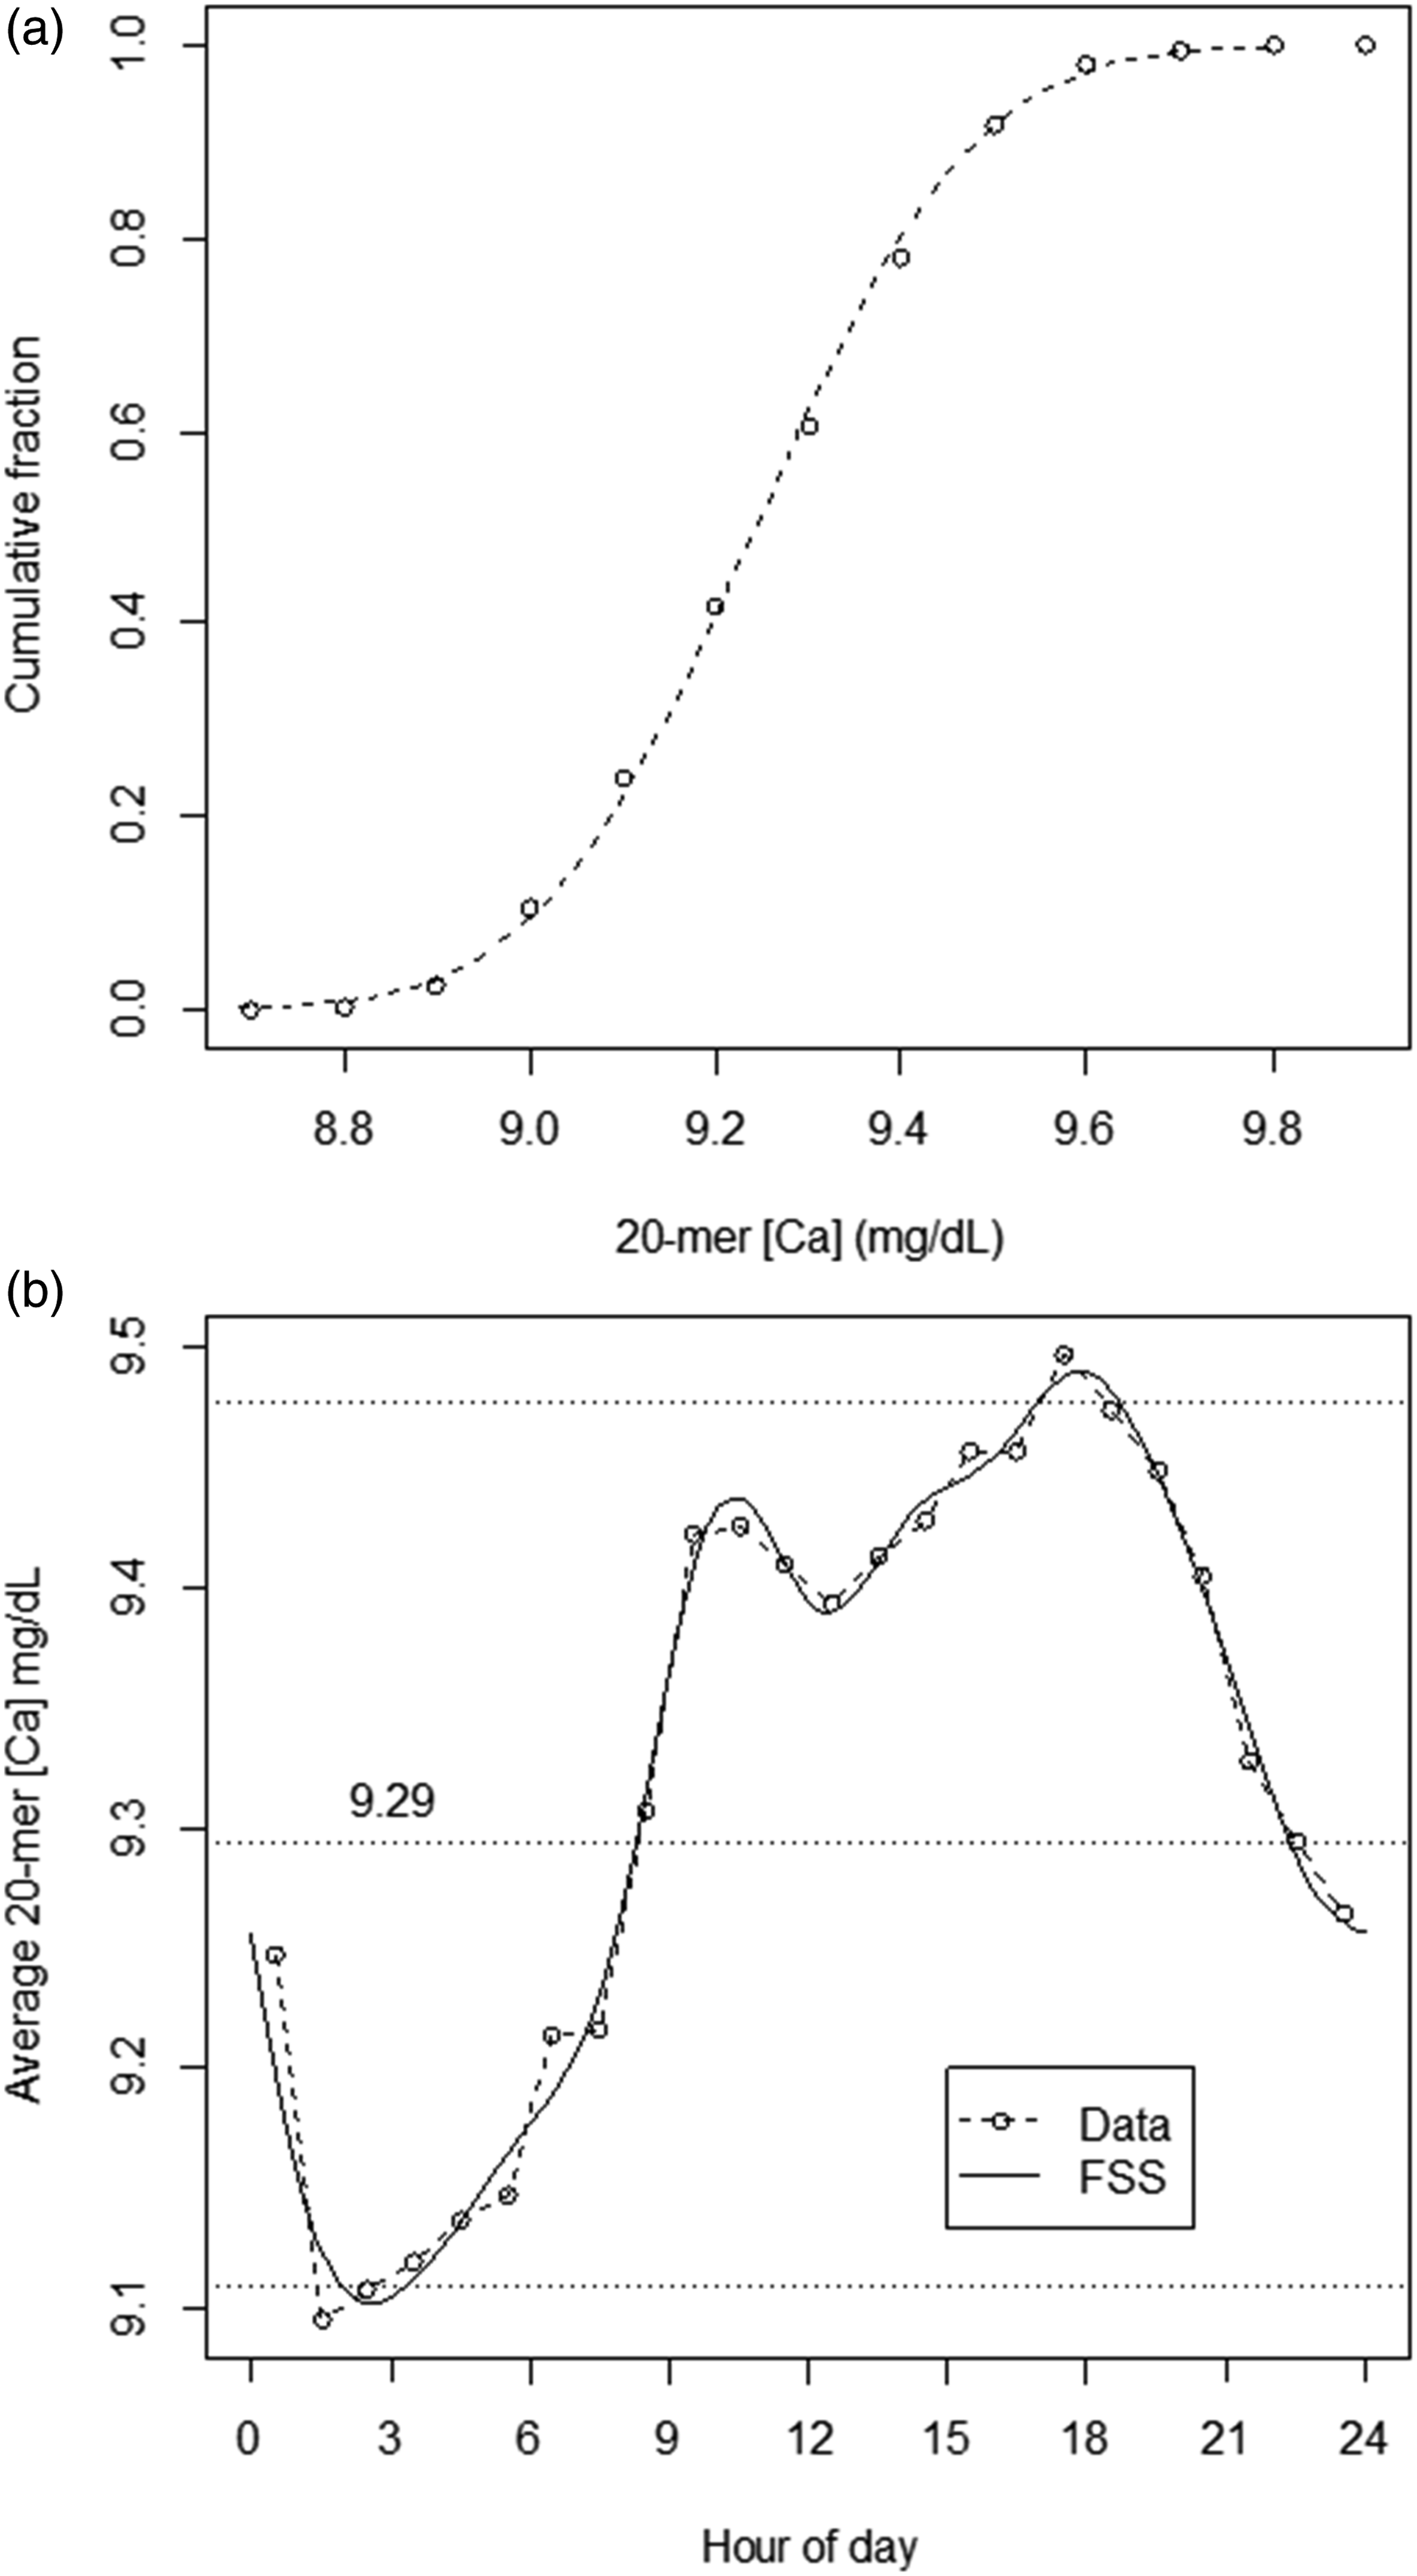
From these data, it is apparent that use of a fixed PBQC target for 20-mers based on the average for 20-mers would lead to a regular inherent TOD-dependent cyclical pattern of deviation of 20-mers results from target. Correspondingly, use of a fixed target could produce regular TOD-dependent variation in probabilities both for false positive (FP) and false negative (FN) results in PBQC interpretations. Ideally, probabilities of FP and FN would not have such TOD-dependence. We therefore examined characterization of the TOD-dependent pattern for use in generation of TOD-specific targets in PBQC.
Characterization and use of TOD-dependent 20-mers data as PBQC targets
A straightforward approach to characterization of periodic data is to use a Fourier series. In our example, we used a Fourier sine series (FSS). Figure 4(b) includes a smoothed FSS-based profile for 20-mers means versus TOD as derived from the primary data. Details for generation of the FSS profile are given in the Appendix. An advantage to use of FSS is that an incoming 20-mers result can be compared easily to a target value that is specific for its time of arrival.
The effect of use of this strategy is shown in Figure 5. In this figure, 20-mers results are shown as variation from target in terms of multiples of the sd of the overall 20-mers data, for conditions of using either: 1. the overall 20-mers average data as a fixed target; or 2. the FSS TOD-dependent target. Use of FSS changed target comparison error for average 1 h intervals of 20-mers means to a distribution that had no significant TOD-dependence.
We examined these data further in terms of how they might be encountered in actual practice. In the calculations above, we used sliding 20-mers averages (n = 39,610) to determine the FSS series. In practice, one would follow only independent, non-overlapping 20-mer averages to assess for deviations such as 1-2SD, 2-2SD, 1-3SD, etc. In the calculations below, we parse the dataset to be that of a time-ordered sequence of non-overlapping 20-mers, beginning with the 1st entry, and proceeding from there (viz., using elements 1, 21, 41, 61, etc. from the original list) to reduce the dataset to n = 1981 independent 20-mers elements. (Note that use of starting element 2, 3, 4, etc. would make no substantive difference to the analysis that follows.)
Figure 6(a) shows the cumulative distributions of deviations from target for this dataset using either a fixed target, or the FSS-derived TOD-dependent targets as in Figure 5. Reviewing these data for the fixed target, all would appear to be in good order. The dataset is essentially perfectly normally distributed, consistent with an interval in which the process was in control, and with rates of deviations (e.g. deviations >2SD = 5% of results) consistent with a normal distribution. However, evaluation of control with respect to distribution of errors with respect to TOD-dependent targets also presents a perfect normal distribution, but with a much narrower SD. The ratio of standard deviations between the two strategies is quite high (fixed target SD/TOD target SD =1.61). Thus, because of this difference in scale of SDs, there is decreased sensitivity for systematic error detection when using a fixed target. For instance, a 2-SD using TOD targets (at ±0.23 mg/dL) is only a 1.24-SD when using a fixed target. Under the in-control conditions of our dataset, among 99 instances of 1-2SD flags using TOD targets (5% of all results), only 26 (26.2%) registered as 1-2SD using the fixed target; among 6 instances of 1-3SD flags using TOD targets (0.3% of all results), only 2 (33.3%) registered as 1-3SD using the fixed target. Figures 6(b) and (c) show the TOD profiles of the deviations from target in the dataset. Use of a fixed target demonstrates cycling of bias relative to either high or low deviations, in comparison to time-invariant bias when using TOD targets. In comparison to use of TOD targets, use of a fixed target would also increase probability of indications of ‘one side of mean’ persistence. Properties of PBQC using independent 20-mers (n = 1981). A. Distributions of deviations (Δ) from target. For fixed target, Δ = 0 ± 0.185 mg/dL; for TOD targets, Δ = 0 ± 0.115 mg/dL. B. Deviations from target versus TOD using a fixed target. Dashed lines: 0 ± 2SD. C. Deviations from target versus TOD using TOD targets. Dashed lines: 0 ± 2SD.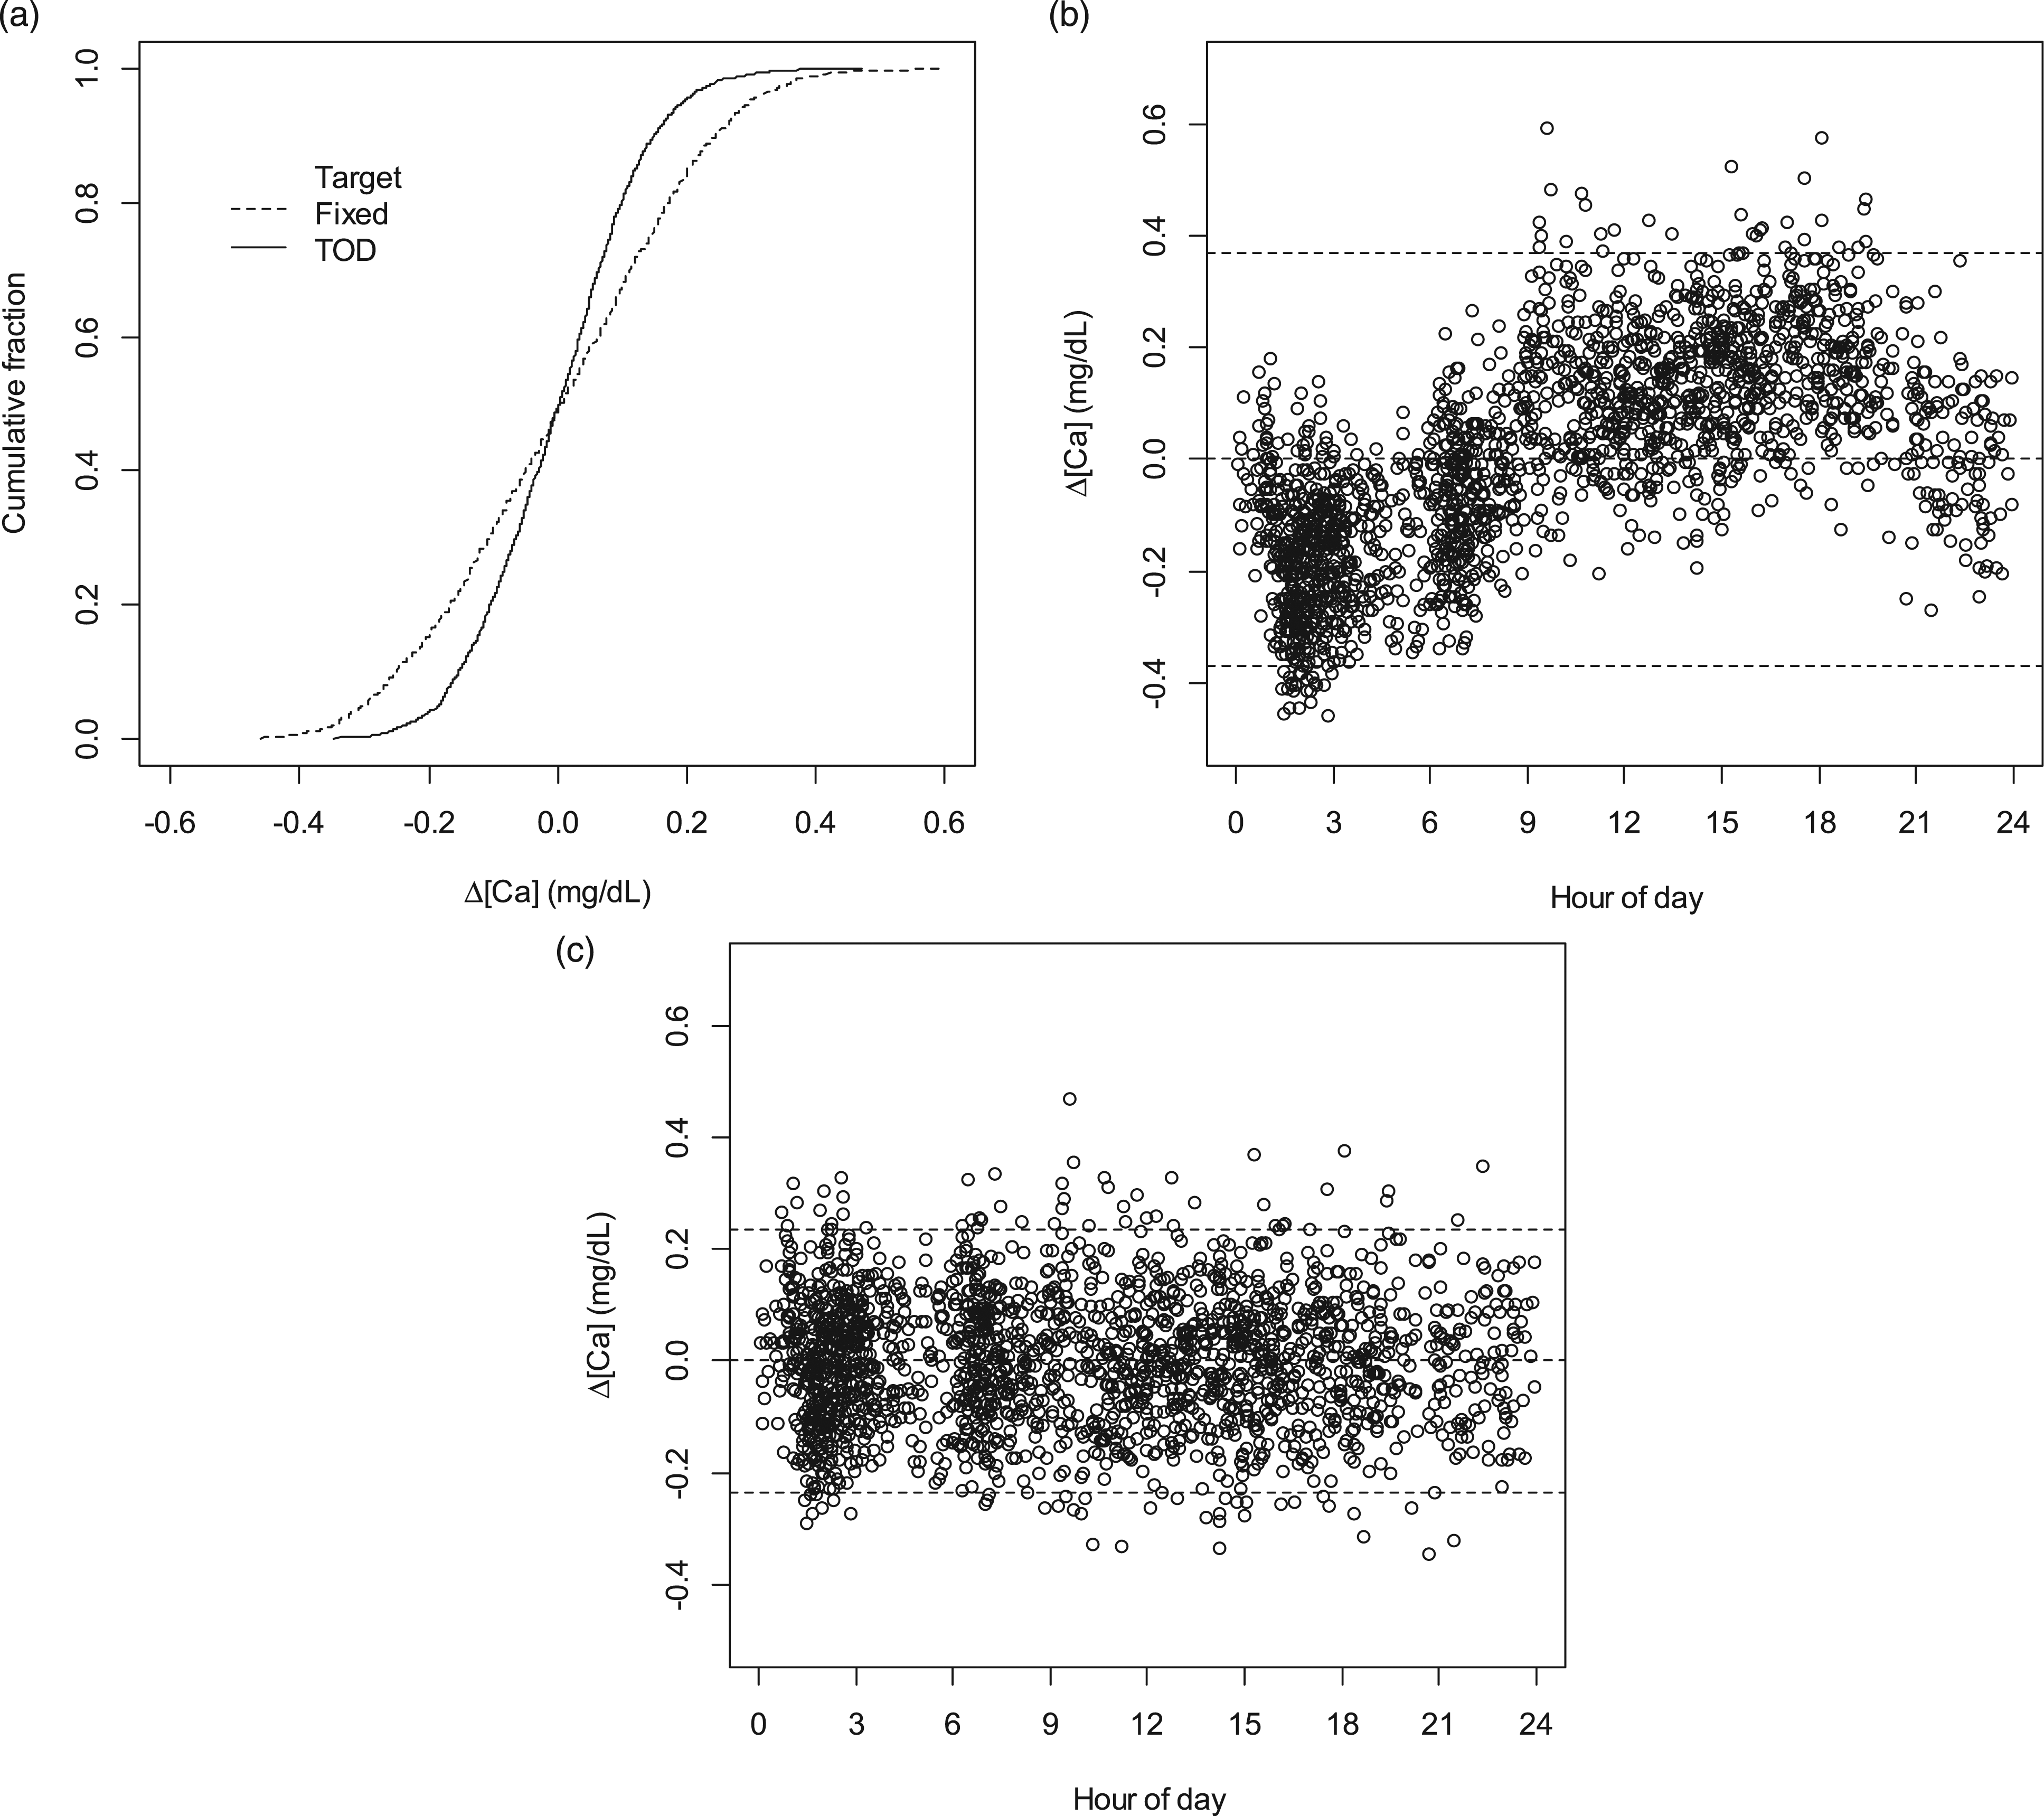
Figures 6(b) and (c) were generated in the context of already knowing that a periodic pattern existed. However, in this case, a normal monthly review of PBQC data using a fixed target would likely lead to an examination of the data in this form. Figure 7(a) shows a one-month Levey–Jennings plot from the dataset using a fixed target. Arguably, the periodicity of the pattern exhibited would be recognized as aberrant and counter to expectation. In contrast, the Levey–Jennings plot for use of TOD targets (Figure 7(b)) is not distinguished from that obtained by substituting results with numbers using a random number generator according to the probabilities of a normal distribution having mean = 0 and SD = 1 (Figure 7(c)). 1-month Levey-Jennings plots for PBQC using independent 20-mers (n = 639). A. Plot using fixed target. B. Plot using TOD targets. C. For comparison, plot using results of a random number generator according to probabilities of a normal distribution having mean = 0 and SD = 1.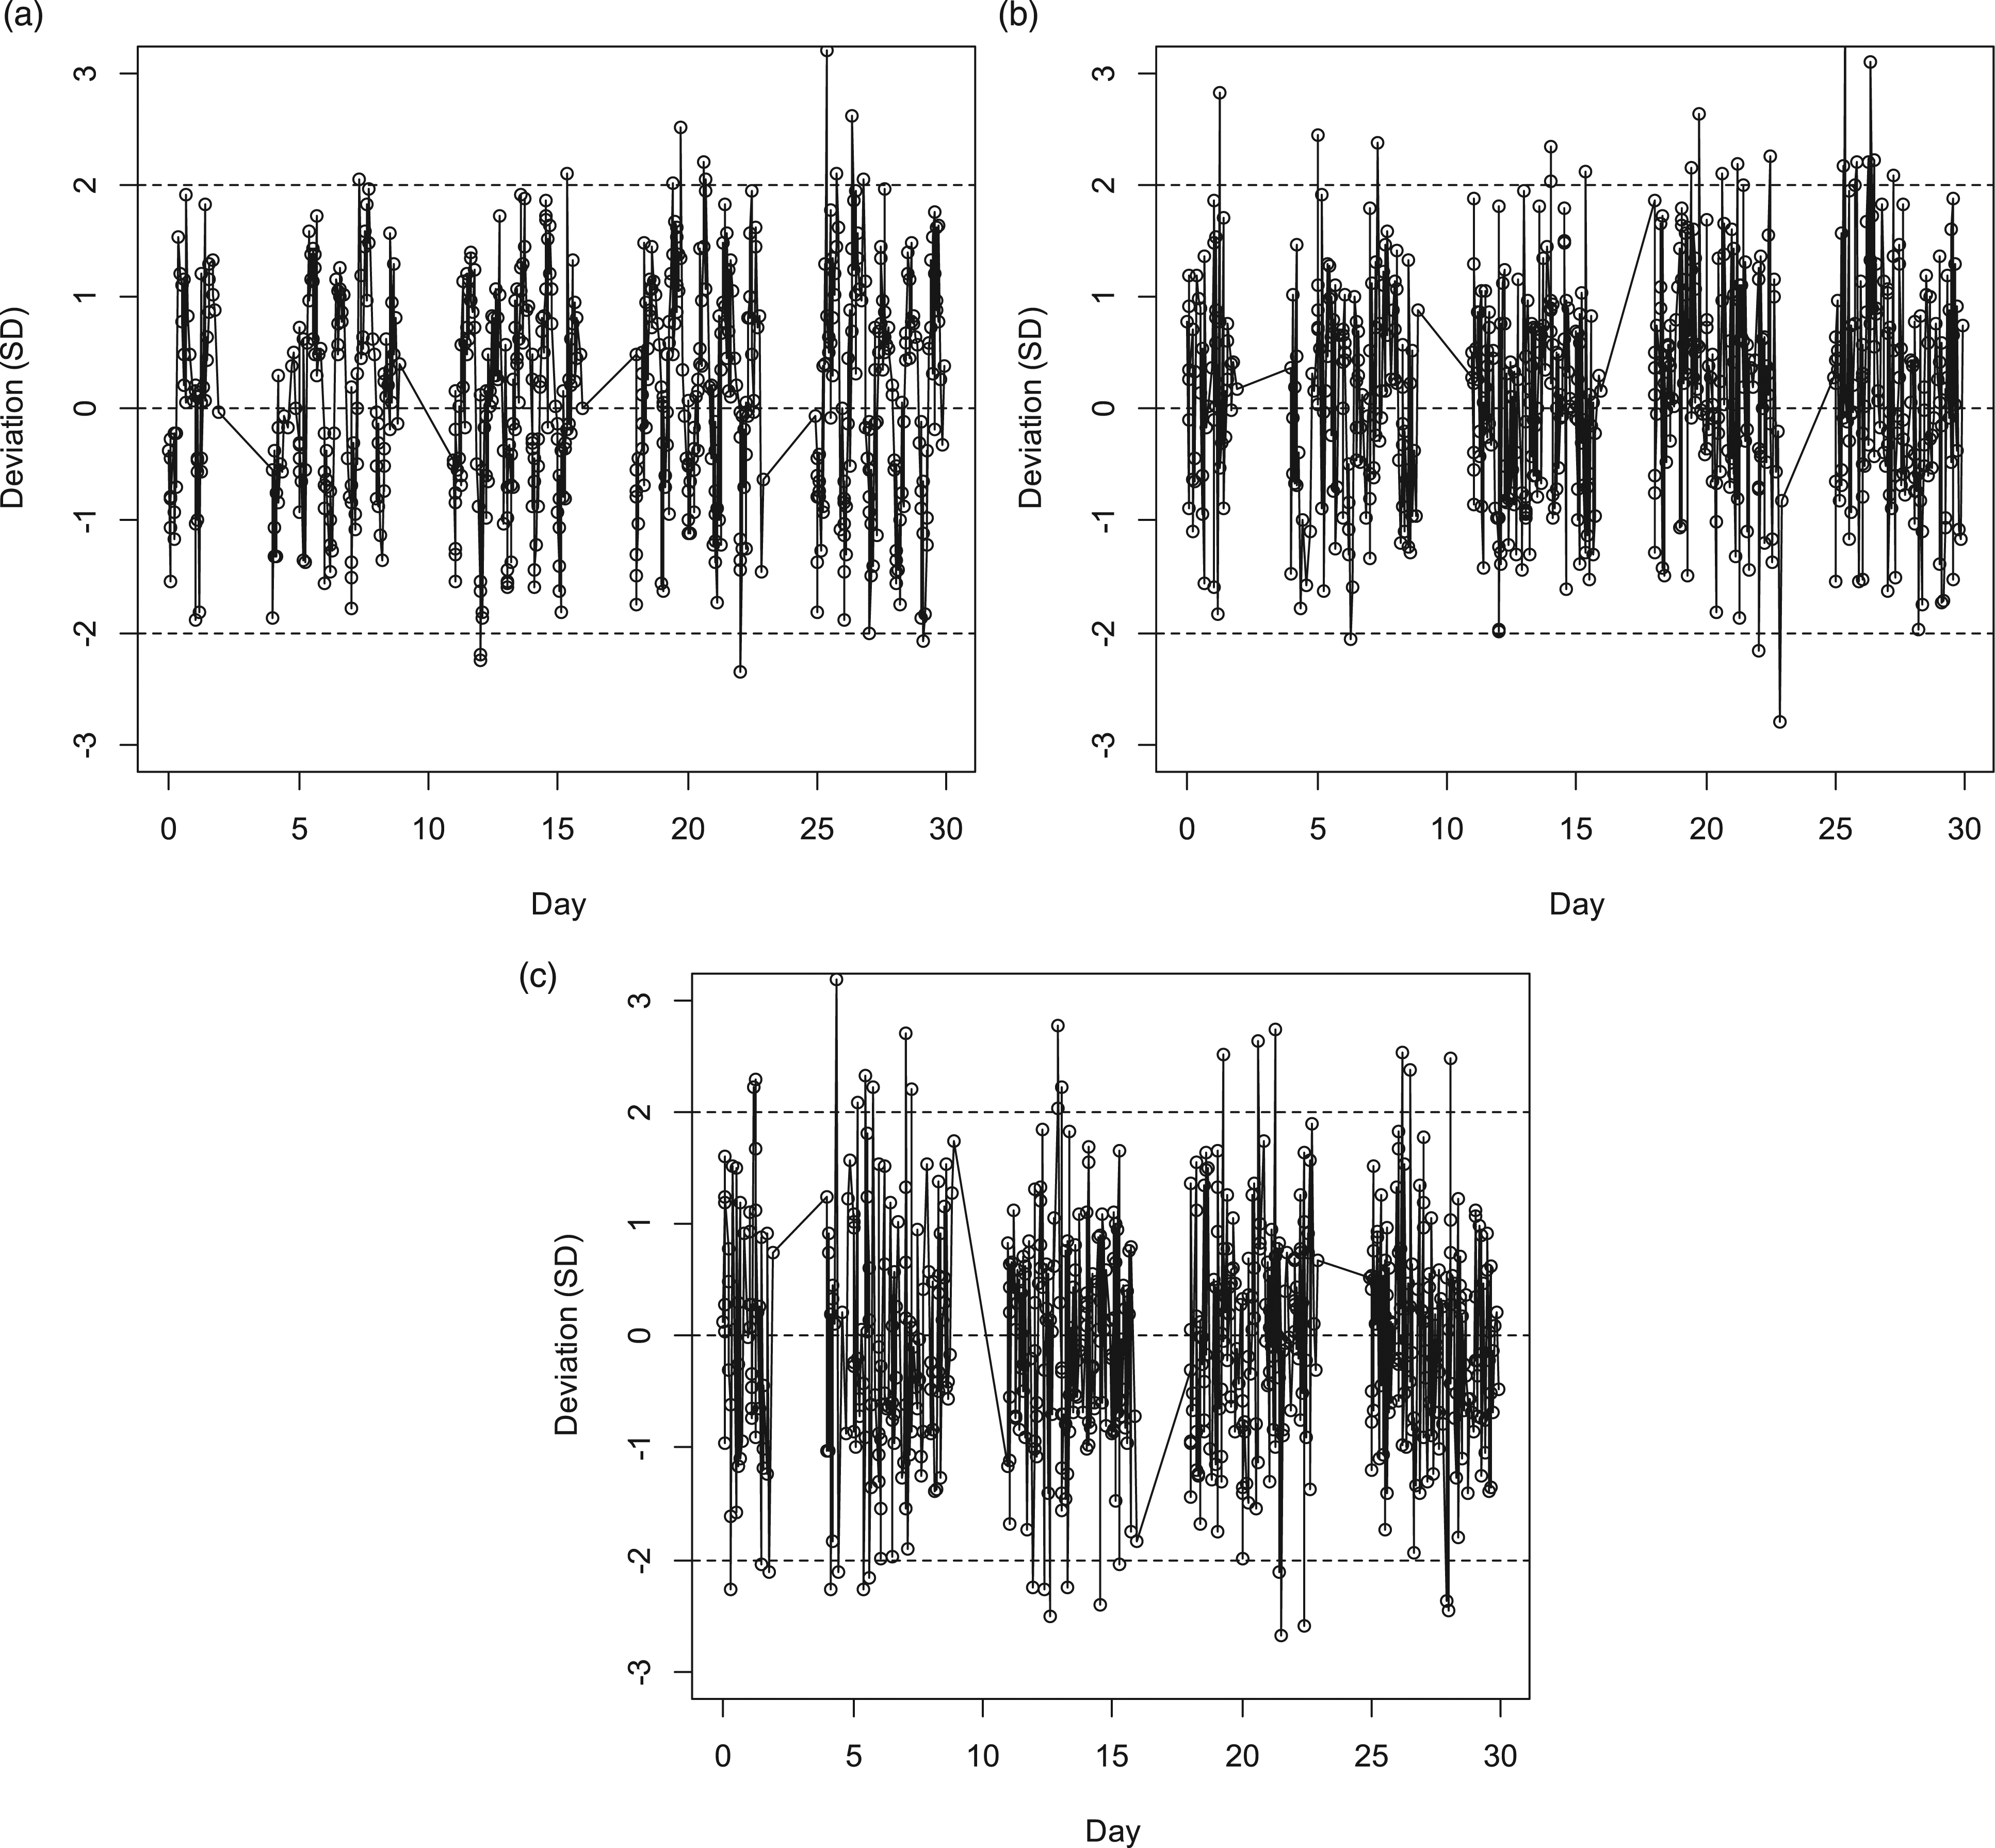
Monthly variation of FSS profiles
Our FSS profile was based on a 3-month interval dataset. We examined FSS profile variation across the 3 individual months in this interval. As shown in Figure 8, there was general congruity of shapes of profiles as a function of time, but with some variation in absolute magnitude of local maxima and minima. For implementation in PBQC, the interval used for determination of the FSS would be a variable. At our institution, patient Ca distribution data as shown in Figure 1 are practically invariant across time. Given this overall long-term stability of the patient results distribution, it is likely that a longer (3 months) rather than shorter (1 month) interval for the basis data used for specification of the FSS targets would be appropriate. TOD average Ca results parsed by month for a contiguous 3-month interval. Solid line: FSS for entire dataset as shown in Figure 4(b). Additional lines: FSS parsed by individual months (July, August, September).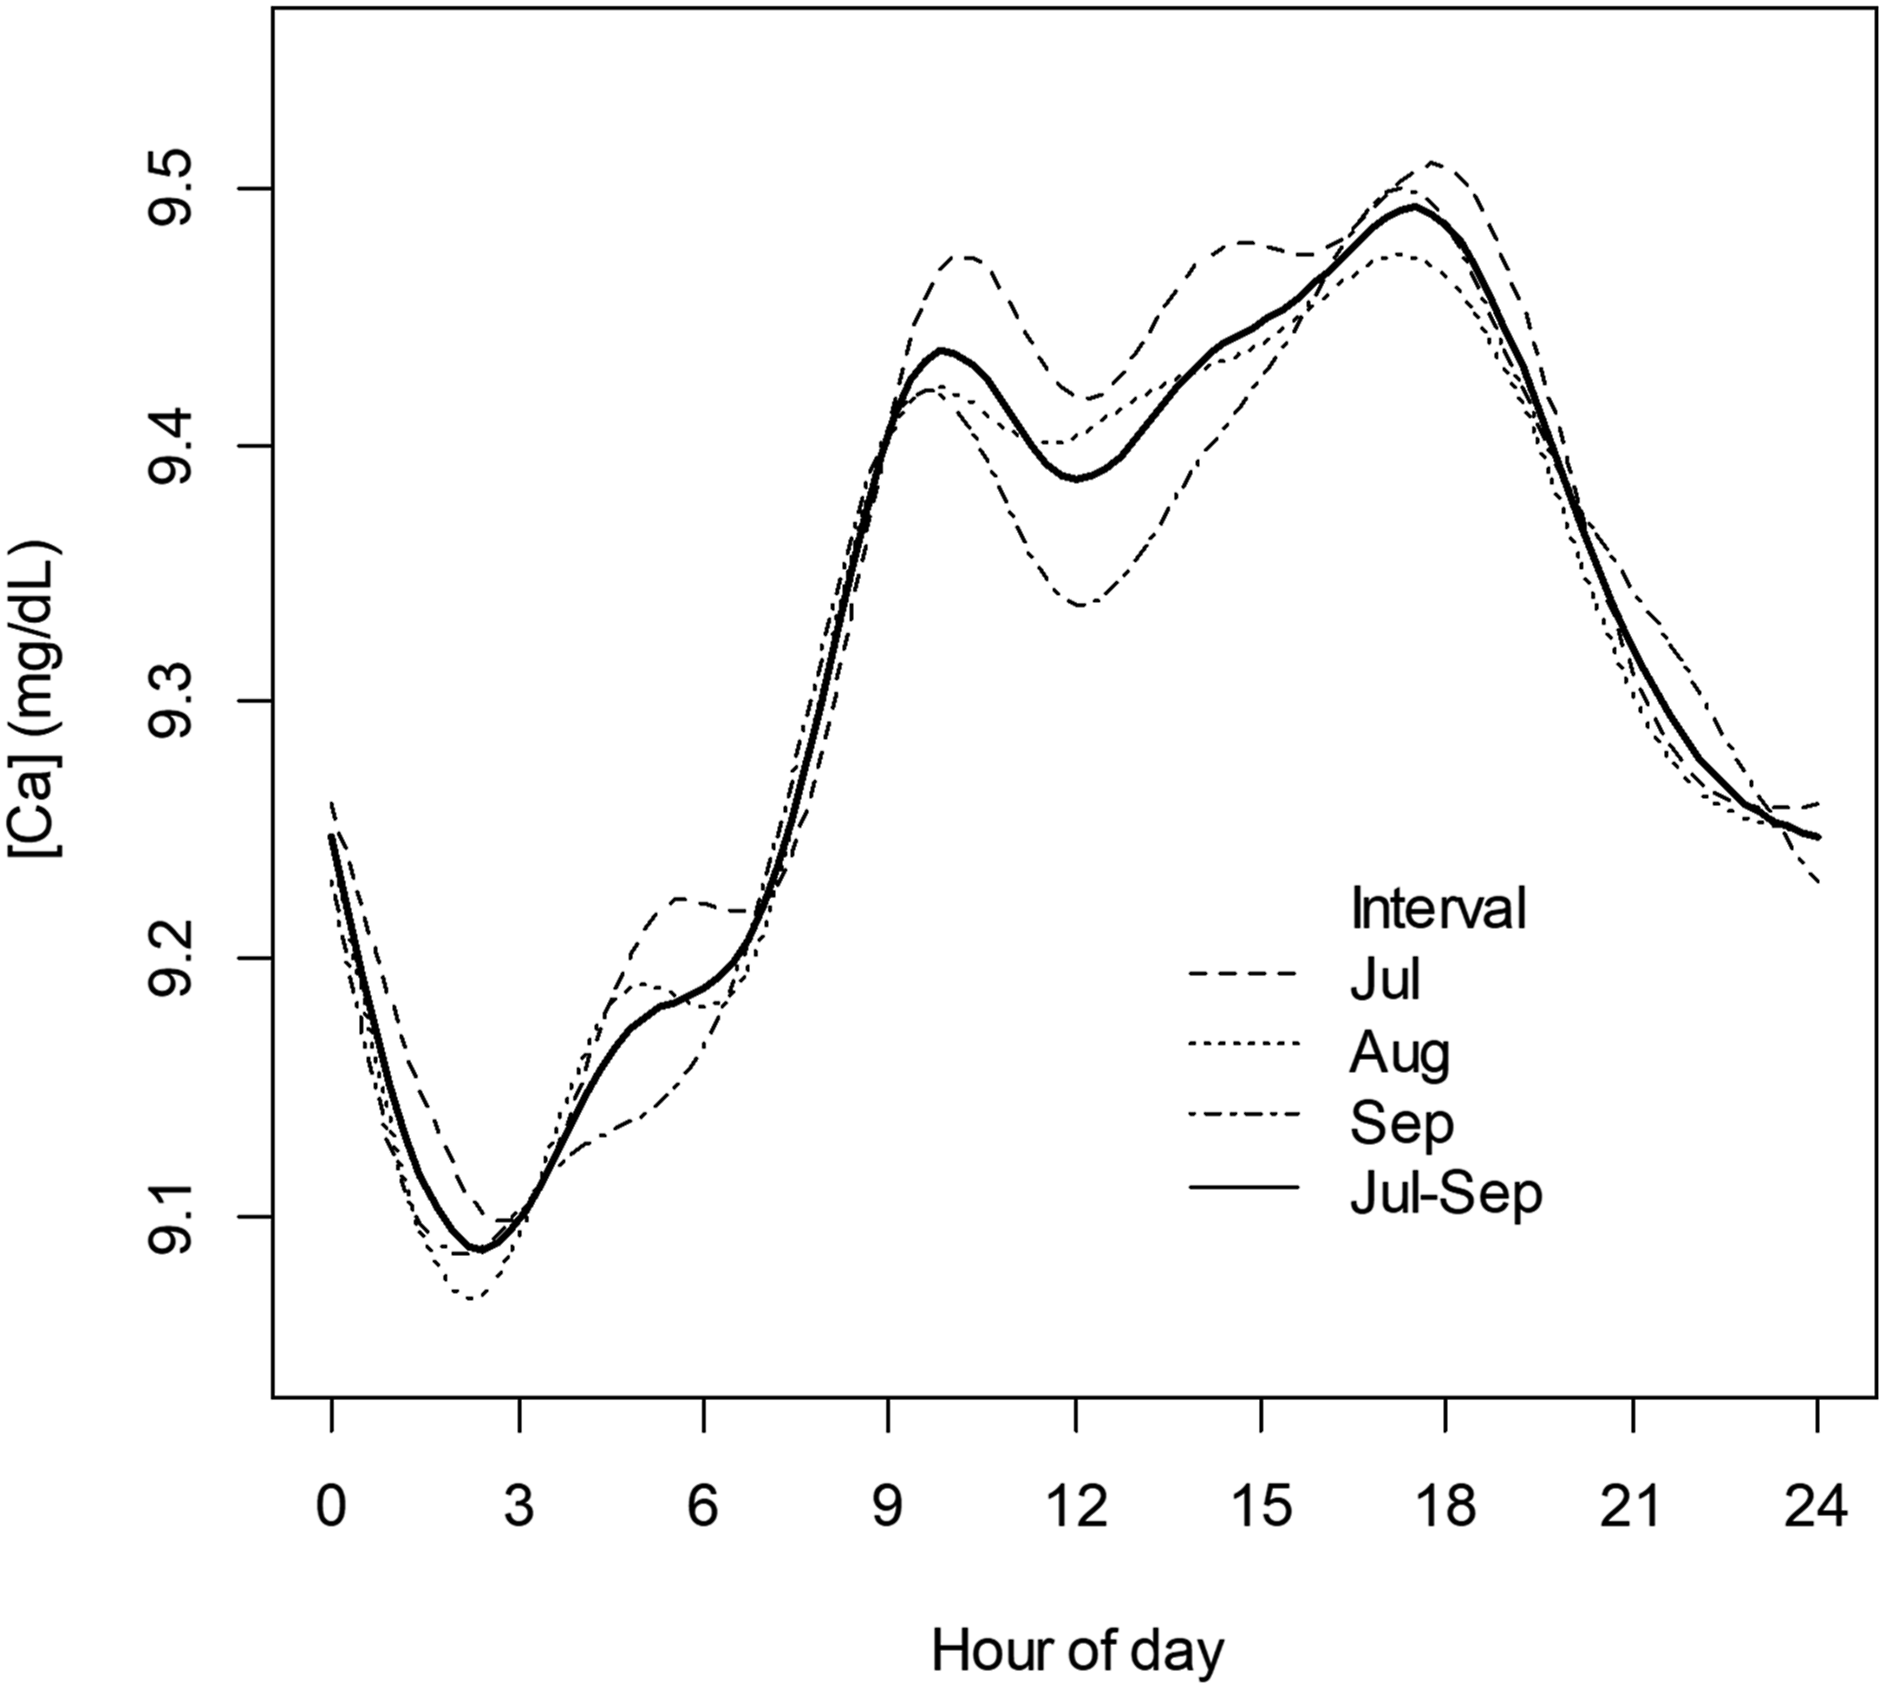
Discussion
Consideration of implementation of PBQC for a given analyte requires assessment of a number of aspects of patient results data.1,2,3,4,5 First is assessment of results frequency, and whether that frequency is high enough to be able to detect systematic error within an interval that is shorter than that used for routine QC sample testing when using a bloc length of n samples. Inclusion criterion for samples used in PBQC must be defined (e.g. samples within the reference interval), as well as stability and characteristics of the comparator used (e.g. mean and SD of the mean, mean and SD of the median). At our institution, assessment of characteristics of Ca for PBQC included the observation that there was a reasonably stable TOD-dependent cyclical variation in the 1-h average Ca and the 1-h average for 20-mers. The scale of the variation was such that average properties of 20-mers used as a fixed, time-invariant PBQC target would be compromising with respect to PBQC objectives. In this case, use of FSS to produce TOD-dependent PBQC targets for 20-mers was shown to normalize PBQC error estimates across time.
Variation in interpatient mean Ca across TOD as shown here appeared to be in part driven by the TOD-dependent IP/OP patient mix, given a distinct difference in distributions of Ca among IP and OP sample submissions. IP/OP mix is not fully explanatory; however, for instance, it does not explain the variation in Ca observed between 00:00 hours and 07:00 hours for data comprised entirely of IP samples. Variation across time of submissions from particular clinical sites might also play a role. Over the 90-day interval of the database, inpatient submissions came from 30 separate sites; for outpatients, submissions came from more than 80 sites. We have not been able to discern an explanatory TOD pattern related to submission sites, however. Some fraction of Ca variation in the dataset may be attributable to second, follow-on measurements for individual patients within a 24-hour interval, within which some form of intervention that could alter Ca had been applied. Variation in average interpatient laboratory results might also to a minor extent be influenced by physiological diurnal variation in Ca.8,9
Our analysis was not ultimately based on any presumption of understanding about the origin of the data cycle, however. The cycle was simply taken as an observed property, with work undertaken to describe how it might be characterized in PBQC. Although we know of no prior presentation of periodic data such as those shown in Figure 2, Badrick et al. 2 have previously discussed the possibility of such circumstances and the challenges that they would represent for PBQC.
As described in Results, our selection of n = 20 for n-mers was not based on a formal process of optimization. There are no fast guidelines for optimization of parameters in PBQC, 7 which can be a very complex process. 10 Approaches to optimization of n for PBQC utilizing ‘average of normals’ have been described by Cembrowski et al. 11
A facet shortcoming in our analysis is that, unlike PBQC in practice, we assessed error using a target (FSS) for the same data from which the target was derived. This was adequate to our primary intent, however, which was simply to provide an example of how cyclical TOD-dependent variation of the PBQC target might be approached. We used Fourier series analysis simply as an example. It is a logical choice, as Fourier series are used in widespread applications to characterize/convert periodic data into a computationally convenient form. 12 In our example, FSS produced a result that can easily be ‘called’ in calculations to generate a predicted target PBQC value for any given clock time. There are numerous alternatives to use of FSS, however. These include simple smoothing algorithms, time series analyses other than FSS, or simple use of bloc averages. In all cases, there would need to be one-off programming to both characterize the periodic pattern and to provide a means to compare incoming y data to predicted (interpolated) y values.
The clock time variation for interpatient average Ca at our institution was known to us as a peculiarity prior to this study, as an ancillary finding in quality assurance reviews. Among high volume analytes typically measured within hospital laboratories, clock time variation in average interpatient results is probably uncommon. We have yet to undertake a systematic survey for clock time variation among analytes at our institution. Where such variation exists, the important assessment is whether the scale of variation – compared to the SD for n-mers – could substantially affect performance characteristics of PBQC when using a fixed target, and, correspondingly, whether use of clock time-dependent targets could be substantially beneficial. Development and implementation of such a strategy would require hands-on access to customize PBQC programming for this purpose.
Footnotes
Declaration of conflicting interests
The author(s) declared no potential conflicts of interest with respect to the research, authorship, and/or publication of this article.
Funding
The author(s) received no financial support for the research, authorship, and/or publication of this article.
Ethical approval
This study was classified as ‘Exempt’ by review of the Institutional Review Board of Jefferson University (#2022–1043).
Guarantor
DFS.
Contributorship
DFS Sole author.