
Abstract
Background
The pre-analytical stabilities of vitamins A, E, K, B1, B2, B6, B12, C, carotenoids and folates in whole blood were studied. The aim of this work was to provide clear and workable pre-analytical procedures specifying optimal delay before freezing for laboratories which perform themselves such analyses or which receive and transfer such specimens to referral laboratories.
Methods
The stability of vitamins was studied in whole blood at room temperature after light exposure up to 24 h (vitamin C), 48 h (vitamins A, E, B1, B2, B6 and carotenoids) and 72 h (vitamins K, B12, red blood cell (RBC) and serum folates). Vitamin C stability after baseline acidification was analysed up to 48 h. Changes observed were compared to a clinical cut-off defined as total change limit based on a combination of analytical performance and within-subject variation.
Results
Clinically and statistically significant changes occurred only in vitamins C (−22.5%), B6 (+9.9%) and serum folates (−16.8%) concentrations after 6, 24 and 48 h, respectively. Vitamins A, E, K, B1, B2, B12, RBC folates and carotenoids showed good stability up to 48 or 72 h. Vitamin C in acidified serum conserved at room temperature appeared unstable. The optimal condition for acidified vitamin C conservation was at less than −20℃.
Conclusion
The majority of vitamins remain stable for up to 48 h. Vitamin C quantification requires serum acidification followed by freezing as soon as possible. Freezing, respectively, within 12 h and 24 h for determination of plasma vitamin B6 and serum folates concentrations is recommended.
Introduction
In clinical biochemistry laboratories, quality is defined as the guarantee that each step in the total testing process is correctly performed to avoid clinical misinterpretation. 1 The pre-analytical phase is one of the most important steps to ensure optimal results as demonstrated by Lippi et al. 2 They reported that pre-analytical errors account for up to 70% of all laboratory errors that occur during collection, handling, preparing and storing specimens. 2 Standardization and monitoring pre-analytical variables are of foremost importance. The requirements of ISO 15189 specify the need to monitor, evaluate and improve all the procedures and processes performed during the pre-analytical phase. 3
Measurements of fat and water-soluble vitamins are mostly requested to monitor variations induced by various conditions such as alcoholism, parenteral nutrition, intestinal malabsorption, renal insufficiency or bariatric surgery. Vitamins are particularly known to be sensitive to numerous chemical and physical factors such as oxidation, high temperature, light, pH and ionic strength. 4 A number of studies evaluated the impact of storage conditions on the quality of results for common biochemical analytes but existing data on the stability of vitamins in whole blood are sparse and somewhat contradictory.4–7 Available studies are dedicated to one or to a few vitamins in heterogeneous conditions including different storage times, temperatures and matrix. Our study has been designed to improve the pre-analytical process performed in our laboratory specialized in nutritional status assessment.
The pre-analytical stability in blood samples before analysis of vitamins A, E, K, B1, B2, B6, B9, B12, C and carotenoids was investigated in order to provide clear and workable procedures for optimal pre-analytical phase conditions. The stability of vitamins was studied in whole blood at room temperature after ambient light exposure. Mean per cent change in vitamin concentration was compared to a relevant clinical cut-off defined as a combination of analytical performance and within-subject variation. Vitamin D was not included in this study because recent data from the literature indicate that it is relatively robust.8,9
Materials and methods
Study design and subjects
Eighteen healthy members of the laboratory staff (7 males and 11 females; age range 20–53 years) were recruited for this study. In order to limit the number of tubes collected for each volunteer, the study was divided into three parts (Figure 1). The main goal of the study was to determine the stability of commonly measured vitamins in whole blood, at room temperature and without light protection. The first part of the study evaluated the stability of vitamins B1, B2, B6, C, A, E and carotenoids up to 48 h except for vitamin C (up to 24 h). The second part of the study assessed the stability of vitamins K, B9 and B12 up to 72 h. Due to the well-known instability of vitamin C at room temperature, we evaluated, in a third complementary part, the stability of vitamin C stabilized with sulphosalicylic acid at baseline as previously described by Flourie et al.
10
Acidified samples for vitamin C at baseline were kept in three conditions: at room temperature, +4℃ and less than −20℃ up to 48 h. For the third part, samples were obtained from a group of 11 of our healthy subjects (nine women and two men; age range: 25–53 years).
Study design. Figure 1 summarizes the three parts of the study illustrating blood collection, sample processing and freezing steps, at various times.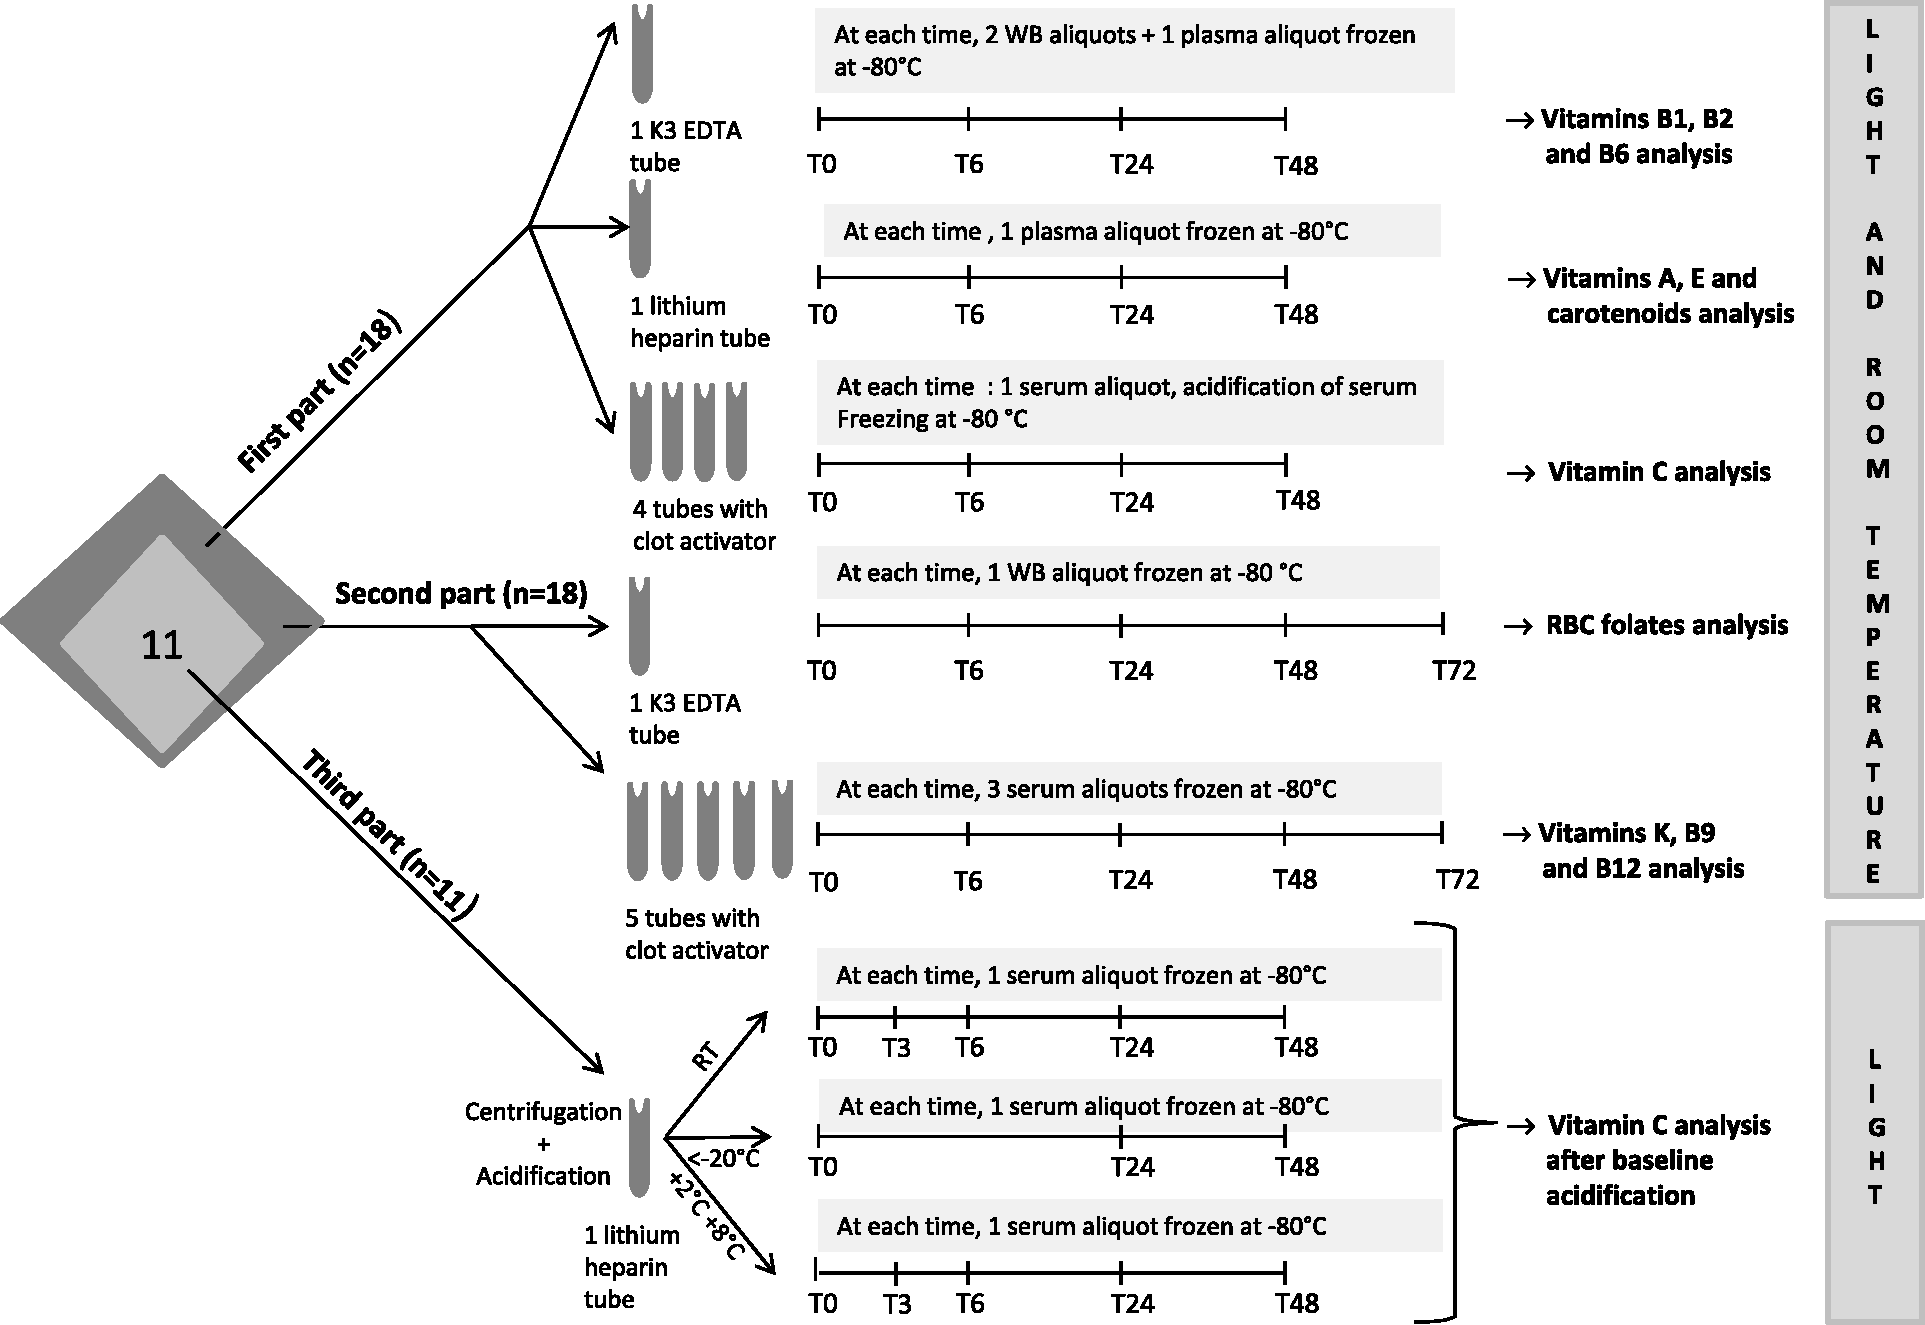
None of the participants had serious or chronic diseases. Subjects did not have a particular dietary regimen, such as a vegetarian or vegan diet. All subjects remained fasting before blood collection.
All participants provided their written informed consent before participating in the study. This study was approved by the Scientific Ethics Committee SUD-EST II and complied with both the ‘Huriet-Serusclat’ law and the Second Declaration of Helsinki.
Sample collection and processing
Blood was collected in Vacutainer™ blood collection tubes (Becton Dickinson BD UK Limited, Oxford, England): Tripotassium EDTA (K3 EDTA) tubes (ref BD 368270) for vitamins B1, B2, B6 and red blood cell (RBC) folates analysis; lithium heparin tubes (ref BD 368496) for vitamins A, E, C and carotenoid analysis; additive clot activator tubes (ref BD 369032) for vitamins B12, C, K and serum folates analysis (Figure 1).
Aliquots of whole blood were kept at room temperature and frozen at less than−80℃ at 0, 6, 24 and 48 h for vitamins B1 and B2 determination and at 0, 6, 24, 48 and 72 h for RBC folates analysis. Aliquots of whole blood were centrifuged (2100 g, 10 min and 4℃) at 0, 6, 24 and 48 h and plasma frozen for vitamins A, E, B6 and carotenoids analysis. Tubes containing additive clot activator were centrifuged at 0, 6, 24, 48 and 72 h for vitamins K, B9 and B12 and serum frozen after centrifugation (Figure 1).
For vitamin C analysis, tubes containing additive clot activator, kept at room temperature, were centrifuged at 0, 3, 6 and 24 h, then serum acidified just before freezing. For analysis of vitamin C acidified at baseline, aliquots of whole blood were centrifuged at baseline and acidified plasma conserved at room temperature, at +4℃ or at less than −20℃ before freezing at less than −80℃ at 0, 3, 6, 24 and 48 h (Figure 1).
Biochemical analysis
Vitamins A, B1, B2, B6, C, E, K and carotenoids were analysed by high-pressure liquid chromatography (HPLC) using a Summit Dionex system (Thermo Fisher Scientific, Courtaboeuf, France) and Chromeleon software (version 6.80, Thermo Fisher Scientific).
The aliquots for each time point and for each volunteer were analysed in one batch by the same technician, to avoid run-to-run variability. To ensure validity of the run, we analysed two levels of internal quality control (IQC) samples at the beginning and the end of each run. All IQC covered at least reference interval values except for vitamin K and for some carotenoids for which IQC did not cover respectively low values or high values of reference intervals. However, linearity and limit of quantification defined for each parameter allowed us to ensure the quality of results. Moreover, our laboratory participated regularly in external quality-assurance programs allowing monitoring of bias and total error.
Vitamins A, E and carotenoids analysis
Briefly, after precipitation of plasma proteins by ethanol, the vitamins were extracted into hexane, evaporated under nitrogen and the dried residue was dissolved in methanol/ethanol (85/15, v/v). The eluate was analysed by HPLC at 292, 325 and 450 nm, respectively, for vitamins E, A and carotenoid measurements. Separation was carried out on an Adsorbosphere HS C18 3 µm (Interchim, Montluçon, France) held at 37℃, using a gradient elution system starting with 100% methanol-acetonitrile (40/60, v/v) and ending with a 100% mixture of methanol-acetonitrile-dichloromethane (46/30/24, v/v) as described by Steghens et al. 11 Two internal standards were used to correct losses during liquid/liquid extraction: tocol for measurement of vitamins A, E, lutein and zeaxanthin; echinenone for measurement of β-cryptoxanthin, lycopene, α-carotene and β-carotene.
Vitamin C analysis
Vitamin C concentration was measured by HPLC with electrochemical detection. Briefly, aliquots of acidified vitamin C were diluted in the mobile phase and injected in the chromatographic system. Chromatography of vitamin C was accomplished using isocratic elution of a BS-C13 column (CIL Cluzeau, Sainte Foy, France) at 37℃. The mobile phase consisted of 12.5% methanol in 12 mmol/L ammonium acetate and 100 µmol/L EDTA, pH 3.8 as described by Flourié et al. 10 No internal standard was used. Neither liquid/liquid nor solid/liquid extractions of vitamin C were performed. Plasma for vitamin C determination was just diluted in mobile phase and acidification solution.
Vitamin K analysis
Vitamin K analysis was conducted using slightly modified method described by Guillaumont et al. 12 Briefly, extraction was performed on 1 mL serum by diethylether/petroleum ether (50/50, v/v) evaporated to dryness and dissolved in 200 µL of n-heptane. Two stages of chromatography were required to eliminate the co-extracted lipids. In the first stage, elution was carried out with n-heptane and ethyl acetate (98.5/1.5, v/v) in a microporo silica column 7.8 × 300 mm (Waters, Saint-Quentin en Yvelines, France). The fraction containing phylloquinone was collected and evaporated to dryness. The residue was dissolved in 100 µL of methanol. Samples were injected in reverse phase in a Symetry column (Waters), using methanol/water/CH3COOH 1 M (99/0.5/0.5) as the mobile phase. Vitamin K1 was detected fluorometrically (λex320–λem430) after post-column reduction in a ZnCl2 column. To correct vitamin K losses with liquid/liquid extraction and after purification, vitamin K1(15) was used as internal standard.
Vitamins B analysis
Vitamins B1 and B2 were quantified in whole blood using two different HPLC Chromsystems reagent kits (Chromsystems Instruments & Chemicals GmbH, München, Germany). Vitamin B6 was quantified in plasma using an HPLC Chromsystems reagent kit. Chromsystems reagent kits for B1, B2 and B6 measurement did not include internal standards for measurement of these three vitamins.
Folic acid and vitamin B12 were determined by the simullTRAC-SNB Radioimmunoassay kit vitamin B12 (57Co)/ Folates (125I) (Diasorin, Antony, France).
Chemical vitamin forms analysed and performance of employed methods
Main characteristics of assays associated for each vitamin with the calculation of total change limit based on the inter-assay coefficient of variation and the within subject variation.
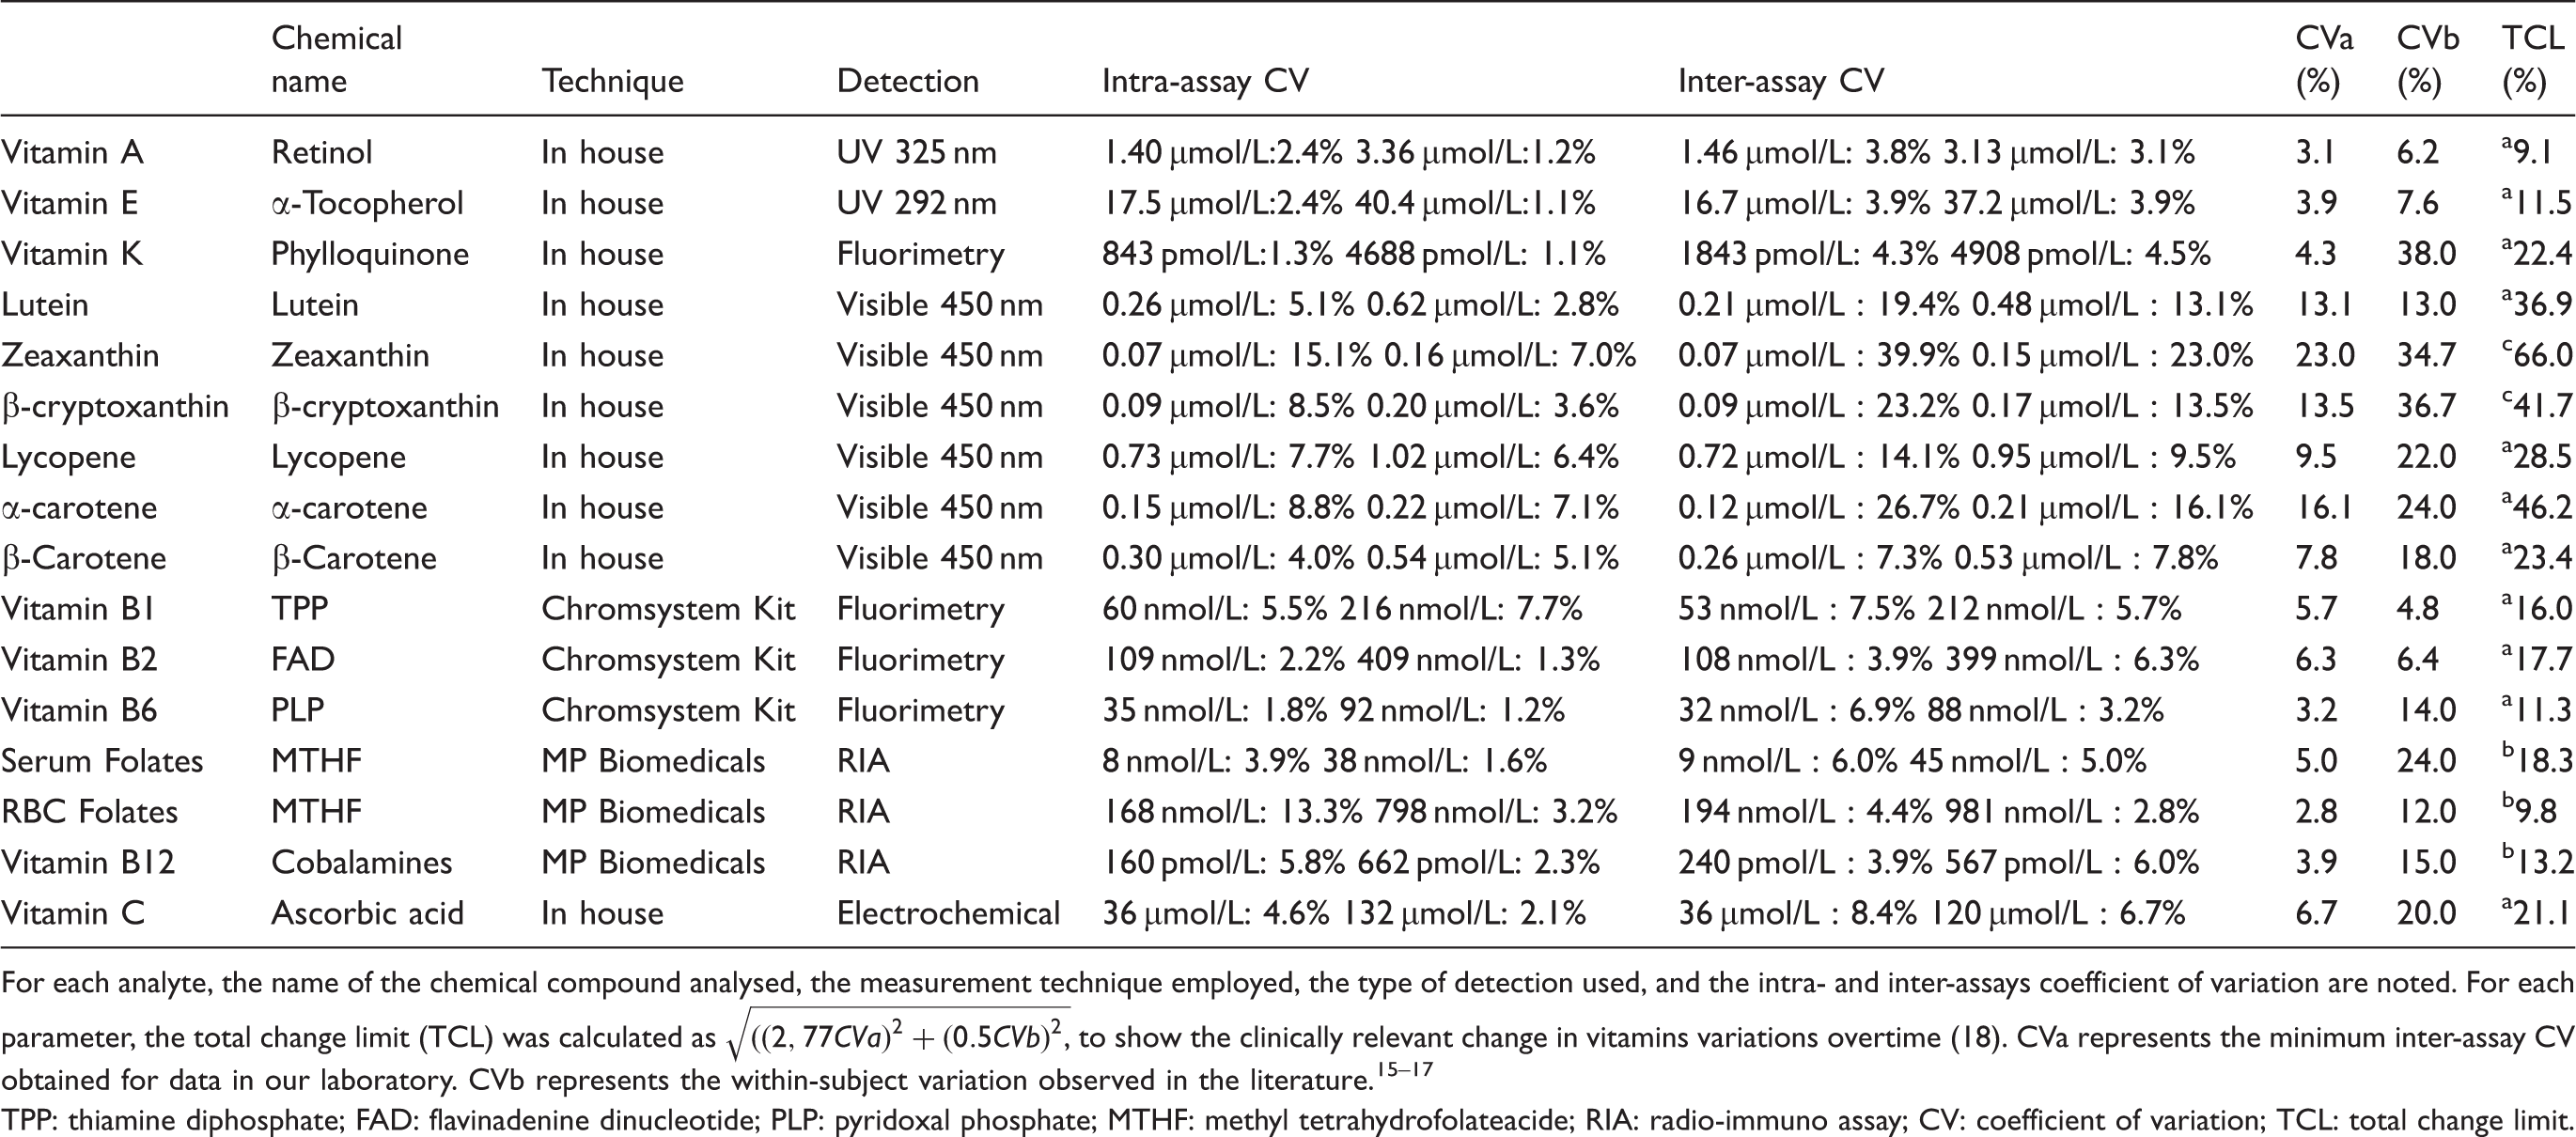
For each analyte, the name of the chemical compound analysed, the measurement technique employed, the type of detection used, and the intra- and inter-assays coefficient of variation are noted. For each parameter, the total change limit (TCL) was calculated as
TPP: thiamine diphosphate; FAD: flavinadenine dinucleotide; PLP: pyridoxal phosphate; MTHF: methyl tetrahydrofolateacide; RIA: radio-immuno assay; CV: coefficient of variation; TCL: total change limit.
Statistical analysis
Statistical analysis has been performed with GraphPad Prism 5 software (version 5.03).
For descriptive statistics, arithmetic means, standard deviations (SD), medians and interquartile ranges were calculated for each analyte at baseline and after delayed freezing.
The changes in time of the concentrations of vitamins were examined using repeated measures ANOVA with a least significant difference test. A p < 0.05 was considered statistically significant. When ANOVA results were statistically significant (p < 0.05), the Wilcoxon test for paired data was used to compare data.
For judging whether the difference between concentrations of these analytes measured at baseline and after delayed separation/freezing was clinically relevant, the total change limit (TCL) was calculated as previously described by Oddoze et al. 18 The TCL was calculated as √ ((2.77 CVa)2 + (0.5 CVb)2) where CVa is the inter-assay CV and CVb the within-subject variation. 18 The analytes were defined as stable if the average change from the baseline value was less than the TCL. CVa for each analyte was obtained from 30 internal quality control results, as advocated in the ISO 15189 requirements. 3 CVb represents the within-subject variation based on data published by Ricos et al.,13,14 Talwar et al., 15 McKinley et al. 16 and Olmedilla et al. 17 (Table 1).
Results
Stability of all vitamins in whole blood
Baseline results for each vitamin and carotenoid.
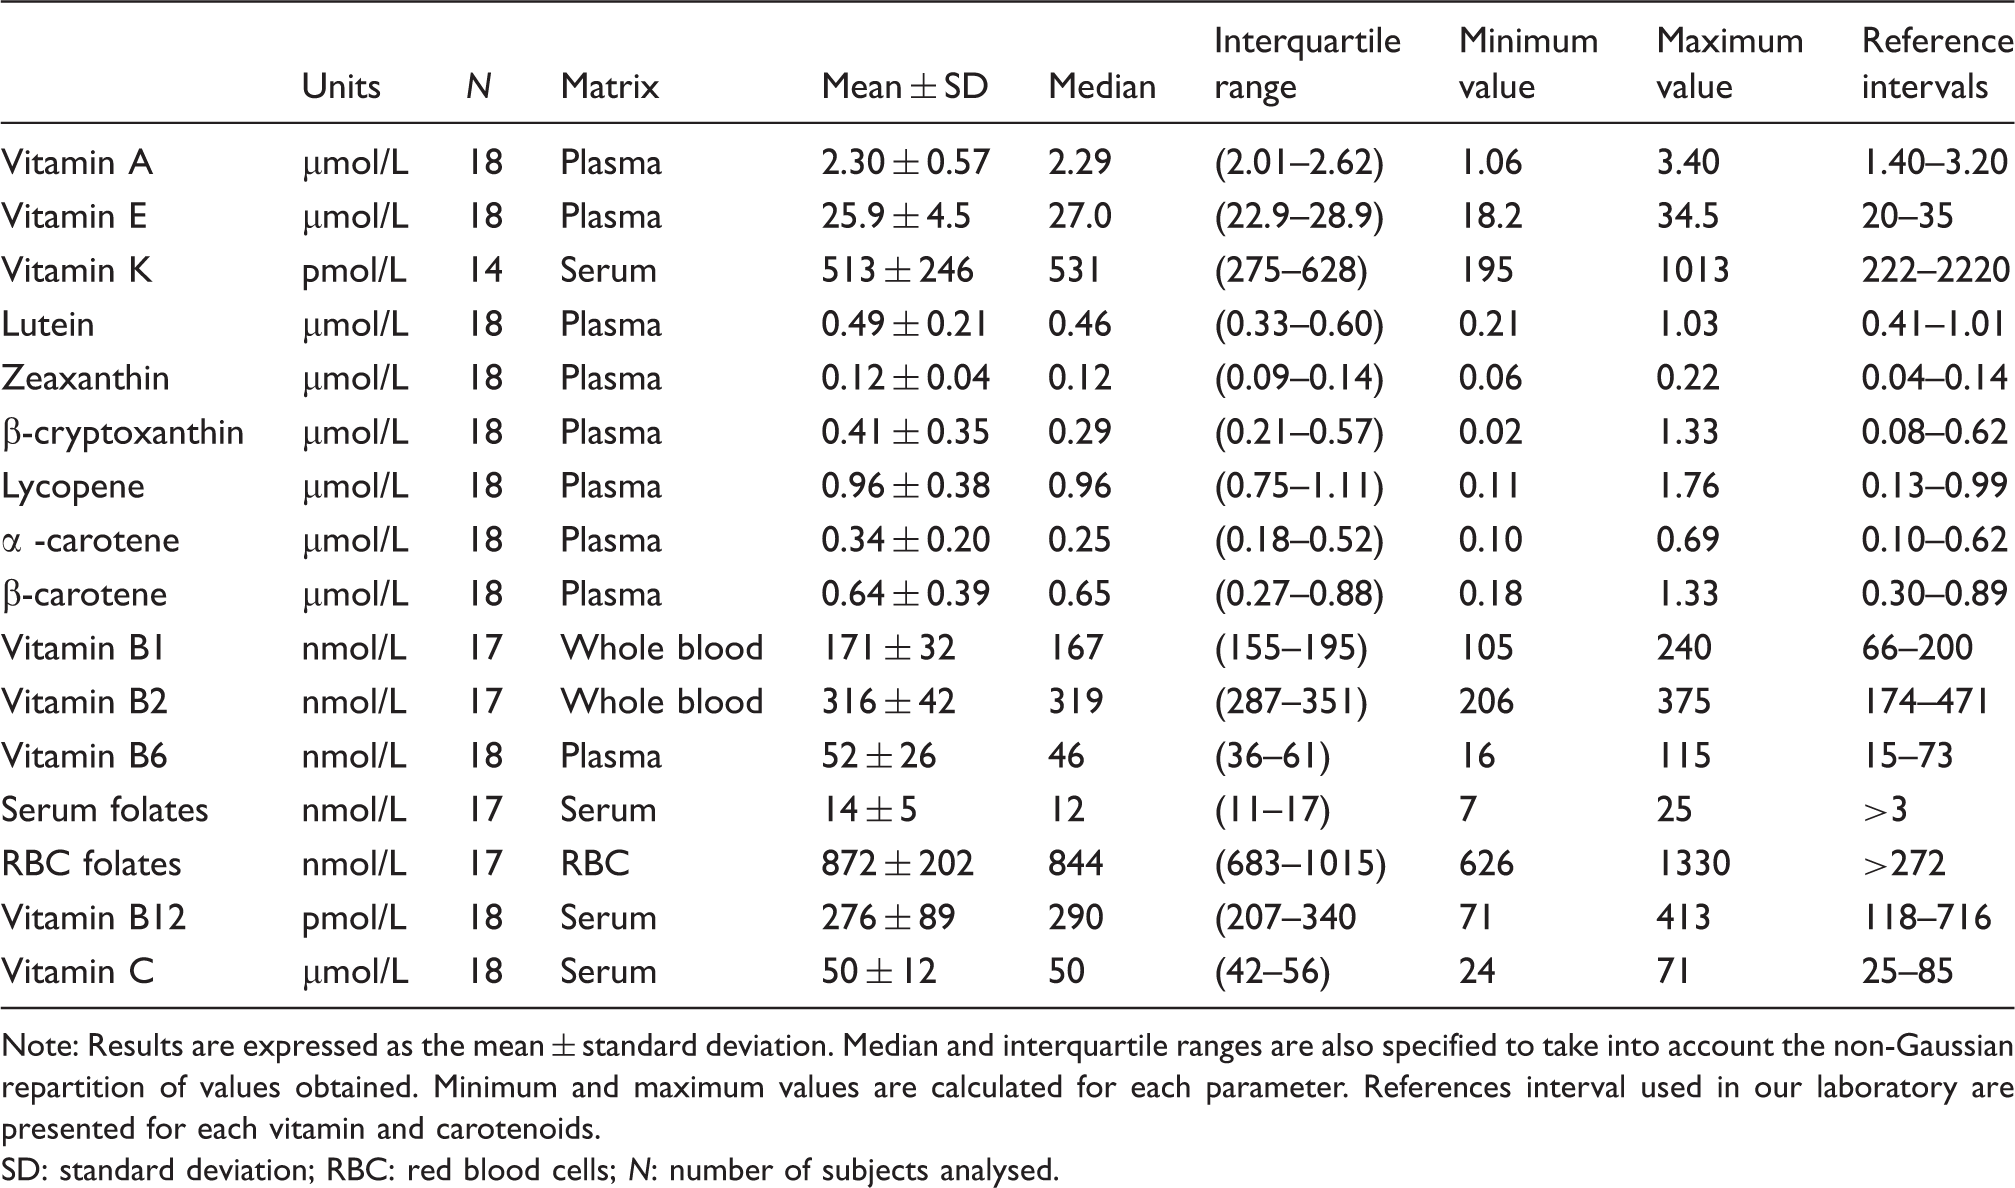
Note: Results are expressed as the mean ± standard deviation. Median and interquartile ranges are also specified to take into account the non-Gaussian repartition of values obtained. Minimum and maximum values are calculated for each parameter. References interval used in our laboratory are presented for each vitamin and carotenoids.
SD: standard deviation; RBC: red blood cells; N: number of subjects analysed.
Stability of vitamins and carotenoids in whole blood.
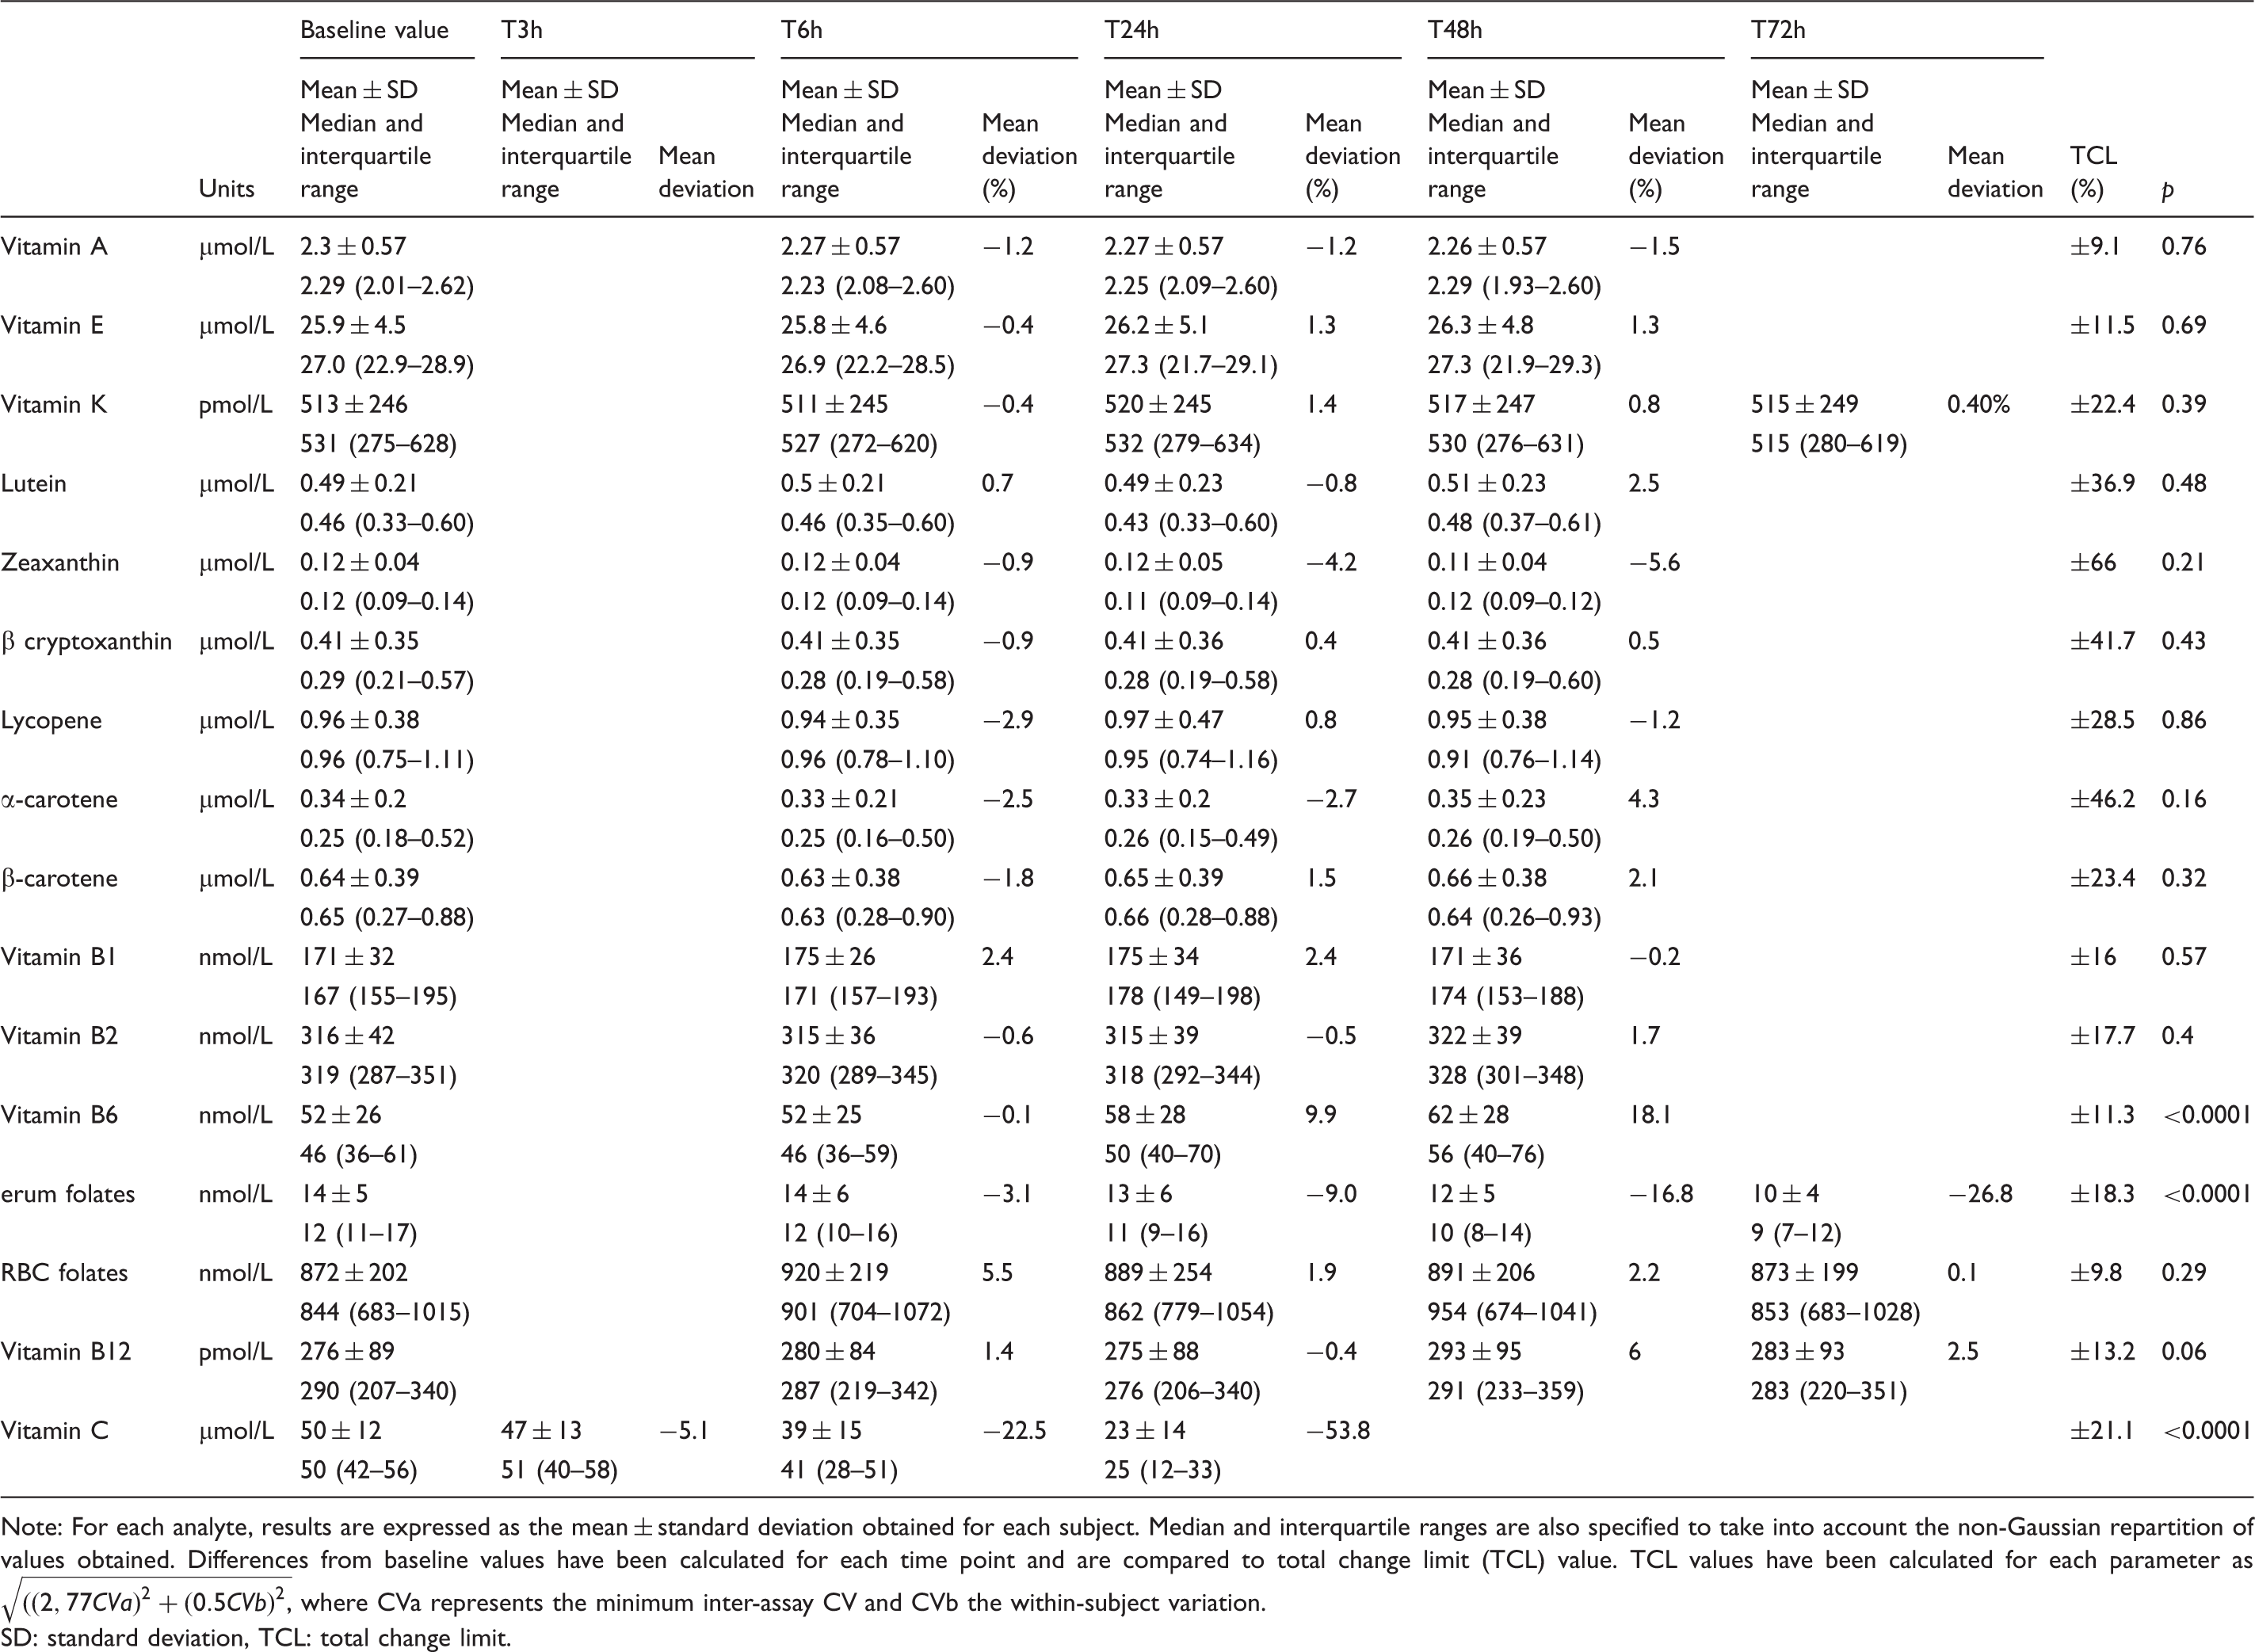
Note: For each analyte, results are expressed as the mean ± standard deviation obtained for each subject. Median and interquartile ranges are also specified to take into account the non-Gaussian repartition of values obtained. Differences from baseline values have been calculated for each time point and are compared to total change limit (TCL) value. TCL values have been calculated for each parameter as
SD: standard deviation, TCL: total change limit.
Vitamin B6 increased gradually over time (52 ± 26, 52 ± 25, 58 ± 28, and 62 ± 28 nmol/L for baseline, T6 h, T24 h, and T48 h respectively; p < 0.0001). To assess whether these statistically significant changes were clinically relevant, the TCL was calculated for vitamin B6 and was found to be 11.3%. When whole blood for vitamin B6 was kept at room temperature and exposed to light, the change observed between baseline and 24 h was statistically significant and exceeded the TCL after 48 h (Table 3).
Serum folates decreased significantly and progressively over time with a maximum decrease of 20% after 72 h (14 ± 5, 14 ± 6, 13 ± 6, 12 ± 5 and 10 ± 4 nmol/L for baseline, T6 h, T24 h, T48 h and T72 h, respectively; p < 0.0001). The difference observed after 72 h of exposure to light and room temperature was clinically relevant when we compared to the TCL calculated at 18.3% for serum vitamin B9 (Table 3).
As expected, vitamin C concentration decreased rapidly after light exposure, at room temperature and without prior acidification (50 ± 12, 47 ± 13, 39 ± 15 and 23 ± 14 µmol/L for baseline, T3 h, T6 h and T24 h, respectively; p < 0.0001). On average, more than 50% of vitamin C had disappeared after 24 h. Data obtained after 6 h showed a 22% decrease, that was clinically relevant compared with a TCL of 21.1% (Table 3).
For these three analytes, the variations observed over time were similar for each subject as shown in Figure 2.
Intra-individual variations of unstable vitamins in whole blood. Intra-individual variations have been explored for each unstable vitamin in whole blood at room temperature after exposure to light. (a) Vitamin B6 stability in whole blood. The histograms represent the mean ± SD concentration for vitamin B6 in 18 healthy volunteers. (b) Intra-individual stability of vitamin B6 in whole blood. Each line represents the evolution of vitamin B6 concentration up to 48 h for one healthy volunteer. (c) Serum folates’ stability in whole blood. The histograms represent the mean ± SD concentration for serum folates in 17 healthy volunteers. (d) Intra-individual stability of serum folates in whole blood. Each line represents the evolution of serum folates concentration up to 72 h for one healthy volunteer. (e) Vitamin C stability in whole blood without any pre-treatment. The histograms represent the mean ± SD concentration for vitamin C in 18 healthy volunteers. (f) Intra-individual stability of vitamin C in whole blood. Each line represents the evolution of vitamin C concentration up to 24 h for one healthy volunteer. Means obtained for each set point are represented on each histogram. NS: Not statistically significant. *p < 0.05.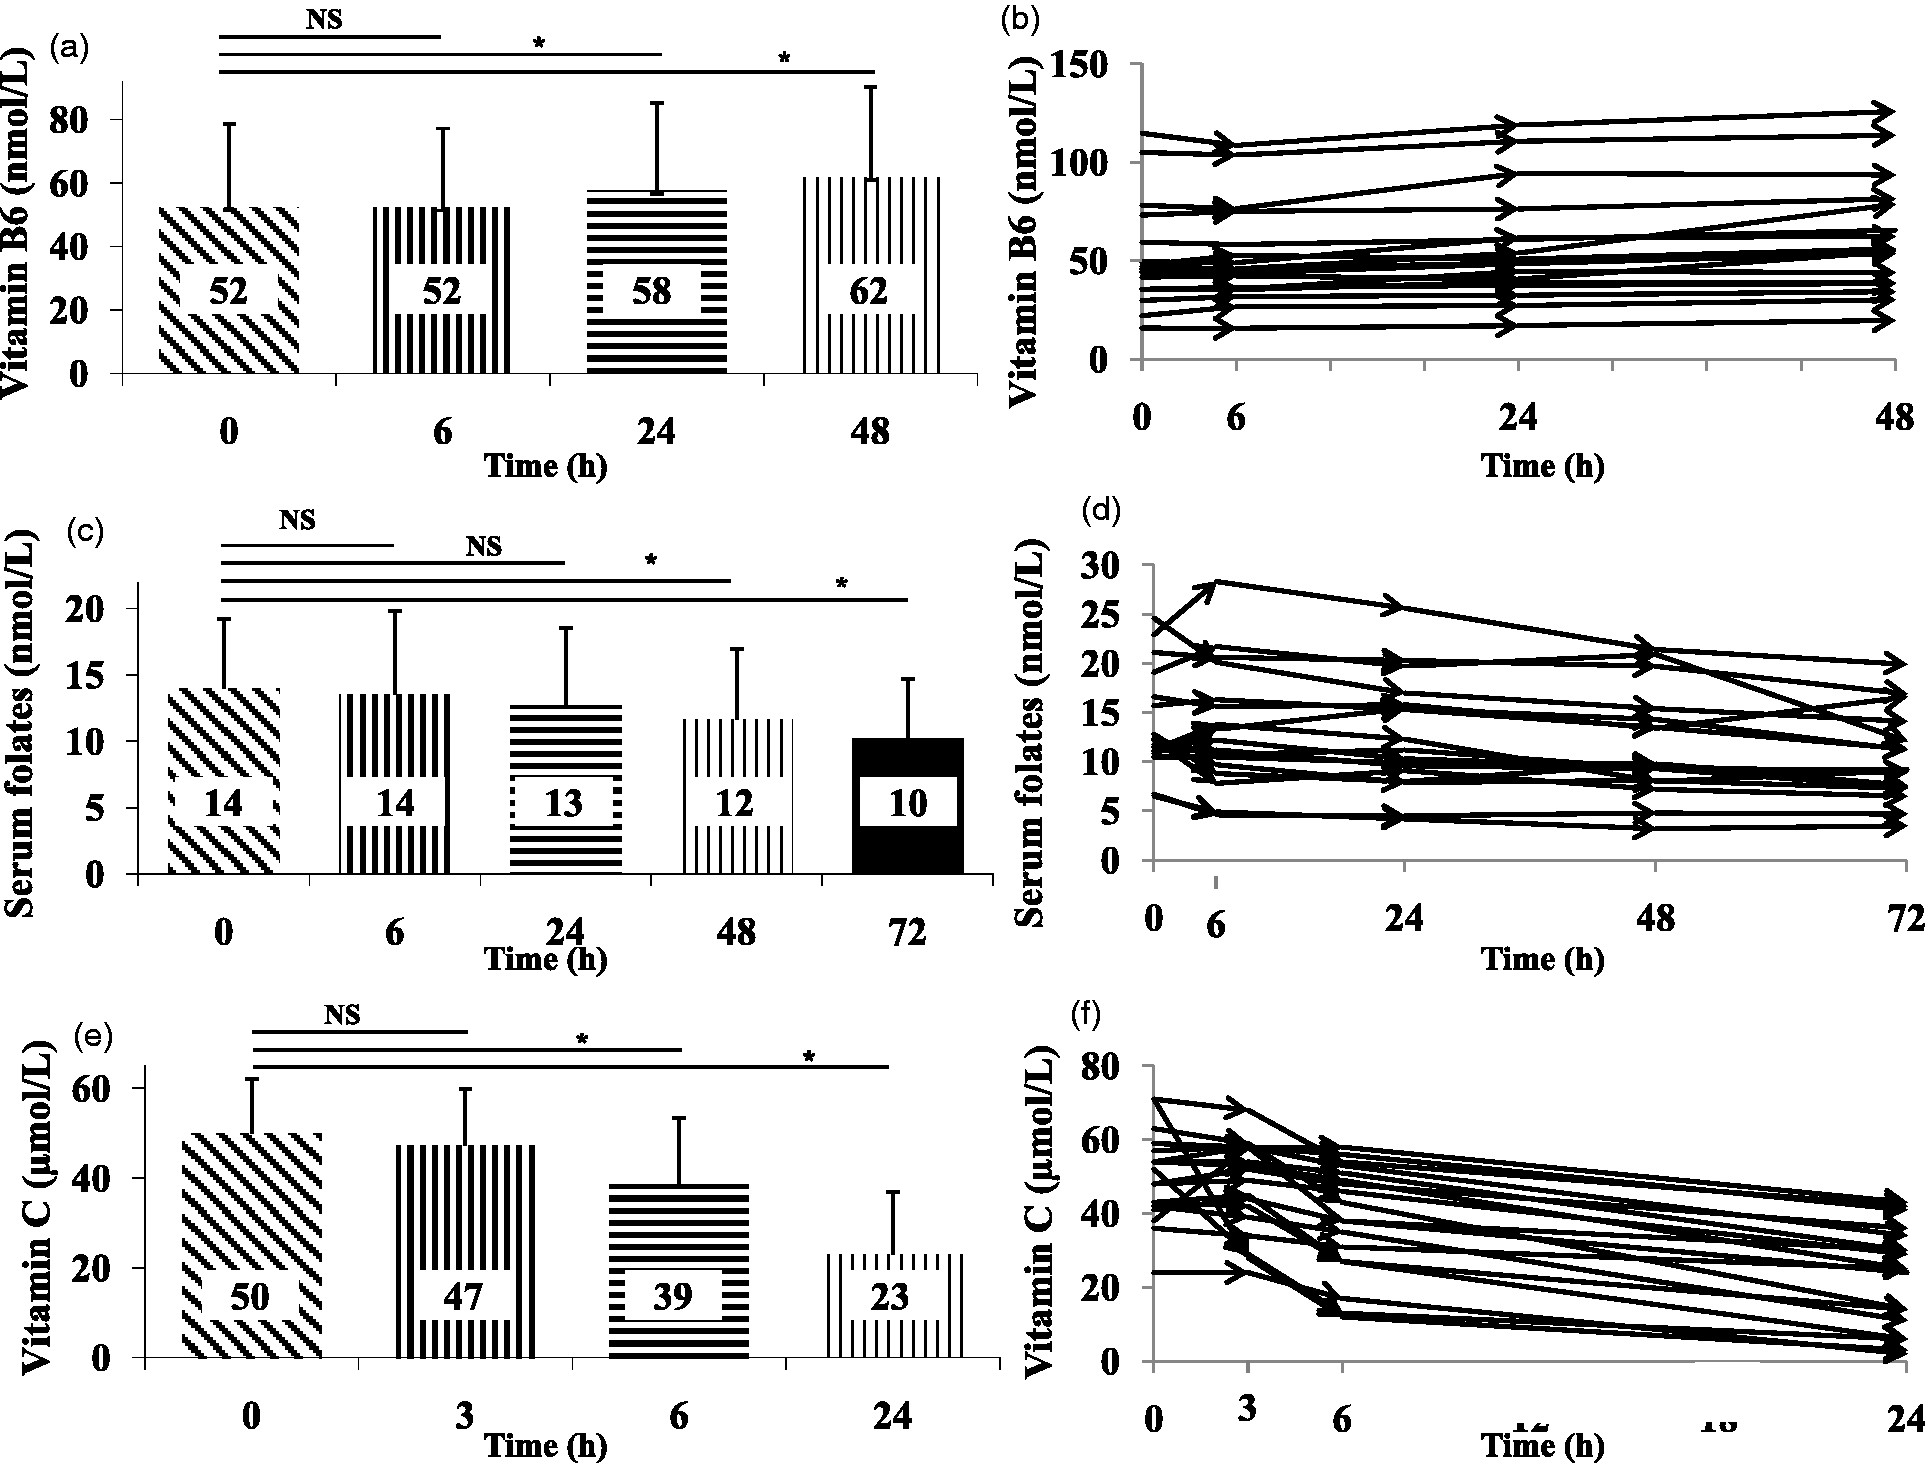
Vitamins A, E, K, B1, B2, B12, RBC folates and carotenoids showed good stability up to 48 h after sample collection in whole blood stored at room temperature and exposed to light. After 48 h, the differences observed were lower than 10% and always below the TCL, demonstrating the stability of these analytes (Table 3).
Stability of vitamin C after baseline sulphosalicylic acidification and exposure at different temperature conditions
Vitamin C stability after baseline acidification at room temperature, +4℃ and less than −20℃.
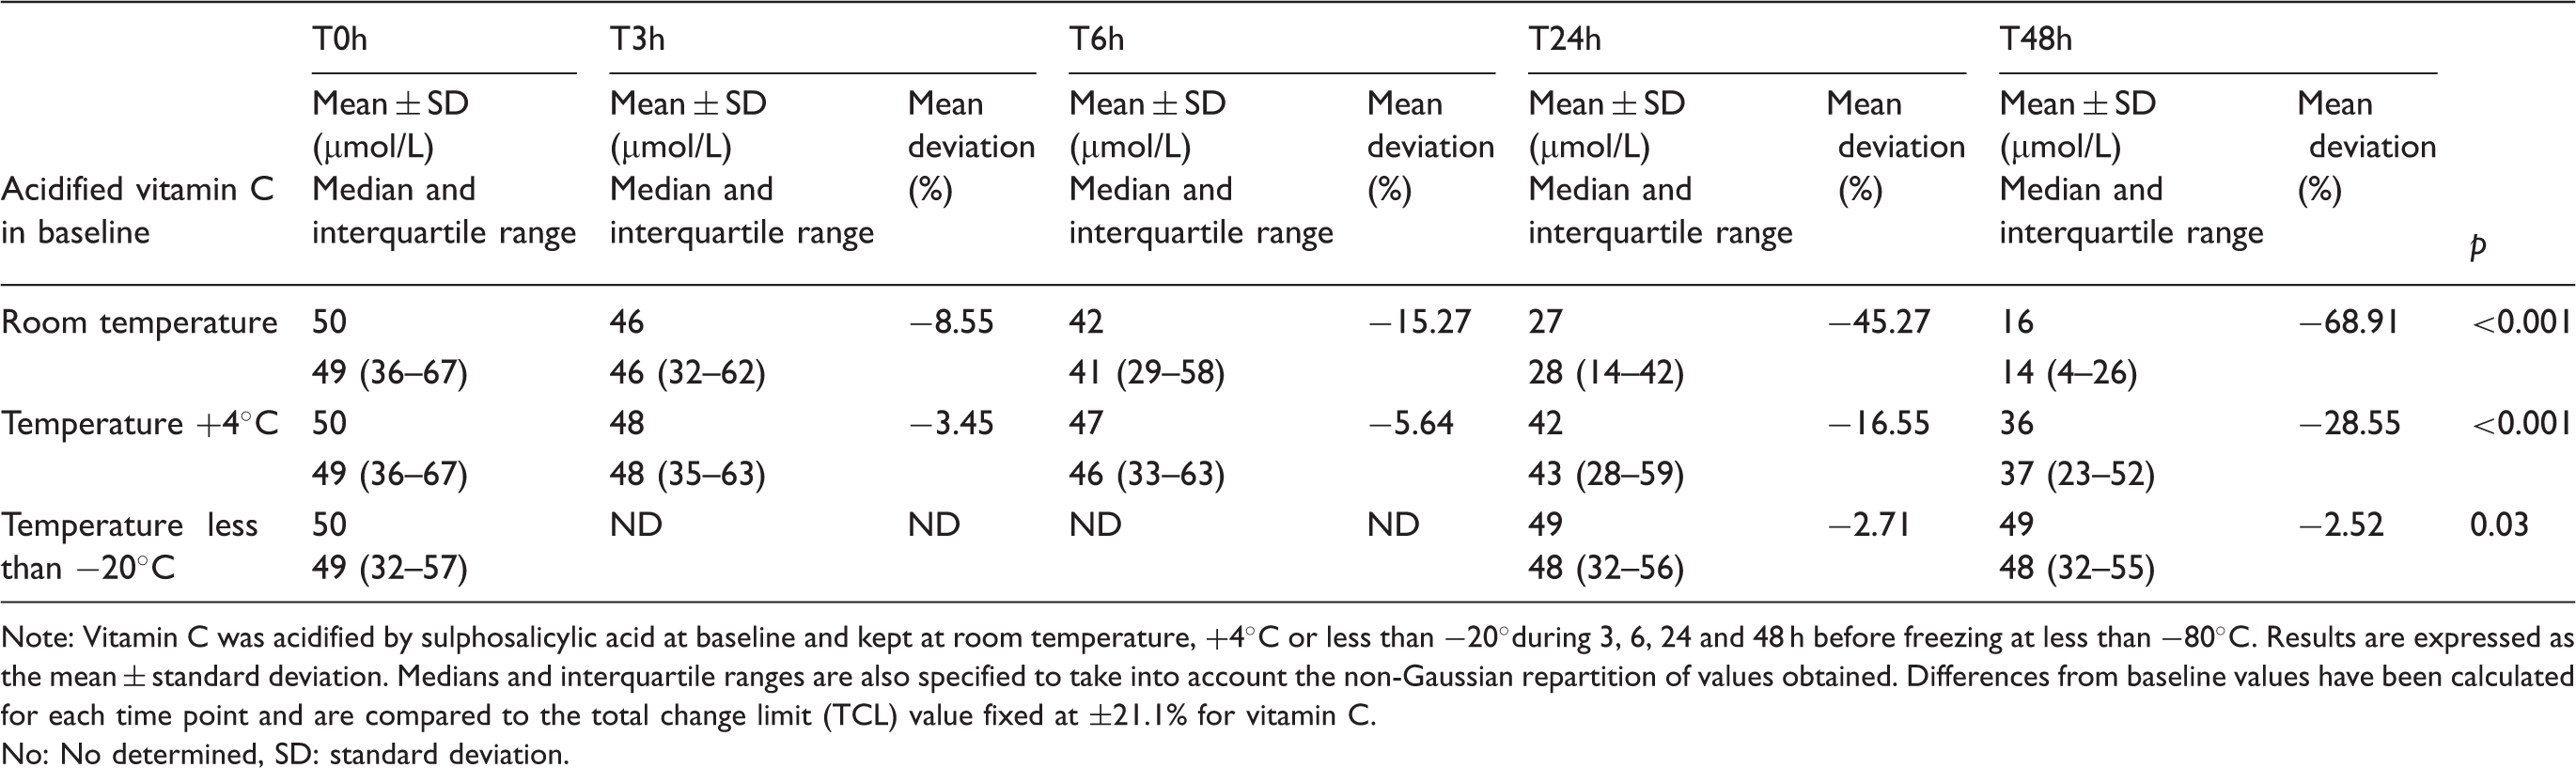
Note: Vitamin C was acidified by sulphosalicylic acid at baseline and kept at room temperature, +4℃ or less than −20°during 3, 6, 24 and 48 h before freezing at less than −80℃. Results are expressed as the mean ± standard deviation. Medians and interquartile ranges are also specified to take into account the non-Gaussian repartition of values obtained. Differences from baseline values have been calculated for each time point and are compared to the total change limit (TCL) value fixed at ±21.1% for vitamin C.
No: No determined, SD: standard deviation.
Discussion
The purpose of this study was to assess whether delayed processing of blood samples could modify vitamin concentrations and possibly cause clinical misinterpretation. To answer this question, the concentration of vitamins in fresh whole blood exposed to ambient light and temperature was determined at different times after phlebotomy. Changes observed were compared to a relevant clinical cut-off defined as the TCL based on analytic and biologic imprecisions. Statistically and clinically significant changes occurred only for vitamins C, B6 and serum folates after 6, 24 and 48 h, respectively.
We demonstrated a significant increase of 18.1% in vitamin B6 concentrations after 48 h. The pre-analytical stability of vitamin B6 in the literature is conflicting. To the best of our knowledge, no study has focused on the stability of vitamin B6 kept in the varying conditions we used. Zwart et al. reported unstability of vitamin B6 24 h after phlebotomy in whole blood maintained in darkness and collected in tubes with clot activator (97 ± 56 vs. 113 ± 72 nmol/L, respectively after, T0 and T24 h (+16.5%). 19 The authors seemed to explain this variation by a decrease in enzymes using vitamin B6 as cofactor. More surprisingly, Hustad et al. reported heterogeneous results when vitamin B6 was collected in different anticoagulant tubes. 5 After eight days, vitamin B6 concentration decreased in serum (−14.8%), heparin (−44.8%) and citrate (−25.6%) plasma whereas it increased in EDTA (+8.9%) plasma, suggesting a matrix effect on vitamin B6 measurement. Inter-conversion of pyridoxal phosphate into pyridoxal seemed to explain results obtained in heparin plasma. 5 Light exposure could also increase instability of vitamin B6, as demonstrated by Talwar et al. who reported more variations in B6 concentration after exposure to light. 20 Finally, as vitamin B6 is known to be partly contained in plasma and red blood cells, we cannot rule out an effect of hemolysis in the increase of plasma vitamin B6 concentration. Data suggesting this phenomenon are presented in supplementary data as a correlation between the hemolysis index and vitamin B6 concentration overtime (Supplementary data 2).
Serum folates appeared to decrease significantly by 26.8% at 72 h, suggesting the instability of folates in serum. These results were in agreement with those described in the literature. After 24 h of exposure to light, at room temperature, the serum folates decreased by 12% if stored in a plastic storage tube. 21 This same percentage of decrease after 24 h at room temperature was also found in another study conducted with light protection. 19 In a more recent study, Oddoze et al. reported a 12.8% and 30.4% decrease in serum folates at 48 and 72 h, respectively, after collection in tubes with clot activator. 18 When whole blood was stored in an extreme condition (32℃), an unacceptable 30% decrease, compared with an accepted change fixed at 12%, was described after one day. 6
As shown by many previous studies, vitamin C maintained at room temperature and exposed to light was dramatically unstable in whole blood.4,22,23 It is well known that vitamin C in plasma or serum is readily oxidized by oxygen, high temperature, light, pH, ionic strength, solvents, oxidizing enzymes and interaction with iron and copper. 4 Results from our work showed a 22.5% decrease after 6 h in whole blood and more than a 50% decrease after 24 h. Stability of vitamin C depended in part on the type of anticoagulant used. As described by Karlsen et al., heparin, EDTA and serum matrix gave the highest baseline concentrations of vitamin C. 4 However, in each matrix, vitamin C concentration decreased rapidly and the more stable matrix seemed to be heparin as the authors reported a loss of less than 5% at 3 h in whole blood. These data seemed to be confirmed by Ching et al., who demonstrated a loss of vitamin C after 2 h of 12%, 15% and 36%, respectively, in heparin plasma, serum and EDTA plasma separated from red blood cells. 22 However, to reduce vitamin C degradation, it was necessary to preserve vitamin C in its reduced form. 24 Acidification seemed to be the gold standard in all laboratory practices. 24 In our study, acidification with sulphosalicylic acid at baseline reduced the instability of vitamin C. However, the temperature of conservation after acidification played a critical role, as demonstrated in our study (−15% vs. −6% after 6 h, room temperature vs. +4℃; −45% vs. −17% after 24 h, room temperature vs. +4℃). Indeed, only freezing acidified samples was an adequate process to maintain the baseline concentration of vitamin C overtime. These data were in accordance with those of Karlsen et al., who reported more stability of vitamin C acidified by metaphosphoric acid and storage at +4℃. 4 The 10% loss of vitamin C after 72 h of conservation of acidified plasma at +4℃ suggested the need to freeze the sample to maintain the baseline concentration. 4
The present study demonstrates that vitamins A, E and carotenoids can be measured reliably in whole-blood samples kept at room temperature after light exposure for at least 48 h before plasma separation. Retinol has been reported to be stable: (i) for a maximum of 48 h at 32℃ by Drammeh et al. (decrease by 10% after 72 h, above their TCL of 3.4%) 6 and (ii) up to 96 h by van Eijsden et al. 25 and Clark et al. 7 at room temperature. Only Hankinson et al. reported an 11% decrease of retinol when stored 48 h in whole blood collected in EDTA anticoagulant at room temperature. 26 Alpha-tocopherol was described as remarkably stable for at least three days at room temperature.6,7,26 Carotenoids have also been reported to be stable (i) for three days at 32℃ 6 and (ii) for seven days at room temperature according to Clark et al. 7 Conflicting results have been reported by Hankinson et al. who found a 16% decrease of β-carotene after 48 h storage of whole blood at room temperature. 26
To our knowledge, there is no data in the literature concerning the stability of vitamin K in whole blood.
Vitamins B1 and B2 were also shown to be stable for at least 48 h at room temperature in whole blood collected in tubes containing K3 EDTA. These data were in agreement with stability data previously reported. Indeed, Talwar et al. demonstrated that vitamin B1 in whole blood kept at room temperature was stable for up to 48 h. 27 Hustad et al. demonstrated that vitamin B2 as flavine adenine dinucleotide was stable for at least eight days in EDTA plasma at 23℃. 5
Finally, no statistically significant changes were observed for vitamin B12 and RBC folates kept at room temperature and exposed to light for at least 72 h. These observations were consistent with those reported by many authors that vitamin B12 was stable for up to 72 h.6,18 One study described the stability of RBC folates up to 24 h at room temperature followed by an unexpected increase in RBC folates between 24 and 72 h whereas degradation should have been expected. 28 At +4℃, RBC folates were stable in whole blood for up to 72 h. 28
Conclusion
Although the shortest possible time between phlebotomy and processing is always the best lab practice, we showed that many vitamins remained stable for up to 48 h in the whole blood at room temperature. Samples for determination of vitamins A, E, K, B1, B2, B12, RBC folates and carotenoids are stable in whole blood for at least 48 h after collection without special precautions for light or temperature. In contrast, tubes for vitamin C quantification require acidification followed by freezing, which must be done as soon as possible after arrival at the laboratory (less than 3 h) to ensure a reliable assay. Freezing within 12 h for determination of plasma vitamin B6 and 24 h for determination of serum folates is recommended.
This work was conducted in healthy subjects. Studies are necessary to define the pre-analytical stability of these vitamins in whole blood collected from hospitalized patients, who may be malnourished or with high oxidative stress.
Footnotes
Acknowledgments
We wish to thank all the volunteers and the technical staff members particularly Stéphane Billon, Pascale Calmard, Sylvie Coste, Elodie Deckert, Jérôme Guichard, Catherine Lisito, Christine Monnet, Joël Rivière, Evelyne Valette and Bruno Vignal.
Declaration of conflicting interests
None.
Funding
This study did not receive any grant support.
Ethical approval
All participants provided their written informed consent before participating in the study. This study was approved by the Scientific Ethics Committee SUD-EST II and complied with both the ‘Huriet-Serusclat’ law and the Second Declaration of Helsinki.
Guarantor
EB.
Contributorship
CC participated in the collection and the analysis of the data, and in the discussion of results and the writing of the manuscript. NP participated in the discussion of results and in the revision of the manuscript. KC participated in the collection and the analysis of data and in the revision of the manuscript. AM participated in the revision of the manuscript. MG participated in the elaboration of the design experiment and in the provision of significant advice. JD participated in the discussion of results. EB participated in the collection and the analysis of data, the discussion of results and the writing of the manuscript. All authors read and approved the final manuscript.
References
Supplementary Material
Please find the following supplemental material available below.
For Open Access articles published under a Creative Commons License, all supplemental material carries the same license as the article it is associated with.
For non-Open Access articles published, all supplemental material carries a non-exclusive license, and permission requests for re-use of supplemental material or any part of supplemental material shall be sent directly to the copyright owner as specified in the copyright notice associated with the article.