
Abstract
Background
Immune checkpoints are involved in mechanisms by which tumours escape from the host immune system. Our aim was to evaluate acute myeloid leukaemia (AML) patients to determine expression levels of checkpoint molecules according to diagnosis and treatments, and to identify optimal candidates for checkpoint blockade.
Methods
Bone marrow (BM) samples were obtained from 279 AML patients at different disease status and from 23 controls. Flow cytometric analyses of PD-1 and PD-L1/PD-L2 expression were performed.
Results
Programmed death-1 (PD-1) expression levels on CD8+ T-cells at AML diagnosis were increased compared to controls. PD-L1 and PD-L2 expression levels on leukaemic cells at diagnosis were significantly higher in secondary AML than in de novo AML. PD-1 levels on CD8+ and CD4+ T-cells after allo-SCT were significantly higher than those at diagnosis and after CTx. PD-1 expression on CD8+ T-cells increased in the acute GVHD group than in the non-GVHD group. The overall survival of patients with high PD-1 expression on CD8+ T-cells was significantly shorter than that of patients with low PD-1 expression.
Conclusions
In conclusion, patients who underwent allo-SCT exhibited high PD-1 expression, suggesting that allo-SCT increases PD-1 expression on T-cells, and the patients with high PD-1 expression on CD8+ T-cells after allo-SCT showed the poor prognosis. For these patients, PD-1 blockade could be an immunotherapeutic strategy.
Introduction
Tumours in humans have developed a number of strategies to escape from the host immune system. One of the recently identified mechanisms of immune suppression operating in cancer involves immune checkpoints. 1 Immune checkpoints are regulatory pathways induced in activated T-cells that regulate the amplitude as well as the quality of T-cell antigen responses. These pathways are balanced by co-stimulatory and inhibitory signals and are important in preventing uncontrolled T-cell activation and autoimmunity. However, cancerous cells have developed ways to utilize these immune cell-intrinsic checkpoints to escape immune-mediated destruction. 2 In the cancer setting, chronic overexpression of checkpoint molecules results in T-cell dysfunction and impairs anti-tumour immunity. 3 The programmed death-1 (PD-1) receptor is one of the most actively studied inhibitory receptors expressed by activated T-cells.
PD-1 plays a critical role in T-cell regulation in various immune responses and is involved in peripheral tolerance, autoimmunity, infection, and anti-tumour immunity. 4 Increased PD-1 expression on CD8+ T-cells in chronic viral infections has been recognized as a hallmark for T-cell exhaustion resulting in reduced cytokine production, proliferation, and cytolytic activity upon antigen re-stimulation. 5 PD-1 binds to two ligands, namely, PD-L1 and PD-L2. PD-L1 molecules on tumour cells can deliver negative signals to tumour reactive cytotoxic T-lymphocytes (CTLs) via the PD-1 receptor, thereby suppressing anti-tumour immunity. 6
The PD-1/PD-L1 pathway plays a role in immune evasion and cytotoxic T-cell exhaustion in haematologic malignancies, including acute myeloid leukaemia (AML), and may be associated with disease progression.7–12 A previous study showed that elevated PD-1/PD-L1 expression significantly blunted the anti-leukaemic effects of CD8+ CTLs in murine AML models. 7 Anti-PD-1 and/or anti-PD-L1 antibodies prevented CD8+ T-cell ‘exhaustion’, resulting in decreased AML burden in the blood and other organs and increased murine survival. 7 Additionally, PD-1 positive T-cells were shown to be significantly increased in the bone marrow (BM) aspirates from patients with relapsed AML compared with those from healthy adult donors, with some groups describing the most significant increase in PD-1 expression on T-cells at relapse after allogeneic stem cell transplantation (allo-SCT).9,13
However, studies on PD-1 in AML are rare, especially in patients receiving allo-SCT, and limited data are available from a large number of AML patients. Therefore, our aim was to evaluate a large number of AML patients to determine the expression levels of PD-1 molecules according to AML diagnosis and treatments. In addition, we analysed both PD-1 expression patterns and dynamics according to the clinical course of AML patients and identified optimal candidates for checkpoint blockade therapy in AML patients.
Methods
Bone marrow specimens and study populations
During 11 months, 279 BM samples were collected from AML patients. These samples included 97 specimens at the time of AML diagnosis and 182 specimens after the diagnosis (follow-up). Among the follow-up samples, 98 samples were obtained from patients receiving chemotherapy (CTx) and 84 samples from patients receiving allo-SCT. According to their treatment response, patients who received CTx were classified as complete remission (CR), persistence, and relapse. Patients with allo-SCT were divided into normocellular marrow with trilineage regeneration (NMTR), persistence, and relapse. For controls, BM samples were collected from 23 patients with no evidence of haematologic malignancies.
Patient demographic profiles (age and sex), clinical characteristics (diagnosis, treatment, disease status, graft-versus-host disease [GVHD], survival), and laboratory data (percentage of blasts, white blood cell [WBC] count, haemoglobin [Hb], and platelets) were obtained through an electronic medical record review.
In the AML cases, the detailed informations about regimen for chemotherapeutic protocols and allogeneic haematopoietic cell transplantation used in our study are represented in the previous literatures.14,15
Clinical characteristics and laboratory findings in acute myeloid leukaemia patients.
Abbreviations: n, number; CTx, chemotherapy; allo-SCT, allogenic haematopoietic stem cell transplantation; M, male; F, female; BM, bone marrow; WBC, white blood cell; AML, acute myeloid leukaemia; MDS, myelodysplastic syndrome; MPN, myeloproliferative neoplasm; GA, genetic abnormalities; MRC, myelodysplasia-related changes; t-AML, therapy-related AML; NOS, not otherwise specified; CR, complete remission; NMTR, normocellular marrow with trilineage regenerations; PD-1, programmed death-1; mcf, mean channel fluorescences.
a p-value, chi-square test or Mann–Whitney U test between CTx and allo-SCT groups.
This study was approved by the institutional review board of the Asan Medical Center (approval number: 20161087) and was performed in accordance with the Declaration of Helsinki.
Immunofluorescence staining and flow cytometric analysis
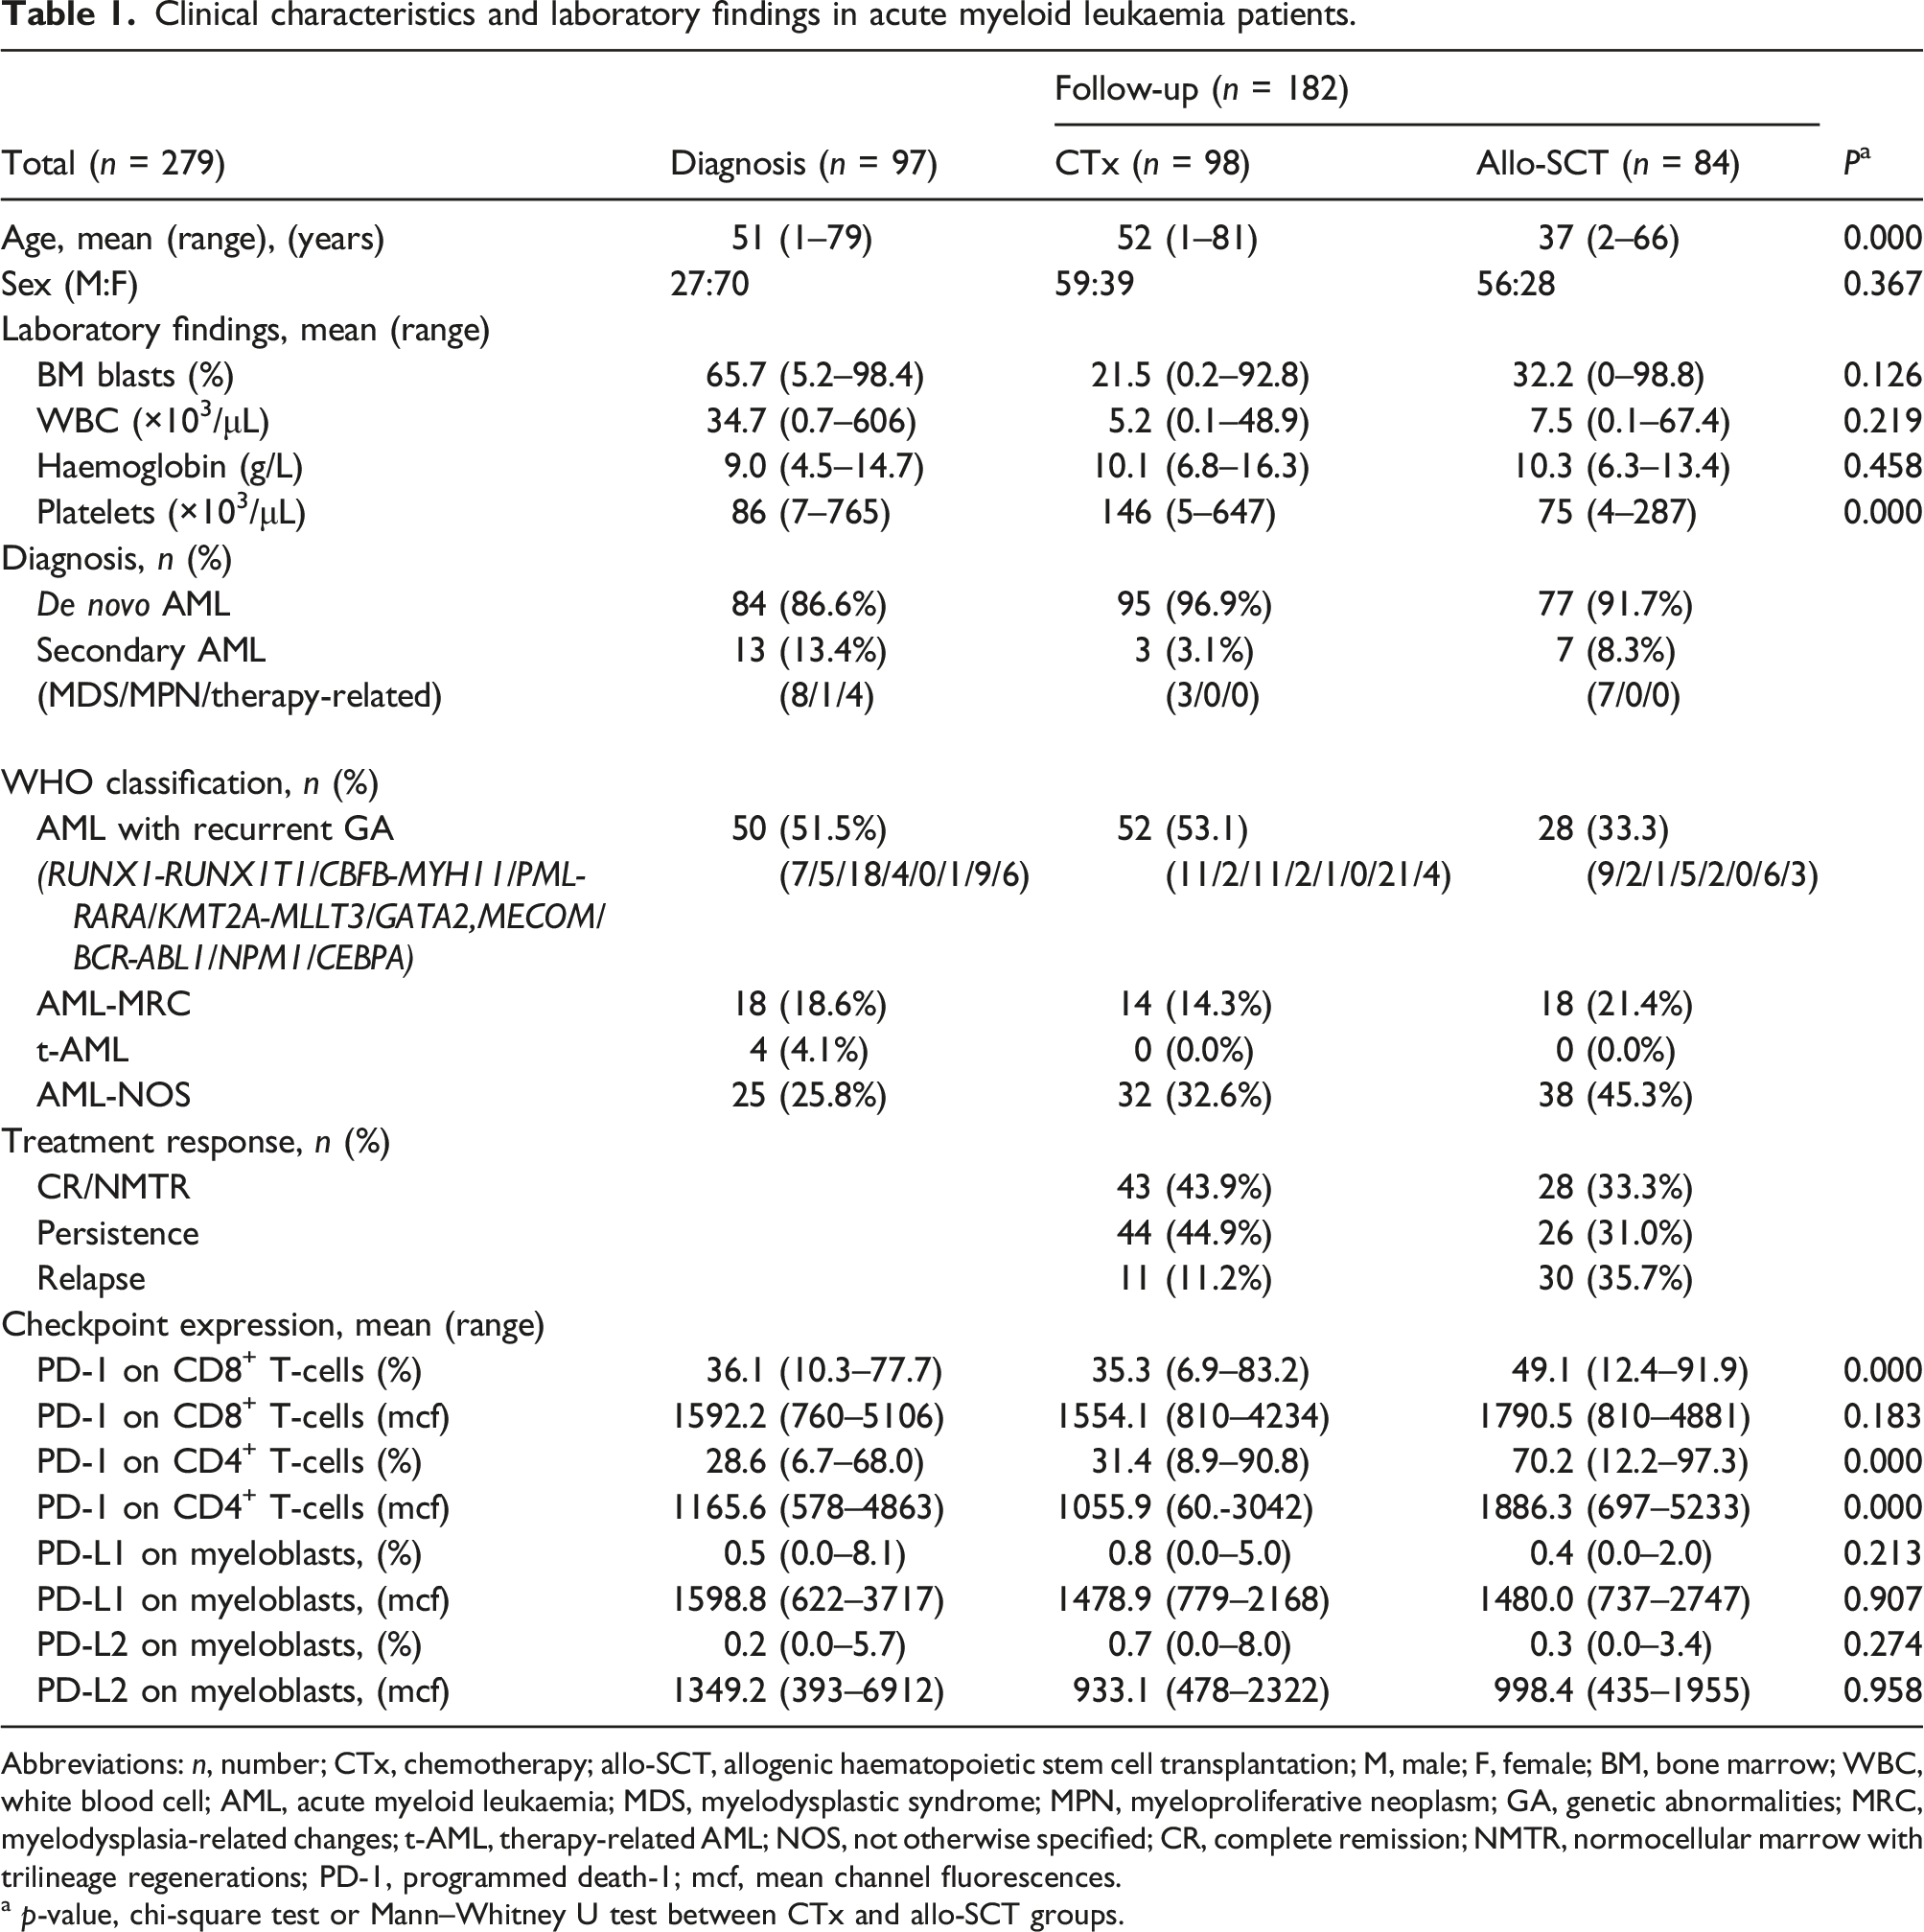
Flow cytometry analysis of PD-1 expression on CD8+ and CD4+ T-cells, and PD-L1/PD-L2 expression on CD13+ and/or CD33+ myeloblasts with CD45 negative to intermediate expression, was performed with three tubes by means of a BD FAC SCanto™ II flow cytometer and BD CellQuest™ Pro Analysis software (BD Biosciences, San Jose, CA, USA) (Figure 1). One tube contained PE-conjugated anti-PD-1, APC-Cy7-cojugated anti-CD3, APC-conjugated anti-CD4, FITC-conjugated anti-CD8, and PerCP-conjugated anti-CD45 antibodies. The second tube contained FITC-conjugated anti-PD-L1, APC-conjugated anti-PD-L2, PerCP-conjugated anti-CD45, and PE-conjugated anti-CD13 plus anti-CD33 antibodies. A third tube for corresponding isotype controls was also used. All monoclonal antibodies were purchased from BD Biosciences. Lymphocytes were gated with bright expression of CD45 and low SSC on CD45 vs SSC cytogram, and CD3+CD4+ T-cells were regated on CD3 vs CD4 cytogram, and PD-1 positive expression was measured on CD4 vs PD-1 cytogram. PD-1 expression on CD3+CD8+ T-cells was also measured following the above method using CD8 instead of CD4. PD-L1/PD-L2 expression of CD13+CD33+ myeloblasts was done following gating of myeloblasts with CD45 negative to intermediate expression and low SSC on CD45 vs SSC cytogram, and PD-L1/PD-L2 positive expression on CD13+CD33+ myeloblasts was measured on CD13+CD33+ vs PD-L1/PD-L2 cytogram. The percentages of CD3+ T-cells were defined as the proportion of CD3+ T-cells among CD45 vs SSC-defined lymphocytes, and the percentages of CD3+CD4+ and CD3+CD8+ T-cells were defined as the proportion of CD3+CD4+ and CD3+CD8+ T-cells among CD45 vs SSC-defined lymphocytes, respectively. The cut‐off value was assigned according to the isotypic controls, and expression results were represented with the proportions of positive cells (%) and the intensities as mean channel fluorescences (mcf). An example of flow cytometric analysis on the expression of immune checkpoint on T-cell subsets and checkpoint ligands on leukaemic myeloblasts in bone marrow aspirates. In this case with acute myeloid leukemia at diagnosis, the proportion of CD3+CD4+ T-cells was determined as 40.5%, and the expression proportion of PD-1 on CD3+CD4+ T-cells was 24.1% (a), The proportion of CD3+CD8+ T-cells was determined as 33.7%, and the expression proportion of PD-1 on CD3+CD8+ T-cells was 66.1% (b). The expression proportions of PD-L1 and PD-L2 on leukaemic myeloblasts (28.8%) were determined as 1.8% and 0.7%, respectively (c). Abbreviations: SSC, side scatter; CD, cluster of differentiation; PD-1, programmed death-1; L, ligand.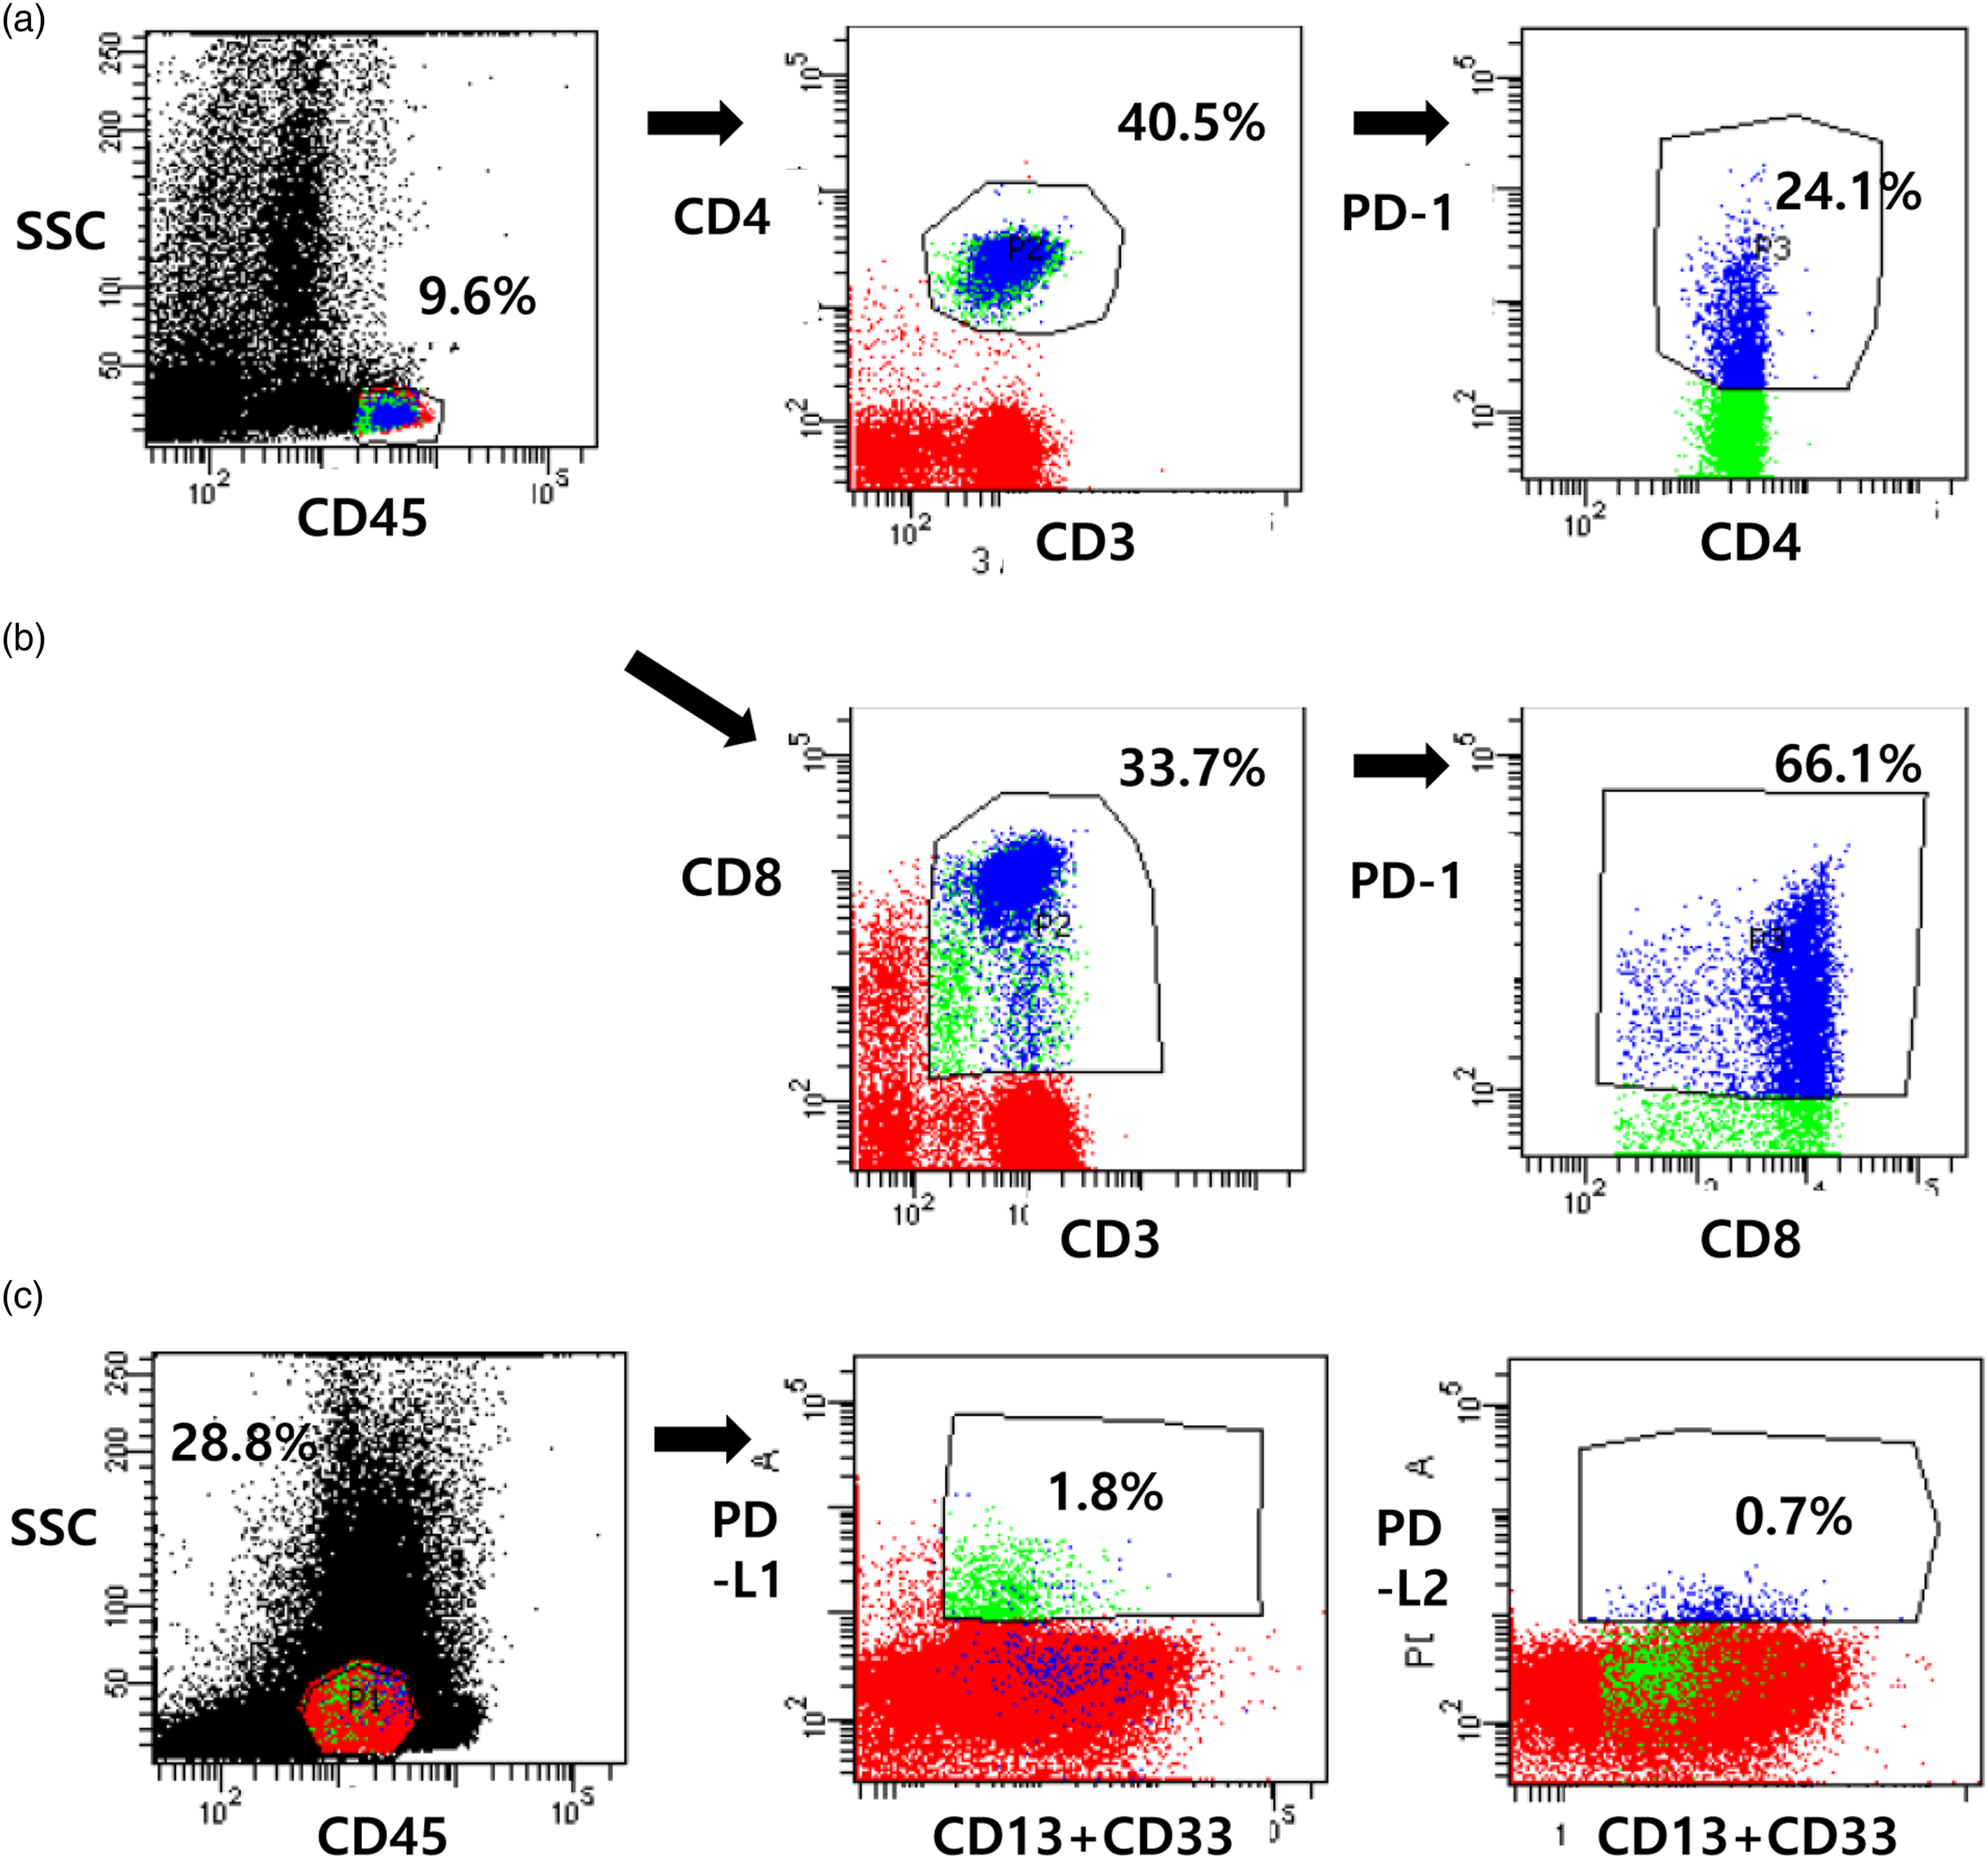
Statistical analysis
Data were analysed using the PASW Statistics software (version 18.0, SPSS Incorporation, Munich, Germany) and presented in box plots. The Mann–Whitney U test was used to determine statistical difference between two groups, and chi‐square test was used to distribute the percentage of categorical data between groups. The overall survival (OS) was measured from the date of allo-SCT until death or last follow-up. Relapse-free survival (RFS) was defined as the time interval between the time of allo-SCT and time of relapse, death, or last follow-up. OS and RFS were calculated using the Kaplan–Meier estimator. The log-rank test was used for comparisons of Kaplan–Meier curves. A Cox’s proportional hazard model was used to determine the significance of multiple variables in determining outcomes. Two-tailed p values <0.05 were considered statistically significant.
Results
PD-1 and PD-L1/L2 expression in AML patients at diagnosis
PD-1 expression levels on CD8+ and CD4+ T-cells, and PD-L1 and PD-L2 expression levels on CD13+ and/or CD33+ myeloblasts were measured in 97 BM samples at AML diagnosis. The average positive percentages of PD-1 expression at diagnosis were 36.1% on CD8+ T-cells and 28.6% on CD4+ T-cells, and those of PD-L1 and PD-L2 were 0.5% and 0.2%, respectively (Table 1).
On comparing PD-1 expression with that in the control samples (Figure 2), we found that PD-1 expression on CD8+ T-cells at diagnosis was significantly higher than that in the control samples (36.1 ± 14.6% vs 28.9 ± 9.0%, respectively; p = 0.032). However, PD-1 expression on CD4+ T-cells at diagnosis was similar with that in the control samples (28.6 ± 12.3 vs 27.7 ± 10.9, respectively; p = 0.785). PD-1 and PD-L1/L2 at the time of AML diagnosis showed no significant difference according to age, sex, and WHO classification. However, PD-L1 and PD-L2 on myeloblasts were significantly increased in secondary AML patients compared to de novo AML patients (p = 0.0000 and p = 0.039; Figure 2). Comparison of PD-1, PD-L1, and PD-L2 expression levels at diagnosis of acute myeloid leukaemia (AML). PD-1 expression levels on bone marrow CD8+ T-cells at diagnosis are slightly higher than those of controls (a), and PD-1 expression levels on CD4+ T-cells are similar to those in controls (b). Both PD-L1 expression (c) and PD-L2 expression (d) levels on bone marrow myeloblasts are higher in secondary AML patients than in primary AML patients.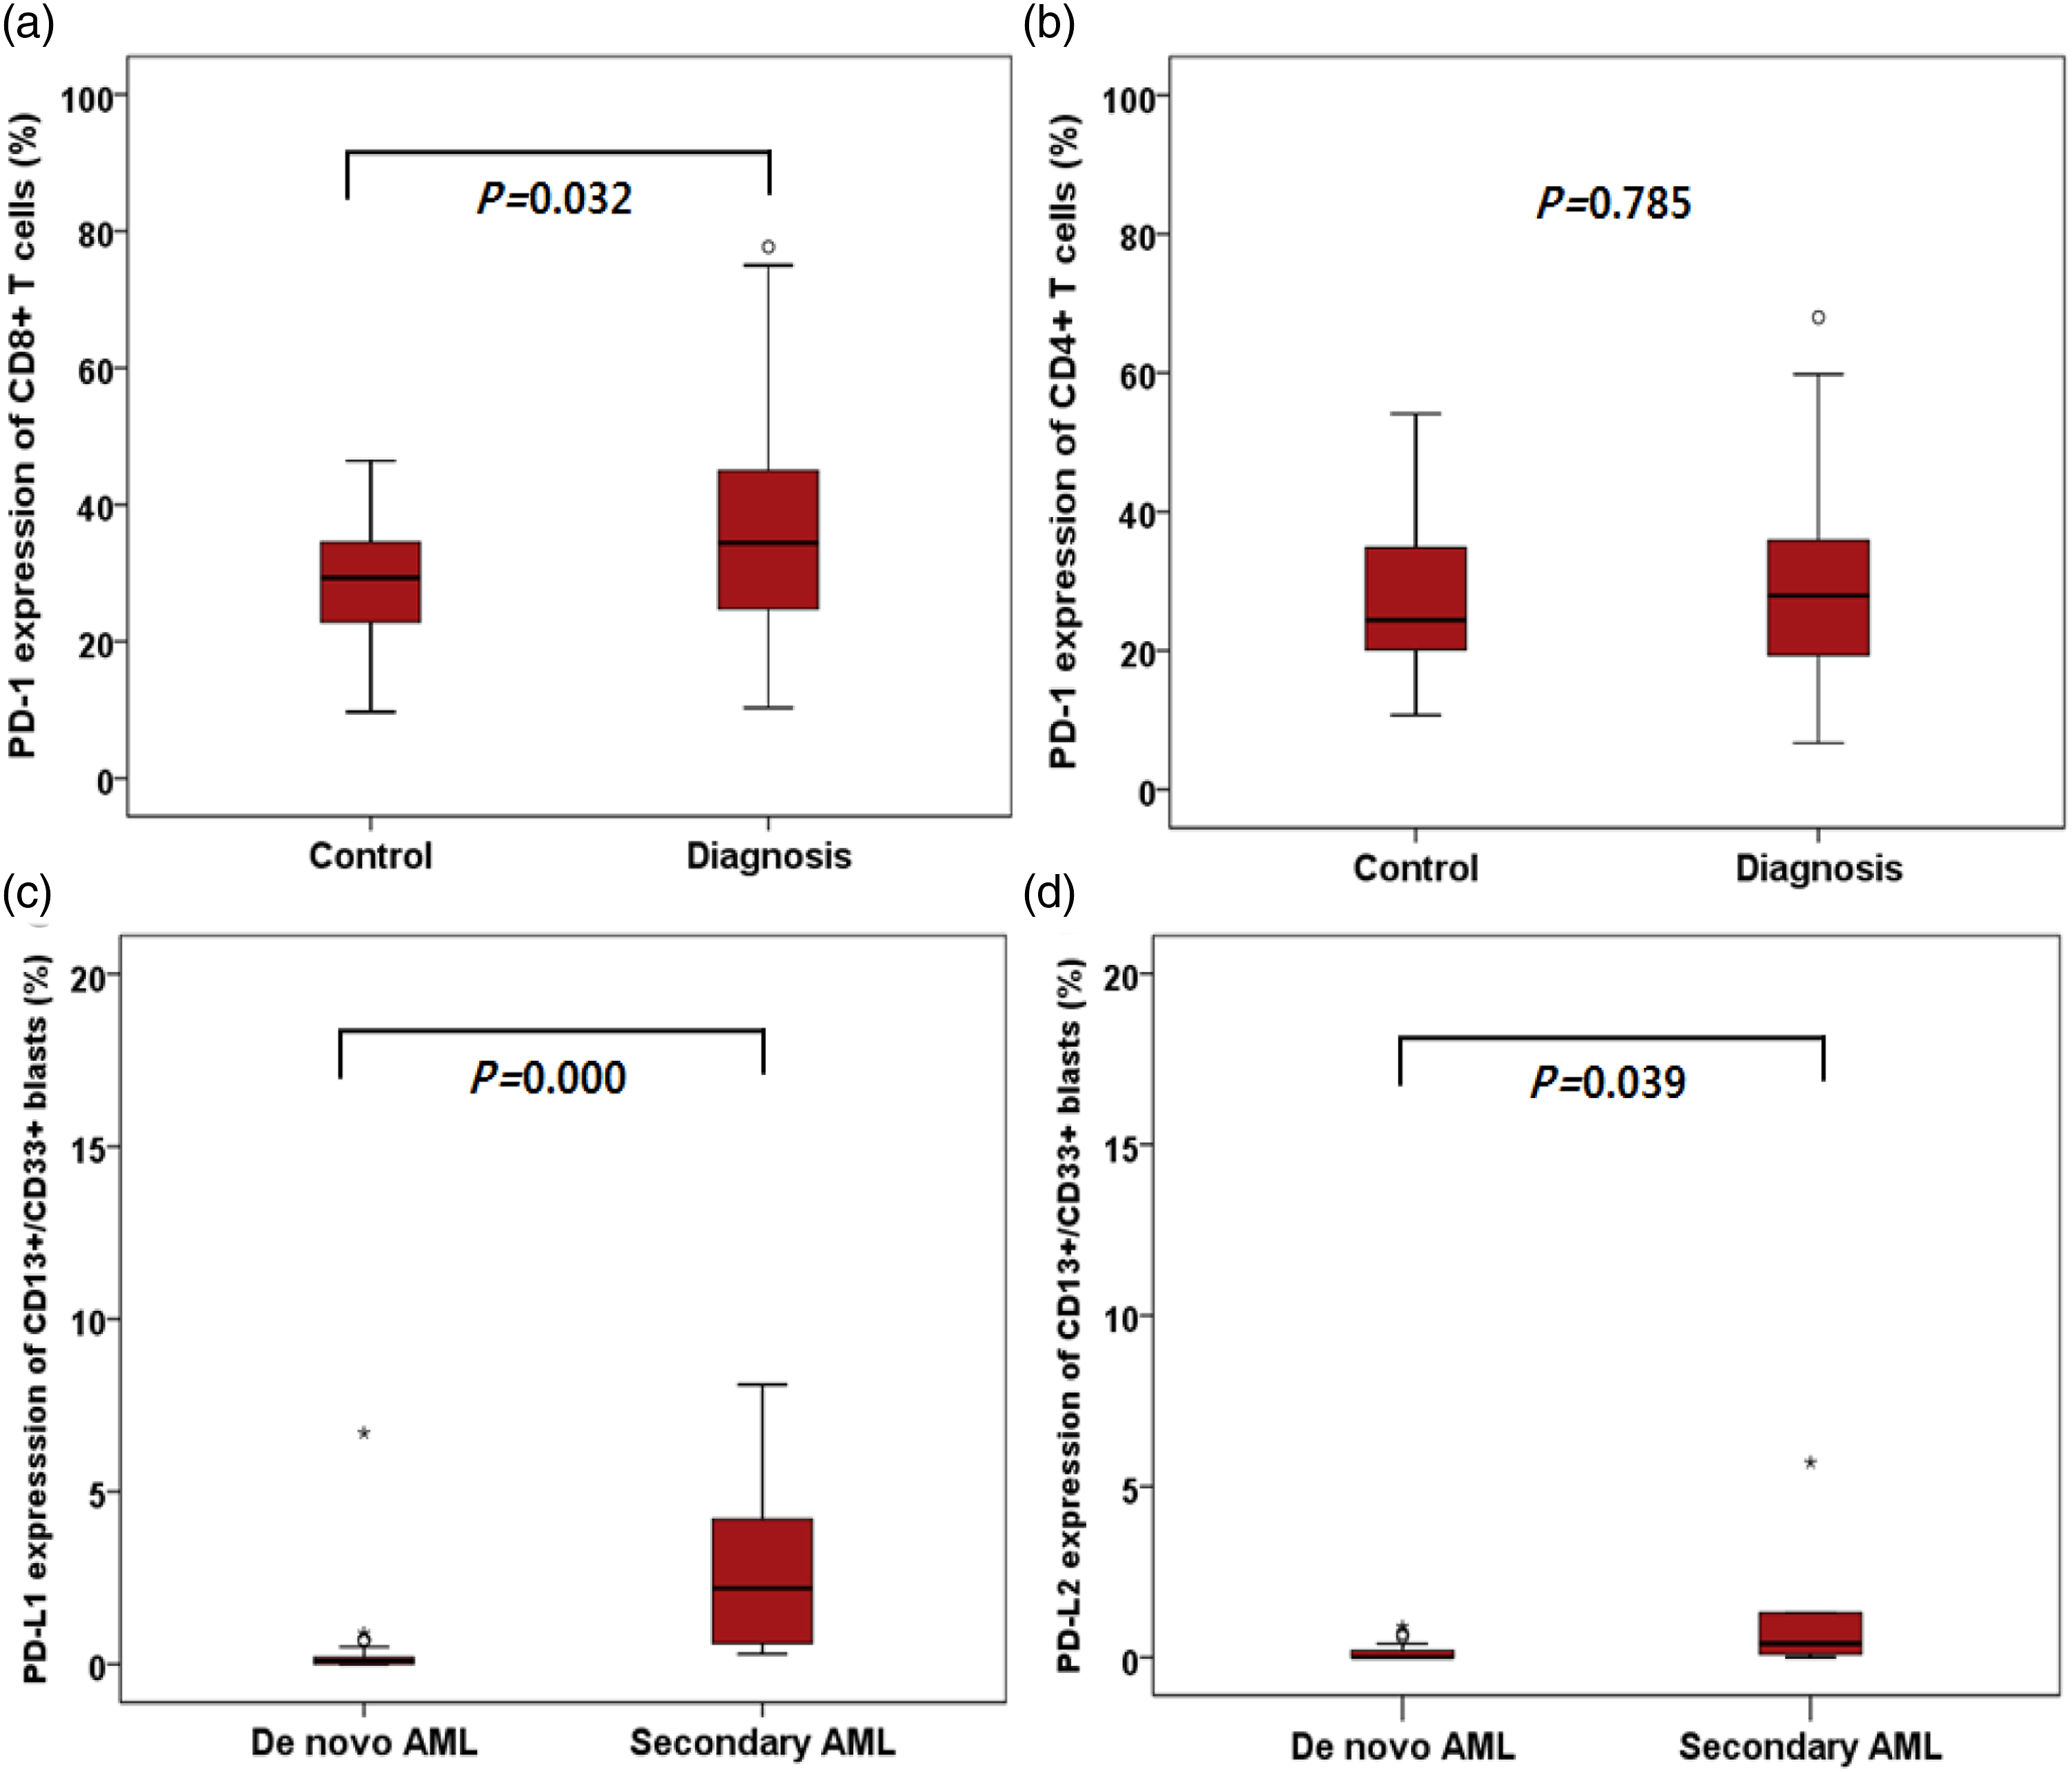
PD-1 expression levels on CD8+ and CD4+ T-cells in AML patients according to the treatment and disease status
We compared PD-1 expression levels on T-cells from AML patients according to the treatment and disease status. PD-1 expression in patients receiving CTx did not show significant difference in both CD8+ and CD4+ T-cells compared with that at diagnosis (p = 0.537 and p = 0.083, respectively). However, PD-1 expression in patients after allo-SCT treatment showed significant increase in both CD8+ and CD4+ T-cells compared with that at diagnosis (p = 0.000 and p = 0.000, respectively). In addition, PD-1 expression levels in both CD8+ and CD4+ T-cells were significantly higher after allo-SCT than after CTx (p = 0.000 and p = 0.000, respectively; Figure 3). Expression of PD-1 on bone marrow T-cells from acute myeloid leukaemia (AML) patients according to treatments and disease status. Significantly increased PD-1 expression levels were observed on CD8+ and CD4+ T-cells from AML patients after allogeneic stem cell transplantation (allo-SCT) compared with those at diagnosis and after chemotherapy (a). PD-1 expression levels according to different disease status showed no significant differences between each status except for the relapse status after the CTx group of CD8+ T-cells (b). Statistical differences between different statuses were calculated. *p < 0.05; **p < 0.01; ***p < 0.001.; ****p < 0.0001. Abbreviations: PD-1, programmed death-1; CTx, chemotherapy; allo-SCT, allogeneic haematopoietic stem cell transplantation; CR, complete remission; NMTR, normocellular marrow with trilineage regeneration.
According to the disease status in patients with CTx, PD-1 expression levels on CD8+ T-cells were slightly increased in the relapse group than the persistence group (p = 0.048), and PD-1 expression levels on CD4+ T-cells were similar regardless of CR, persistence, or relapse. PD-1 expression on both CD8+ and CD4+ T-cells increased after allo-SCT, and there were no significant differences between each group (NMTR vs persistence vs relapse) after allo-SCT (Figure 3).
PD-1 expression levels in AML patients according to the time interval after allo-SCT
PD-1 expression on CD8+ T-cells and CD4+ T-cells showed weak, negative correlations with the time interval after allo-SCT (r = −0.364, p = 0.001 and r = −0.273, p = 0.012; respectively).
PD-1 expression levels on CD8+ T-cells increased within 200 days after allo-SCT (p = 0.000), but there was no significant difference between levels at diagnosis and after 200 days. The PD-1 levels on CD8+ T-cells decreased gradually after 200 days following allo-SCT and significantly decreased after 401 days compared with those within the first 200 days after allo-SCT. PD-1 expression on CD4+ T-cells remained significantly higher in all post-SCT days compared with those at the time of diagnosis (p = 0.000), but decreased after 401 days compared with those within the first 100 days after allo-SCT (Figure 4). PD-1 expression levels on CD8+ T-cells and CD4+ T-cells according to the time (days) after allogeneic stem cell transplantation in acute myeloid leukaemia patients (a). Increased PD-1 expression levels on CD8+ T-cells and CD4+ T-cells from acute graft versus host disease (GVHD) patients compared with non-acute GVHD patients (b). Statistical differences in PD-1 expression levels between each group of post-infusion days were calculated. *p < 0.05; **p < 0.01; ***p < 0.001; ****p < 0.0001. Abbreviations: PD-1, programmed death-1.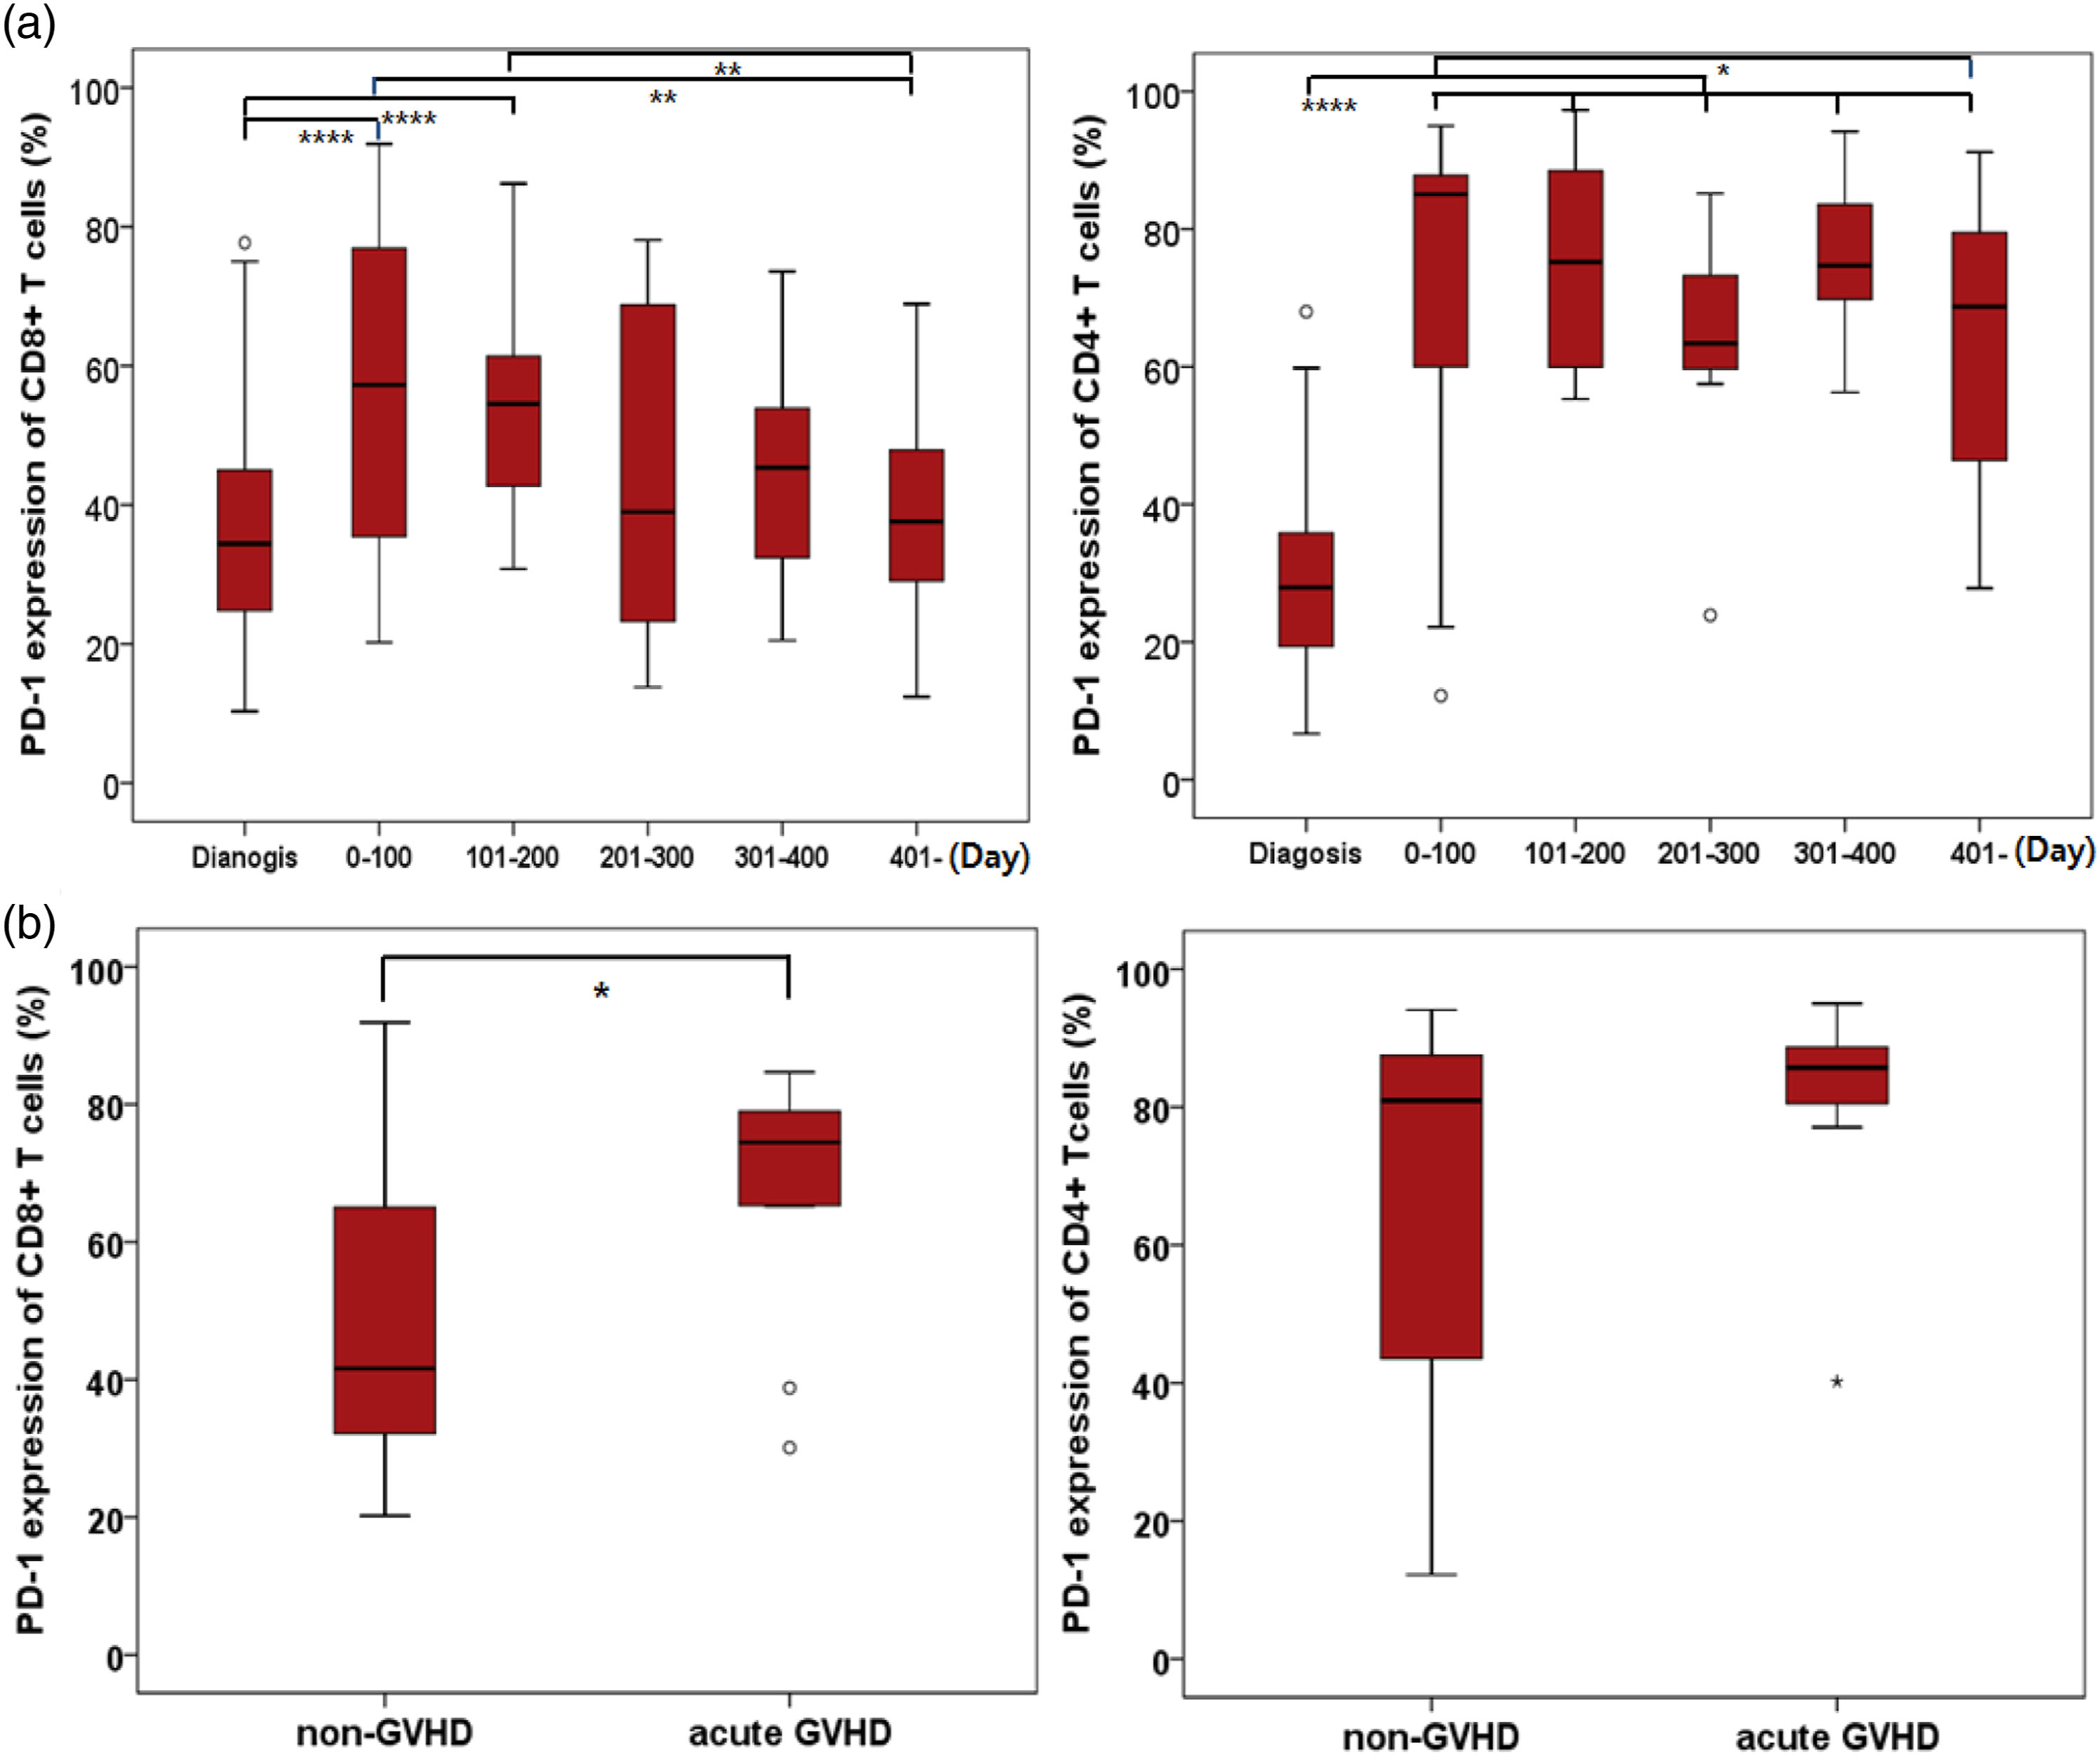
PD-1 expression levels in AML patients who experienced GVHD
To investigate the relationship between PD-1 expression and acute GVHD (aGVHD), we analysed 30 samples within 100 days after allo-SCT. The 30 samples included 20 samples from patients without aGVHD (non-aGVHD group) and 10 samples from patients with aGVHD (aGVHD group) within 100 days. There were no significant differences in age, sex, laboratory findings, conditioning regimen, type of donor, GVHD prophylaxis and GVHD treatment between the non-aGVHD and aGVHD groups. We analysed the expression of PD-1 in aGVHD patients, and there were no significant differences in PD-1 expression on both CD8+ and CD4+ T-cells according to GVHD prophylaxis (p = 0.607 and p = 0.088), conditioning regimen (p = 1.000 and p = 0.157), and donor type (p = 0.616 and p = 0.385). However, PD-1 expression on CD8+ T-cells slightly increased in the aGVHD group (p = 0.049) (Figure 4).
PD-1 expression levels and prognosis
Clinical characteristics of patients with acute myeloid leukaemia who received allogeneic haematopoietic cells transplantation (n = 60).
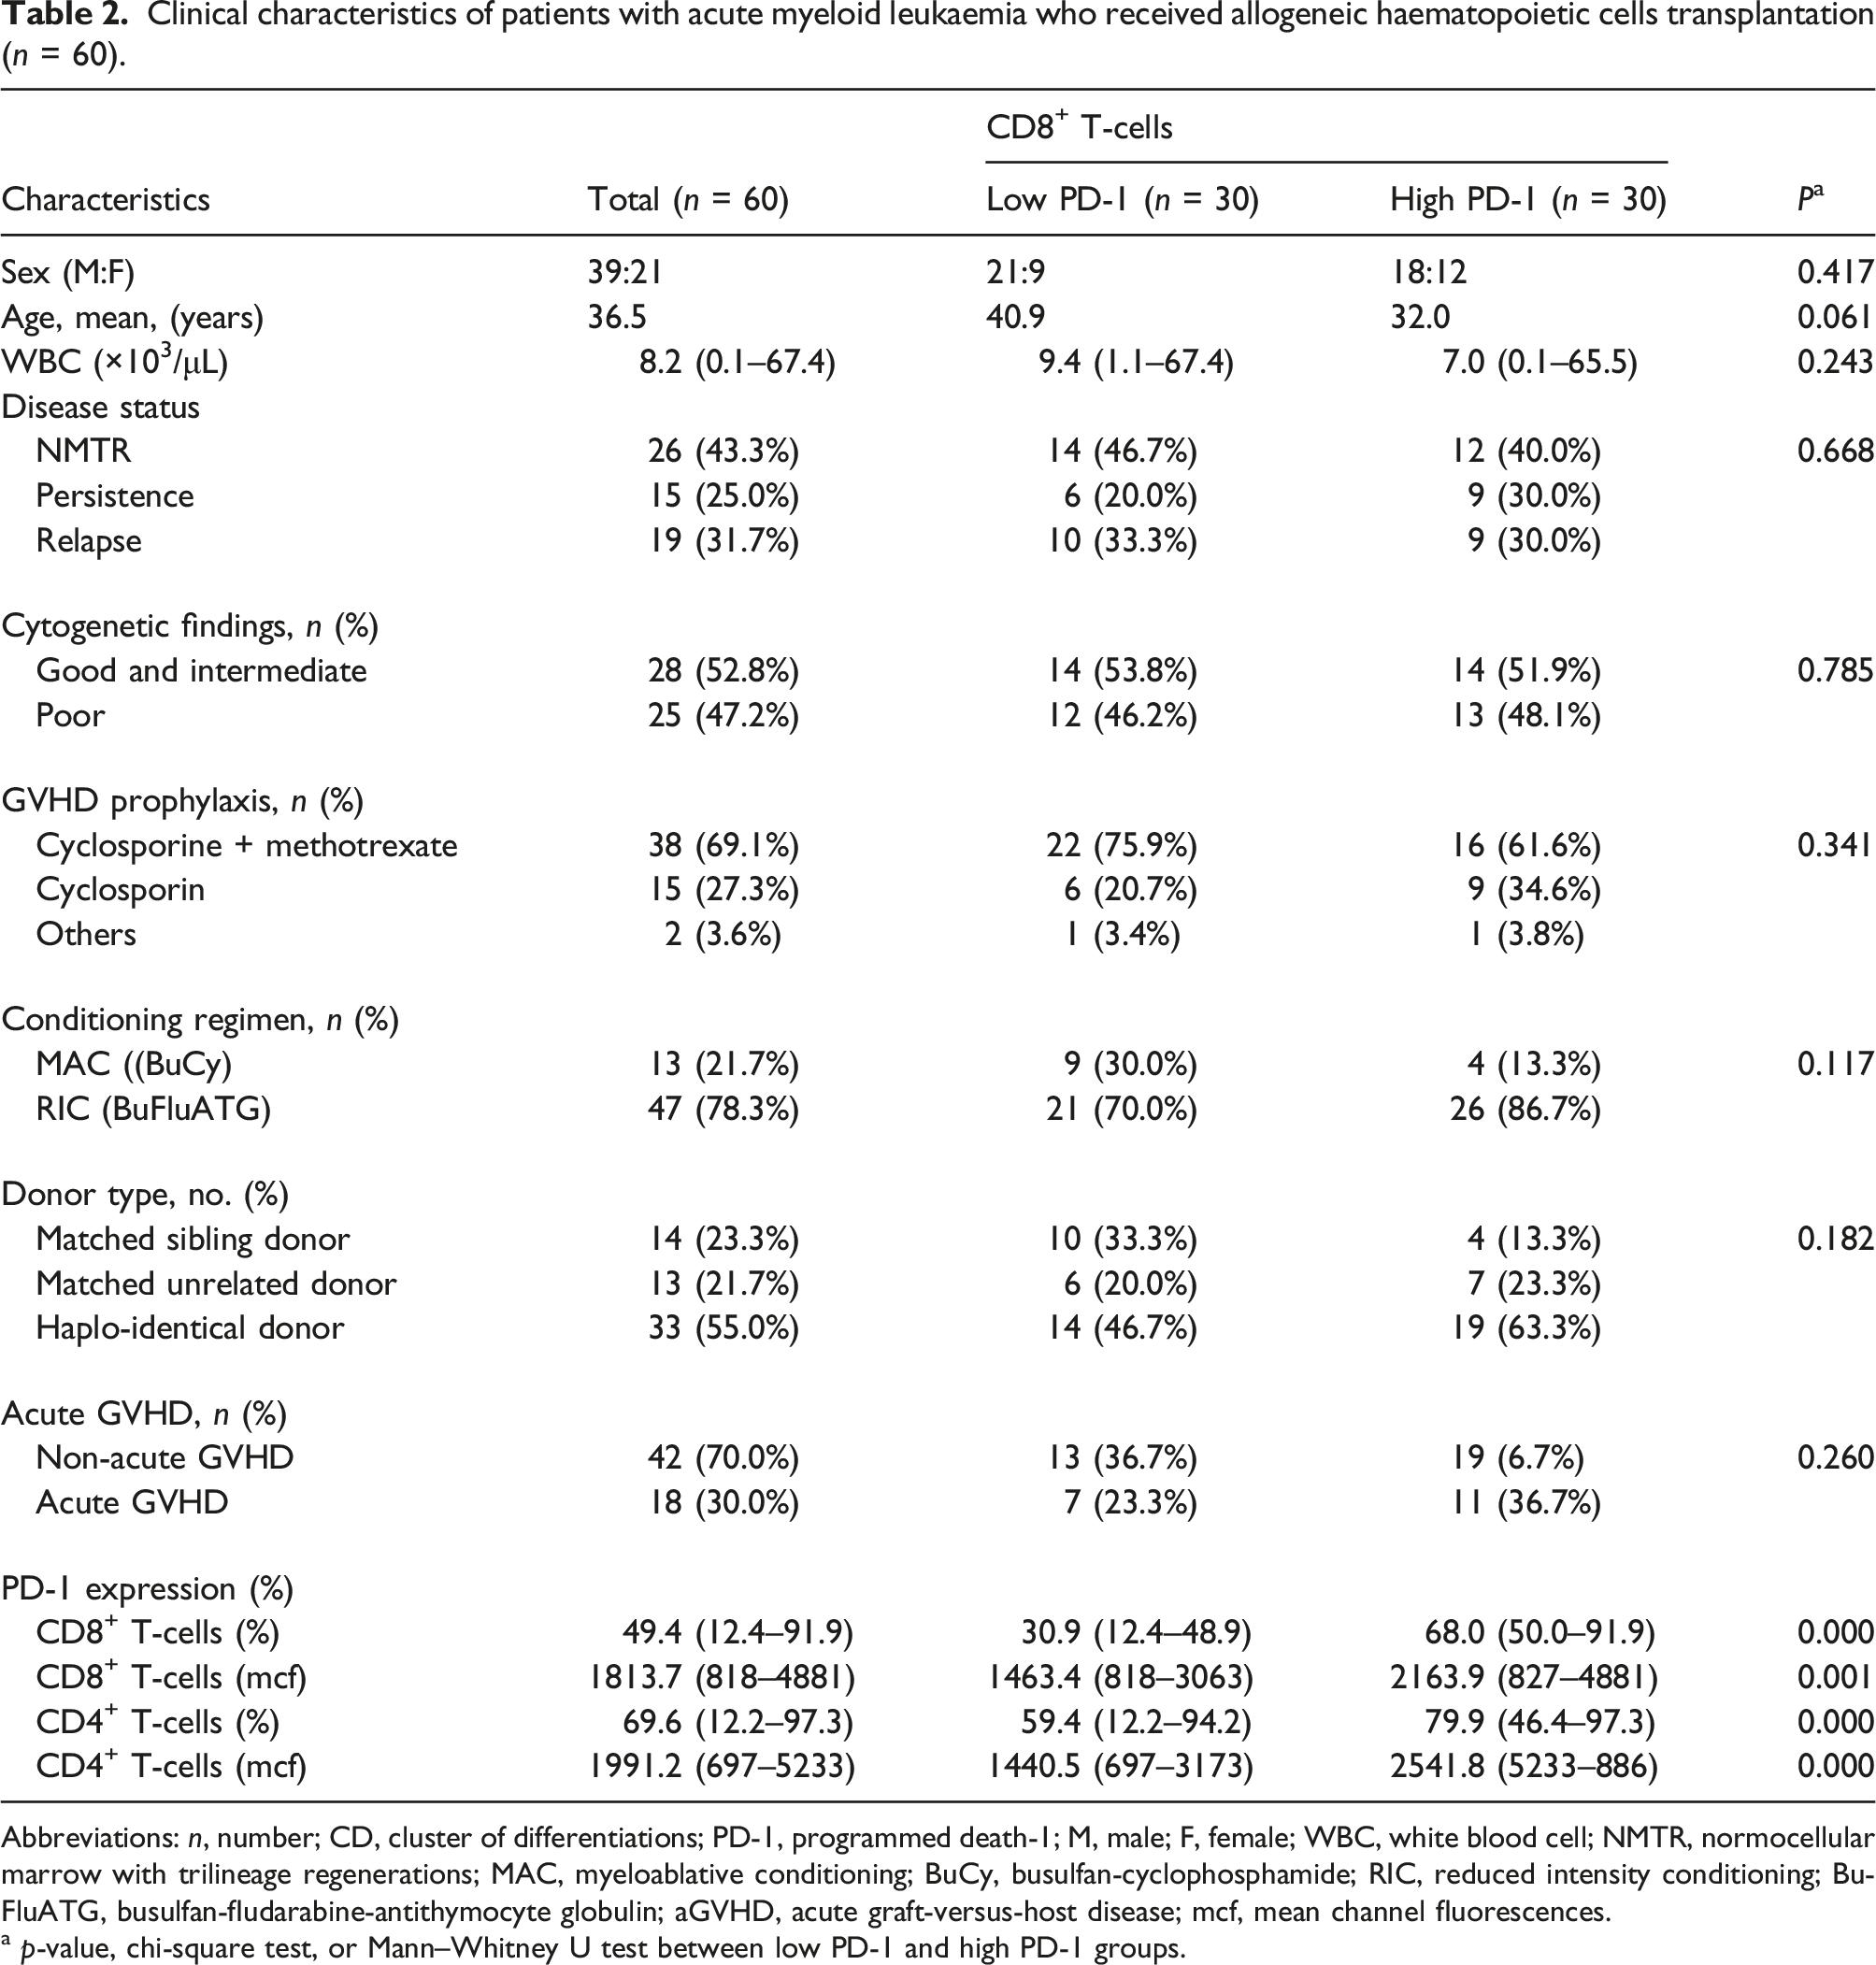
Abbreviations: n, number; CD, cluster of differentiations; PD-1, programmed death-1; M, male; F, female; WBC, white blood cell; NMTR, normocellular marrow with trilineage regenerations; MAC, myeloablative conditioning; BuCy, busulfan-cyclophosphamide; RIC, reduced intensity conditioning; BuFluATG, busulfan-fludarabine-antithymocyte globulin; aGVHD, acute graft-versus-host disease; mcf, mean channel fluorescences.
a p-value, chi-square test, or Mann–Whitney U test between low PD-1 and high PD-1 groups.
Patients with high PD-1 expression on CD8+ T-cells had a shorter OS rate (median of 17.0 months; 95% CI: 11.0–23.0 months) than patients with low PD-1 expression (median of 30.0 months; 95% CI: 23.8–36.2 months), and there was a statistically significant difference in the survival curves between these two groups (p = 0.006). Patients with high PD-1 expression on CD4+ T-cells had a shorter OS rate (median of 22.0 months; 95% CI: 14.4–29.6 months), compared with patients with low PD-1 expression (median of 33.0 months; 95% CI: 13.4–52.6 months), but there was no significant difference in OSs between the two groups (p = 0.104). No difference in RFS was also found between patient groups with high PD-1 expression (median of 15.0 months; 95% CI: 5.9–24.1 months) and low PD-1 expression (median of 23.0 months; 95%: 15.5–30.5 months) on CD8+ T-cells (p = 0.114). Patients with a high PD-1 expression on CD4+ T-cells had a shorter relapse-free survival (median of 18.0 months; 95% CI: 6.3–29.7 months) than the patients with low PD-1 expression (median of 27.0 months; 95% CI: 9.9–44.1 months), but there was no significant difference between the high and low expression groups (p = 0.131) (Figure 5). Overall survival of acute myeloid leukaemia (AML) patients receiving allogenic stem cell transplantation (allo-SCT), grouped according to the median PD-1 expression level (high/low). Overall survival of patients with high PD-1 expression on CD8+ T-cells was shorter than that of patients with low PD-1 expression (p = 0.006), but there was no significant difference between high and low PD-1 expression groups on CD4+ T-cells. Abbreviations: PD-1, programmed death-1; allo-SCT, allogenic haematopoietic stem cell transplantation; HR, hazard ratio; CI, confidence Interval.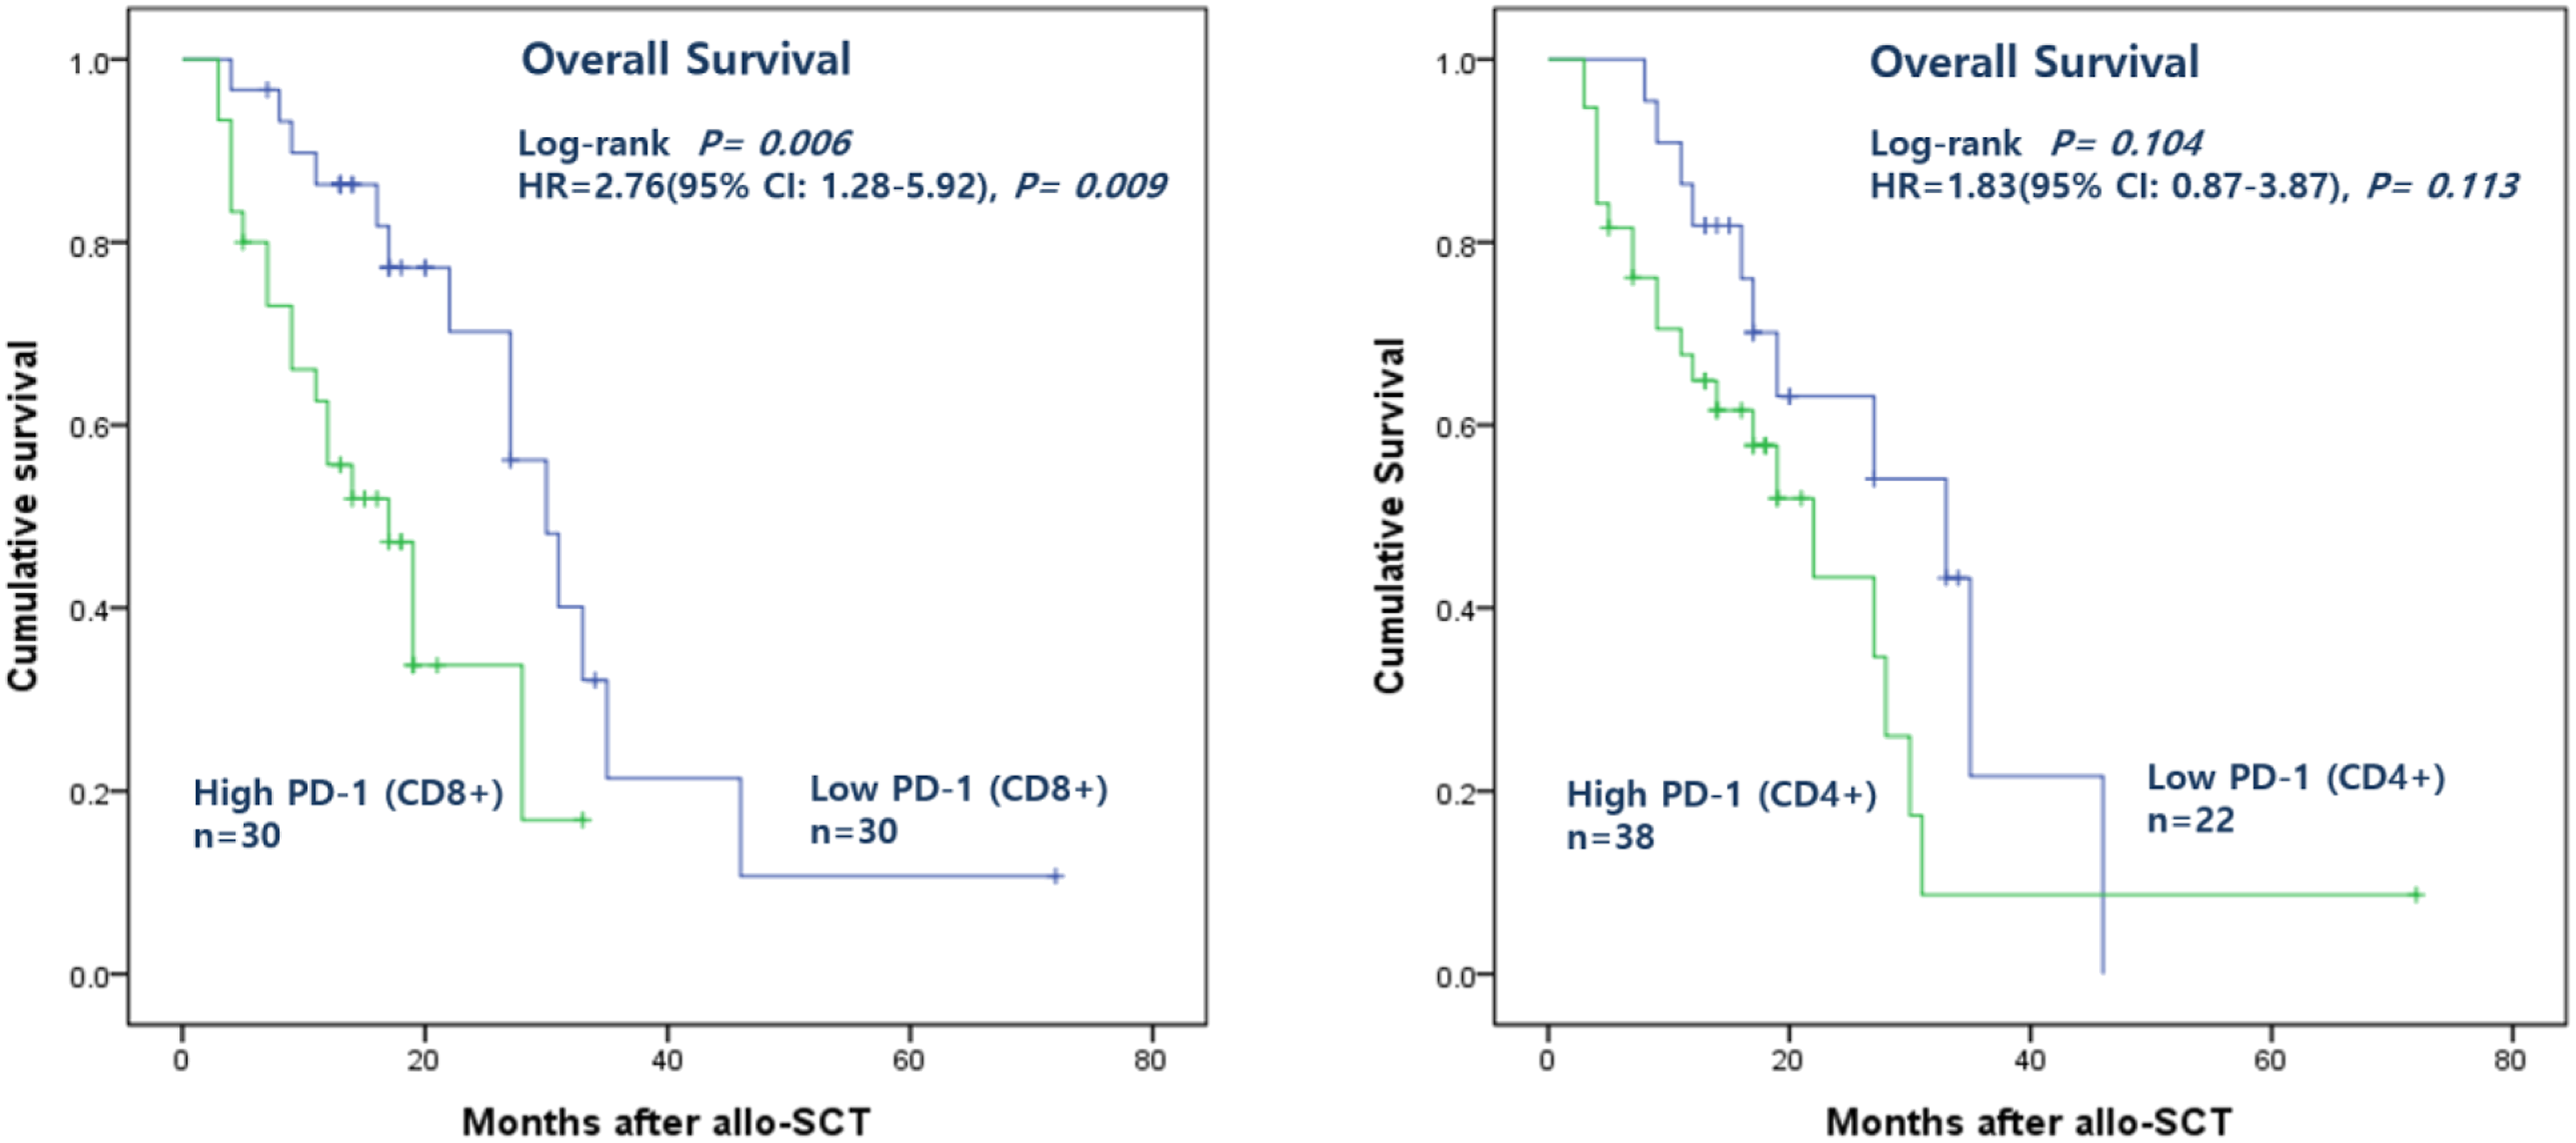
By univariate analysis, we investigated the correlation with OS for the following characteristics: PD-1 expression, cytogenetic findings, GVHD prophylaxis, conditioning regimen, type of donor, and aGVHD. Patients who had high PD-1 on CD8+ T-cells (p = 0.009), poor cytogenetic findings (p = 0.035), GVHD prophylaxis with cyclosporine (p = 0.030), and donor type with ‘haplo-identical’ (p = 0.016), showed inferior survival outcomes. However, by the multivariate analysis only two factors with ‘high PD-1 on CD8+ T-cells’ (HR, 2.9; p = 0.017) and ‘haplo-identical donor’ (HR, 3.2, p = 0.011) showed statistically significant correlation of OS with these four factors.
Discussion
Although allo-SCT has been long considered a curative treatment for AML, there are limited treatment modalities in relapsed cases after allo-SCT. Thus, novel therapies need to be developed to treat AML patients who have relapsed after allo-SCT. Acute myeloid leukemia is a disease that responds to immune-based therapies, including allo-SCT and donor lymphocyte infusion (DLI). Although leukaemic cells are sensitive to immunotherapy, the microenvironment in AML is immunosuppressive, facilitating immune tolerance of these cells. 16 It is expected that PD-1/PD-L1 pathways will play a role in the immune suppression of AML patients. Previous reports have demonstrated upregulation of the PD-1/PD-L1 pathway in AML and the negative impact of this amplification on AML disease control. 17 In addition, upregulation of PD-L1 and PD-L2 mRNA expression was observed in haematologic malignancies such as AML. 18 Based on these findings, we suggest that AML is an appropriate disease to attempt new immunotherapeutic therapies; clinical studies are assessing numerous checkpoint inhibitors for potential treatment, including nivolumab and pembrolizumab, which block PD-1. 19
Although the importance of PD-1/PD-L1 in AML is well recognized, there have been few studies on PD-1 expression in AML patients, and none of these studies involved a large number of patients. Therefore, we aimed to confirm PD-1 expression levels in a large number of AML patients at different clinical statuses, such as at diagnosis, after CTx, and after allo-SCT.
We observed that PD-1 expression levels on CD8+ T-cells in patients at diagnosis were slightly higher than in the control group, whereas PD-1 expression levels on CD4+ T-cells were not different from those in the control group. Schnorfeil et al. also reported similar expression levels of inhibitory molecules on T-cells while comparing AML patients at diagnosis and healthy controls. 13 PD-1 expression increases during chronic inflammation or chronic viral infection to induce ‘T-cell exhaustion’.7,8,9,10,11,12 It also does not appear to immediately increase at diagnosis owing to the acute nature of AML. Secondary AML patients exhibited higher levels of PD-L1 and PD-L2 compared to de novo AML patients. The previous study showed higher levels of PD-L1 expression in a group of patients with myelodysplastic syndrome (MDS) than in patients with AML. 18 This could explain our finding that most secondary AML patients transformed from MDS showed higher PD-1 expression levels. Recent studies suggest that the role of the MDS immunologic compartment may change over time from autoimmune to immune-suppressive mechanisms as MDS progresses from early to more advanced stages.20,21,22,23
In this study, we first analysed and described the difference in PD-1 expression levels according to the clinical status in many AML samples. This study showed that PD-1 expression was higher in patients who underwent allo-SCT than in patients receiving CTx, and there was no association between PD-1 expression levels and disease status (i.e., CR, NMTR, persistence or relapse). A previous study comparatively assessed PD-1 expression in a cohort of AML patients at diagnosis, relapse after CTx, and relapse after allo-SCT. This study confirmed a higher level of PD-1 expression in patients with relapse after allo-SCT. 13 Another study suggests that PD-1(hi)TIM-3(+) T-cells are associated with leukaemia relapse in AML patients who underwent allo-SCT, and can serve as a prognostic factor of recurrence. 24 We observed similar outcomes; the group treated with allo-SCT exhibited higher levels of PD-1 expression compared to the group treated with CTx, but we found an association between allo-SCT and high PD-1 expression rather than an association between relapse after allo-SCT and PD-1 expression.
Additionally, on measuring PD-1 expression levels at different time points after allo-SCT, it was found that CD8+ T-cells showed an immediate increase in PD-1 expression level but returned to the same level as the diagnosis group, whereas CD4+ T-cells exhibited continuously elevated PD-1 expression levels. This suggests that allo-SCT is associated with upregulation of the PD-1/PD-L1 pathway, and additional studies are needed to further understand the role of each immunocyte.
PD-1 and its ligands play an important role in the maintenance of peripheral tolerance, and PD-1 is reported to regulate aGVHD lethality. 25 Furthermore, recent clinical trials of PD-1 blockade were reported to induce aGVHD, which is a serious adverse event. 26 We observed the different PD-1 expression levels on CD8+ T-cells between the aGVHD and non-aGVHD groups. The aGVHD group exhibited higher PD-1 expression levels than the non-aGVHD group, and thus, we suggest that increased PD-1 expression levels come from reactive responses to aGVHD.
We attempted to analyse the association between PD-1 expression levels and prognosis in patients who underwent allo-SCT, and observed that the patient group with higher PD-1 expression levels in CD8+ T-cells exhibited shorter OS. Patients with high PD-1 expression levels after allo-SCT may have a poor prognosis, and thus can form a target group for PD-1 blockade. Several recent studies have shown that higher PD-1+Treg rate are expected to poor OS and Disease-Free Survival (DFS), 27 and that increased PD-1+CD8+ T-cells in AML patients both at diagnosis and after induction CTx, were liked to poor OS and Event-Free Survival (EFS). 28 However, this study focuses on identifying the expression of PD-1 in each disease status, and not all patients were enrolled during the above period. The overall prognosis seems to be poor because we selected all samples from cases with either relapse or persistence after all-SCT and similar number of samples from cases showing NMTR in order to make sample numbers of each patient group similar. Therefore, these high mortality and relapse rates do not represent the general prognosis of our hospital.
In summary, our findings demonstrate that PD-1 expression levels on BM CD8+ T-cells and CD4+ T-cells in AML patients are elevated in those treated with allo-SCT. Among these patients, the patient group experiencing aGVHD showed higher PD-1 expression level. In addition, the patient group with a high PD-1 expression level on CD8+ T-cells exhibited shorter OS. The results of our study suggest that PD-1 blockade might be a potential therapy in patients who show high PD-1 expression on CD8+ T-cells after allo-SCT.
Footnotes
Authors’ Note
There are authors who have changed their affiliation, so I would like to inform you of their new affiliation.
Chan-Jeoung Park* Department of Laboratory Medicine, Green Cross Labs., Gyeonggi-do, Korea Green Cross Labs; 107, Ihyeon-ro 30beon-gil, Giheung-gu, Yongin-si, Gyeonggi-do, 16924, Korea. E-mail:
Kyoo-Hyung Lee Department of Hematology and Oncology, Ewha Womans University Mokdong Hospital, Ewha Womans University School of Medicine, Seoul, Korea.
Acknowledgements
The authors thank Chan Hee Yoon, MT, and Sang Hee Han, MT, in the Department of Laboratory Medicine at the Asan Medical Center for technical assistance with the flow cytometry. This study was supported by a grant (2016-635) from the Asan Institute for Life Science, Asan Medical Center, Seoul, Korea.
Declaration of conflicting interests
The author(s) declared no potential conflicts of interest with respect to the research, authorship, and/or publication of this article.
Funding
The author(s) disclosed receipt of the following financial support for the research, authorship, and/or publication of this article: This study was supported by a grant (2016-635) from the Asan Institute for Life Science, Asan Medical Center, Seoul, Korea.
Ethical approval
This study was approved by the institutional review board of the Asan Medical Center (approval number: 20161087) and was performed in accordance with the Declaration of Helsinki.
Guarantor
CJP.
Contributorship
EY performed the analyses, interpreted the data, and wrote manuscript; CJP and YUC designed the study, supervised the experiments, interpreted the data, and contributed to the manuscript; SJ and MYL interpreted the bone marrow tests; HK, KNK, HJI, JHL, and KHL enrolled patients EJC reviewed the clinical and treatment information, and all authors critically reviewed the manuscript and approved the final version.