
Abstract
Objectives
We evaluated the applicability of a machine learning–based low-density lipoprotein-cholesterol (LDL-C) estimation method and the influence of the characteristics of the training datasets.
Methods
Three training datasets were chosen from training datasets: health check-up participants at the Resource Center for Health Science (N = 2664), clinical patients at Gifu University Hospital (N = 7409), and clinical patients at Fujita Health University Hospital (N = 14,842). Nine different machine learning models were constructed through hyperparameter tuning and 10-fold cross-validation. Another test dataset of another 3711 clinical patients at Fujita Health University Hospital was selected as the test set used for comparing and validating the model against the Friedewald formula and the Martin method.
Results
The coefficients of determination of the models trained on the health check-up dataset produced coefficients of determination that were equal to or inferior to those of the Martin method. In contrast, the coefficients of determination of several models trained on clinical patients exceeded those of the Martin method. The means of the differences and the convergences to the direct method were higher for the models trained on the clinical patients' dataset than for those trained on the health check-up participants' dataset. The models trained on the latter dataset tended to overestimate the 2019 ESC/EAS Guideline for LDL-cholesterol classification.
Conclusion
Although machine learning models provide valuable method for LDL-C estimates, they should be trained on datasets with matched characteristics. The versatility of machine learning methods is another important consideration.
Introduction
High levels of low-density lipoprotein-cholesterol (LDL-C) in blood have been implicated in the development of coronary artery disease. Japanese cohort studies also show that high LDL-C levels increase the hazard ratio of the risk for the development coronary heart diseases. 1 Moreover, lowering LDL-C levels has been shown to reduce the risk of coronary artery disease risk.2–4 In Japan, the reference values in Japan for risk assessment in dyslipidemia screening are set to 140 mg/dL, with a borderline range of 120–139 mg/dL. The National Cholesterol Education Program and the third revision of the Adult Treatment Panel (NCEP-ATPⅢ) adopt five reference levels 5 and the 2019 European Society of Cardiology and European Atherosclerosis Society (ESC/EAS) Guidelines adopts six reference levels. 5
LDL-C levels have traditionally been calculated using formulas such as the Friedewald formula, which is based on total cholesterol (TC), high-density lipoprotein-cholesterol (HDL-C), and triglycerides (TG). 6 Homogeneous direct measurement methods using surfactants have also been available since the 1990s. Such direct methods are affected by measurement accuracy and inter-manufacturer differences in reagents, although it has been reported that these problems were reportedly resolved in the 2010s.7,8,9 The Friedewald formula that was published in 1974 is only applicable only for TG levels below 400 mg/dL, and even those cases with a TG level less than 400 mg/dL have been shown to deviate from the true LDL-C values measured by the standard method in the Centers for Disease Control and Prevention.9–12 Various alternative estimation formulas for LDL-C levels have been devised, including those reported by Hattori, 13 Ahmadi, 10 Vujovic, 14 and de Cordova. 15 Among the formulas, in 2020, Sampson 16 developed for a more accurate calculation of LDL-C levels in patients with low LDL-C levels and/or hypertriglyceridemia. Meanwhile, the method published by Martin 12 in 2013 estimates the TG at very low-density lipoprotein-cholesterol ratios from non–HDL-C and TG levels. Their method is based on the lipid profile data of 1.35 million individuals obtained using the beta-quantification (BQ) method. The usefulness of the Martin method has been reported in many studies performed in various regions,17–20 including our study on laboratory data from three Japanese institutions. 21 However, no consensus LDL-C measurement has been accepted universally. Although machine learning has further improved the accuracy of estimation methods,22–27 a few reports have considered the general applicability of such machine learning methods; moreover, whether the data from one’s own institution are required as the training data has not been clarified. 26 In this study, we aimed to verify the usefulness of machine learning for LDL-C estimation. We also developed and evaluated machine learning models using data from three different institutions.
Materials and methods
Subjects
This study was approved by the Ethics Boards of Gifu University (2021-A059) and Fujita Health University (FM21-093). Informed consent with an opt-out option was provided on the website of each institution.
In this retrospective study, the following three datasets containing lipid profile were used as the training data for the development of the LDL-C estimation machine learning models: dataset A, containing the data of 2664 health check-up participants at the Resource Center for Health Science; dataset B, containing the data of 7409 patients at Gifu University Hospital; and dataset C, containing the data of 14,842 patients at the Fujita Health University Hospital. Another dataset containing the lipid profiles of 3711 patients from the Fujita Health University Hospital was used as the test dataset included TG, TC, HDL-C, and LDL-C measurements.
Lipid measurements and calculations
As training datasets A and B, we employed the ‘correct data’ [LDL-C values measured with the direct methods (D-LDLC)] measured by ‘Cholestest LDL’ (SEKISUI Medical Co., Inc.). Training dataset C was the ‘MetaboLead LDL-C’ (Hitachi Chemical Diagnostics Systems Co., Ltd.) dataset, which was also used as the test dataset. The TG, TC, and HDL-C levels measured with ‘Cholestest TG’, ‘Cholestest CHO’, and ‘Cholestest N HDL’, respectively, were used as the training data for datasets A and B, and those measured with ‘DETAMINAR L TG Ⅱ’, ‘DETAMINAR L TC Ⅱ’, and ‘MetaboLead HDL-C’, respectively, were used as the training data for dataset C and the test dataset. The reference LDL-C values were calculated using the Friedewald formula (F-LDLC; [TC] − [HDL-C] − [TG]/5), the Sampson formula (S-LDLC; [TC]/0.948 – [HDL-C]/0.971 – ([TG]/8.56 + ([TG] × ([TC] – [HDL-C]))/2140 – [TG]2/16,100) – 9.44), and the Martin method (M-LDLC; [TC] − [HDL-C] − [TG]/variable factor).
Development of models for estimating LDL-C values estimation by machine learning
Nine machine learning models for nine different LDL-C value estimates were created from each of the three training datasets. The nine machine learning models, derived using Python 3.9 via grid-search hyperparameter tuning and 10-fold cross-validation, were as follows: ordinary least squares regression (OLS) using scikit-learn 1.1.1; ridge regression (Ridge) using scikit-learn 1.1.2; decision tree regression (Tree) using scikit-learn 1.1.2; random forest regression (RF) using scikit-learn 1.1.1; gradient boosting regression (GB) using scikit-learn 1.1.1; LightGBM regression (LGB) using LightGBM v3.3.2; XGBoosting regression (XGB) using XGBoost 1.5.1; support vector machine regression (SVM) using scikit-learn 1.1.1; and a deep neural network (DNN) using Keras 1.1.2.
Statistical analysis
To determine the suitability of the test dataset LDL-C values derived through the machine learning model, we computed Spearman’s rank correlation coefficient, Deming regression analysis, and Bland–Altman analysis. The limit of agreement (LoA) was determined as the mean ±1.96 × the standard deviation of the difference. One-way analysis of variance was used for comparing of the difference between the D-LDLC and the estimated LDL-C in each TG quintile group. These analyses were performed with the statistical analysis software JMP 13.2.1 and R 4.1.0.
Results
Coefficient of determination in 10-fold cross-validation
Once the hyperparameters were tuned, 10-fold cross-validations of each model were performed on the training datasets, and the coefficients of determination (R 2 ) were calculated. The learning on dataset A was inferior to the learning on the other datasets, with lower R 2 scores on 10-fold cross-validations by Tree, GB, and LGB than on the other learning results. Conversely, learning by OLS, Ridge, SVM, and DNN achieved lower R 2 scores on dataset C than the other learning. In most models, the R 2 scores of learning on dataset B exceeded those of learning on dataset A but were lower than those of learning on dataset C (Supplemental Figure 1).
Predictive performance of the trained models on the test dataset
The LDL-C values for the test dataset were predicted through the trained models. The R 2 of the predicted and D-LDLC values exceeded those of the F-LDLC and S-LDLC values overall, but exceeded those of the M-LDLC values for the DNN model trained on dataset A, the RF, GB, LGB, XGB, and DNN models trained on dataset B, and the Tree, RF, GB, LGB, XGB, SVM, and DNN models trained on dataset C. The R 2 were consistently higher for the models trained on dataset B than for those trained on dataset A, and were consistently higher for the models trained on dataset C than those trained on datasets A and B (Supplemental Figure 2a).
The predictions of the models trained on dataset A were positively shifted from the D-LDLC values but no shifts were observed for the models trained on dataset C. The convergences of the LoA ranges were similar to those of the R 2 (Supplemental Figure 2b).
Comparison between M-LDLC values and values predicted values by nine machine learning models on the test dataset
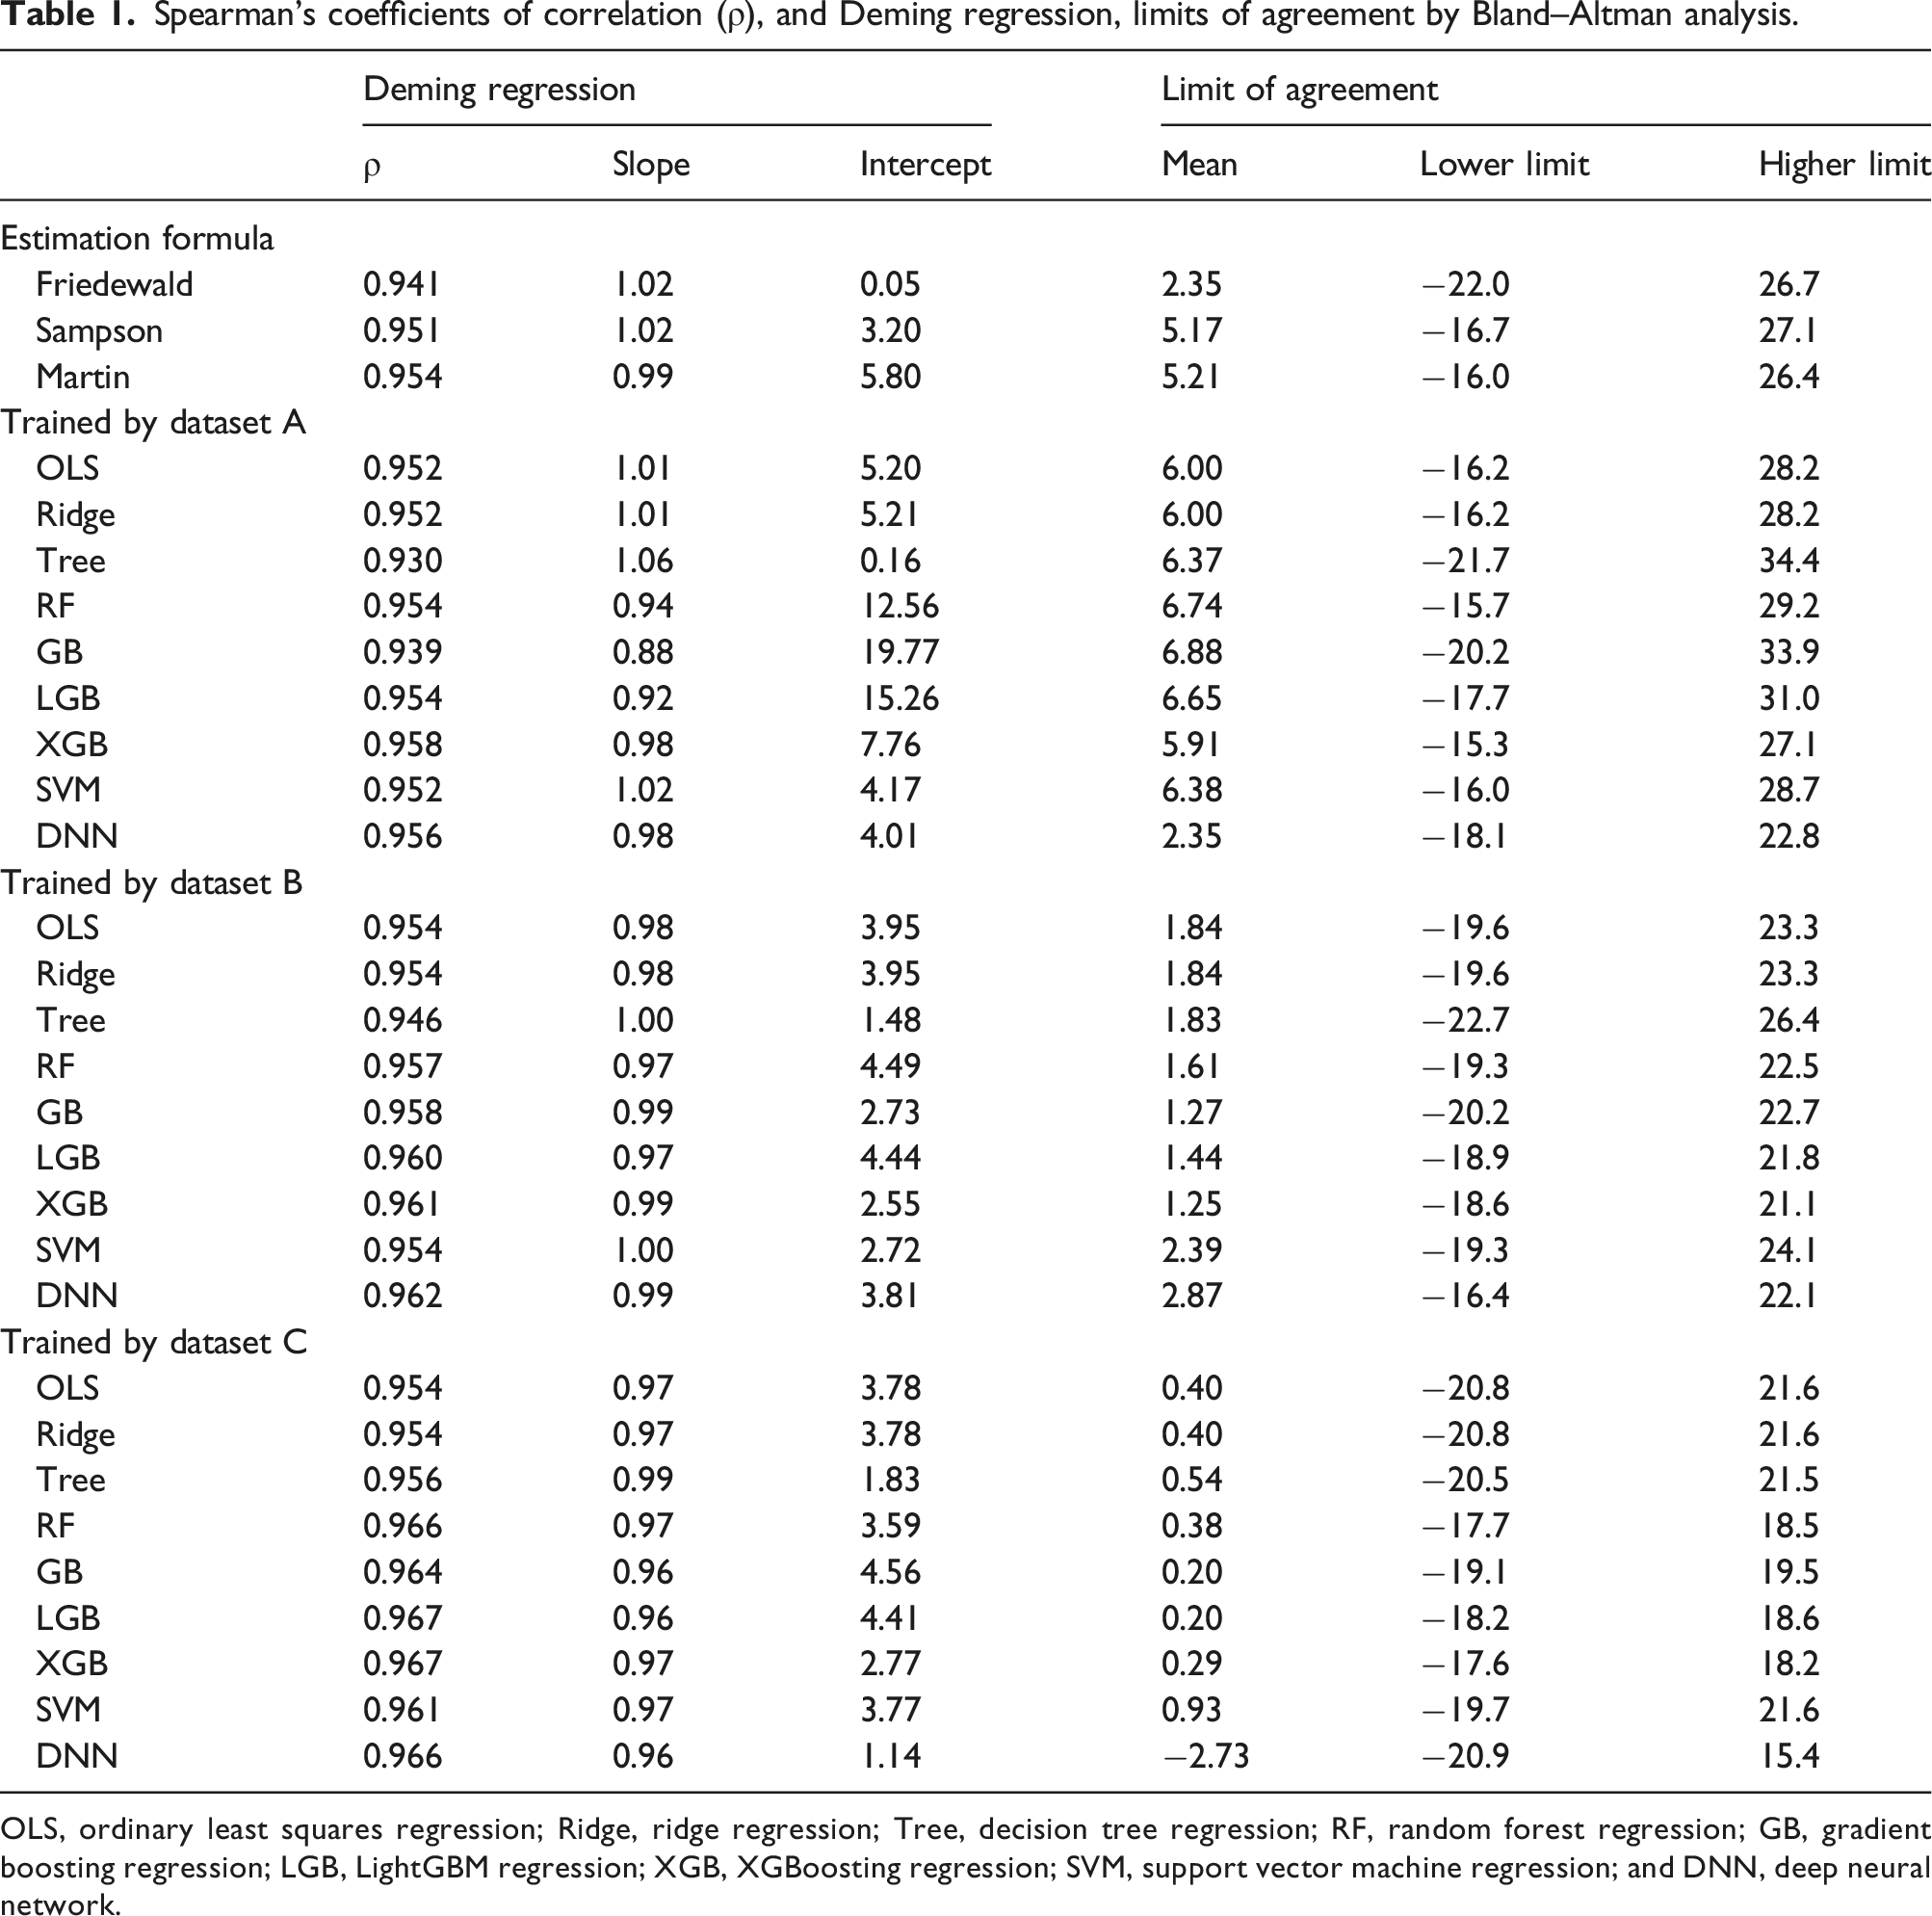
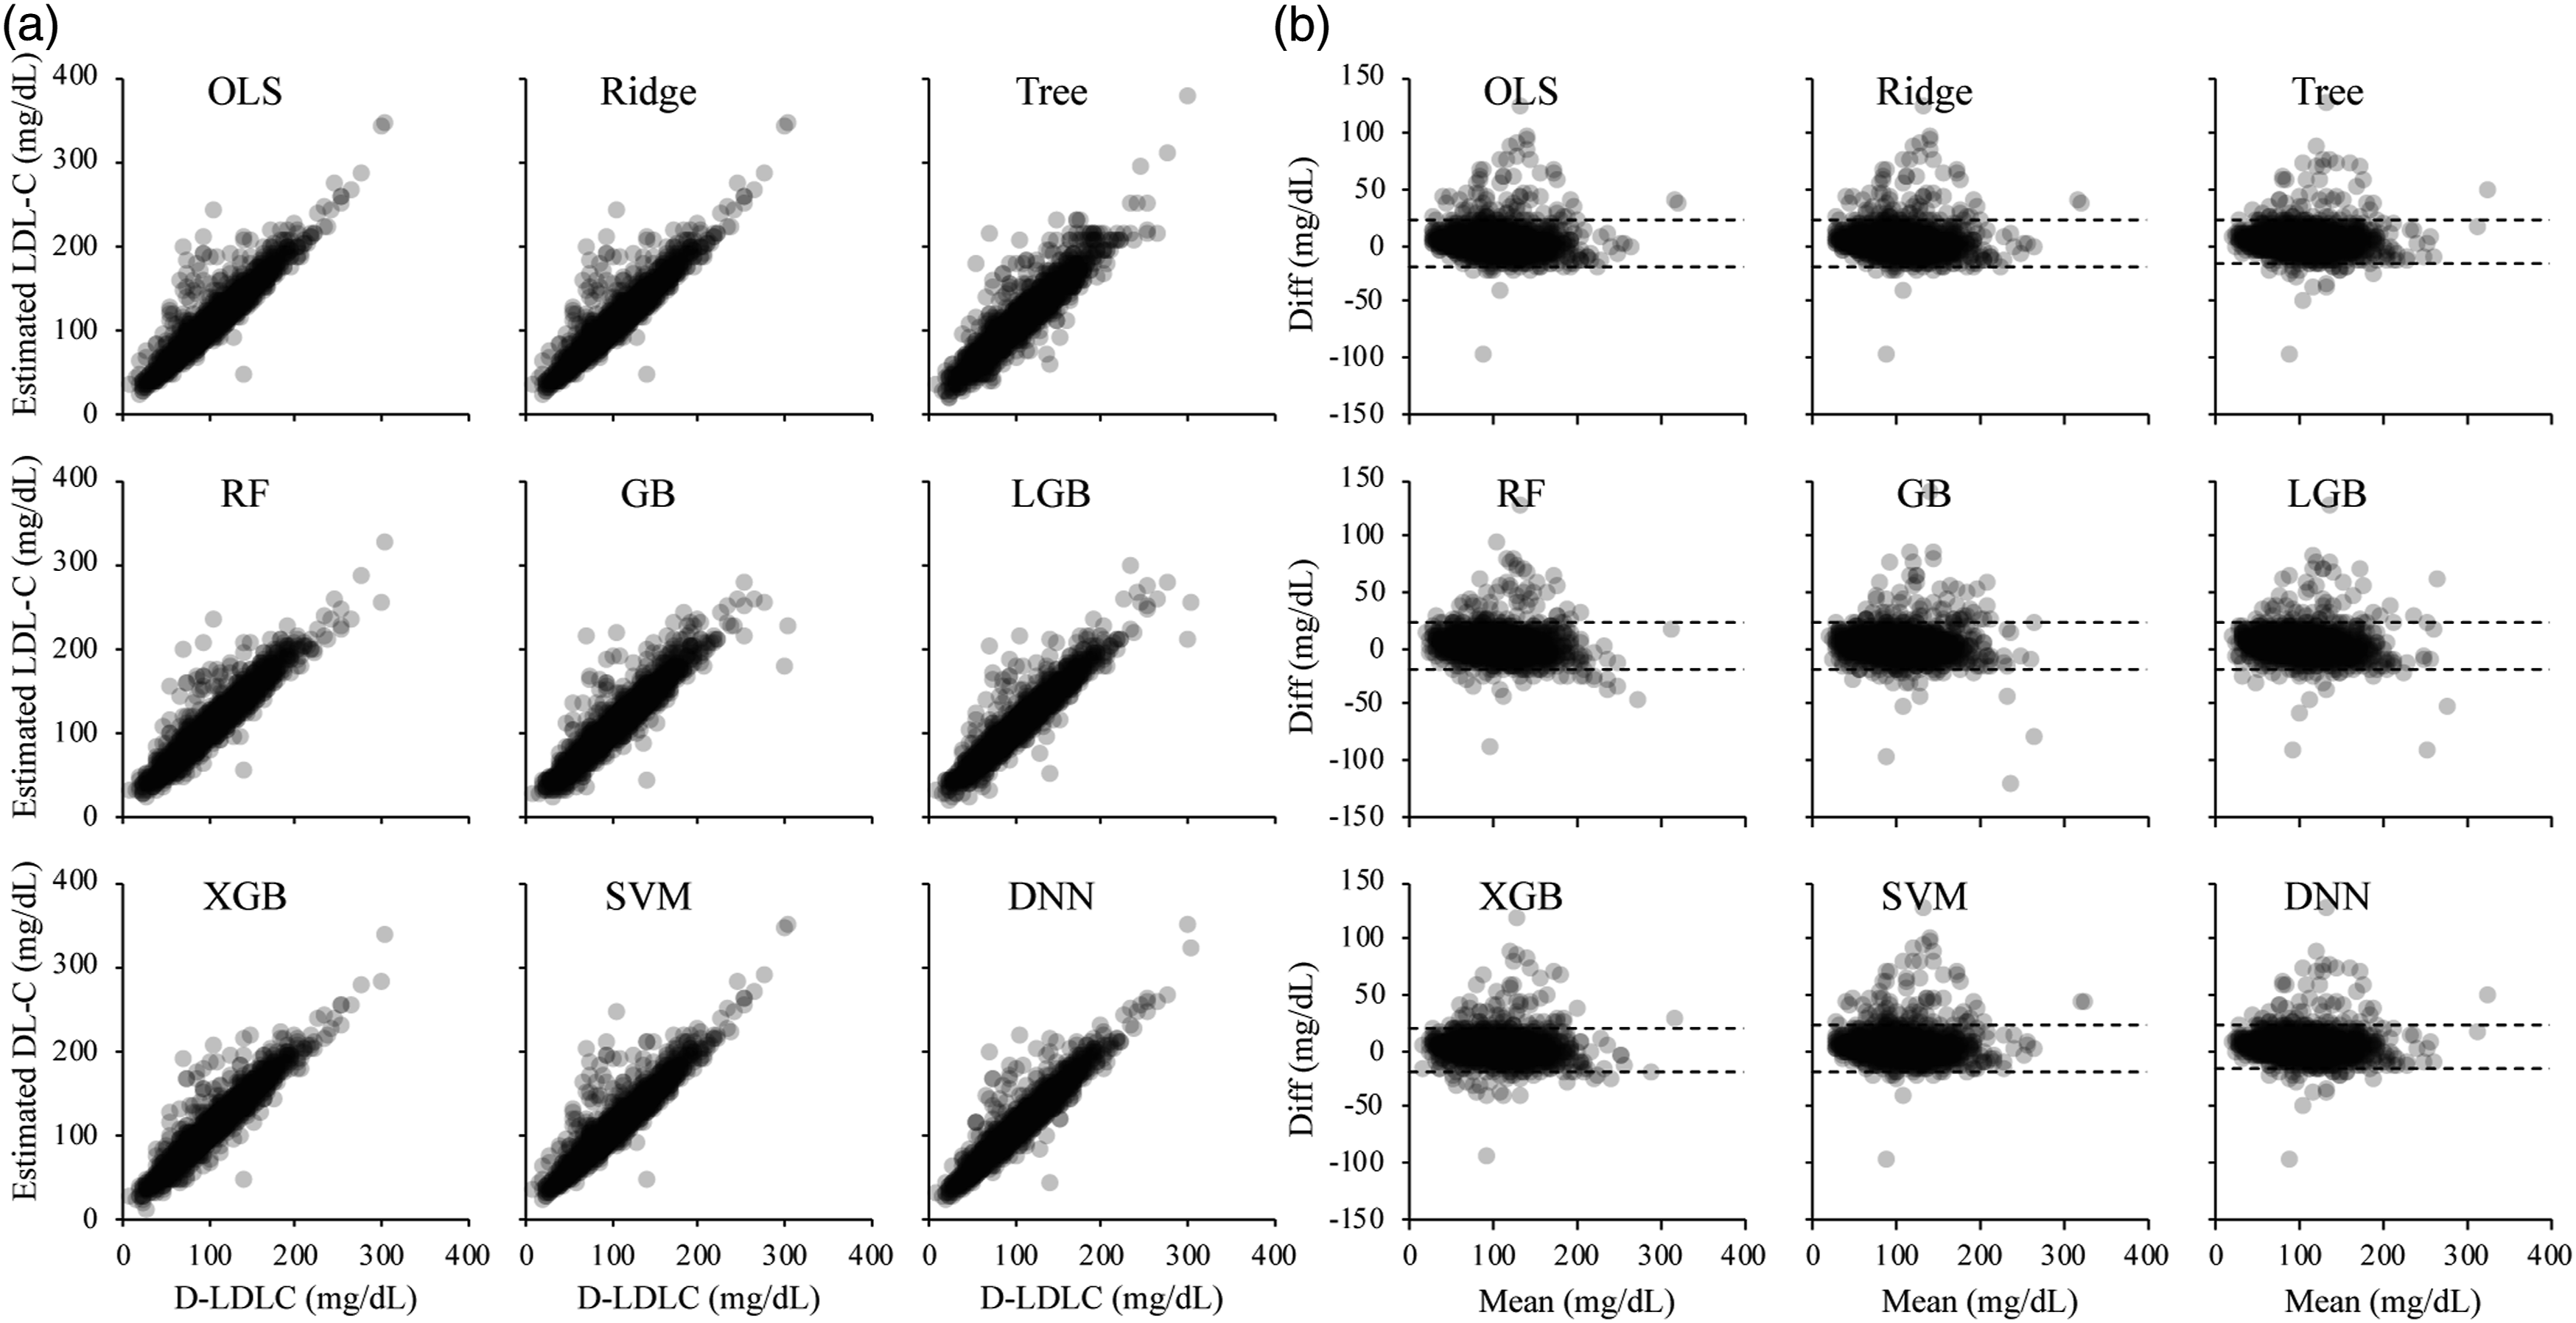
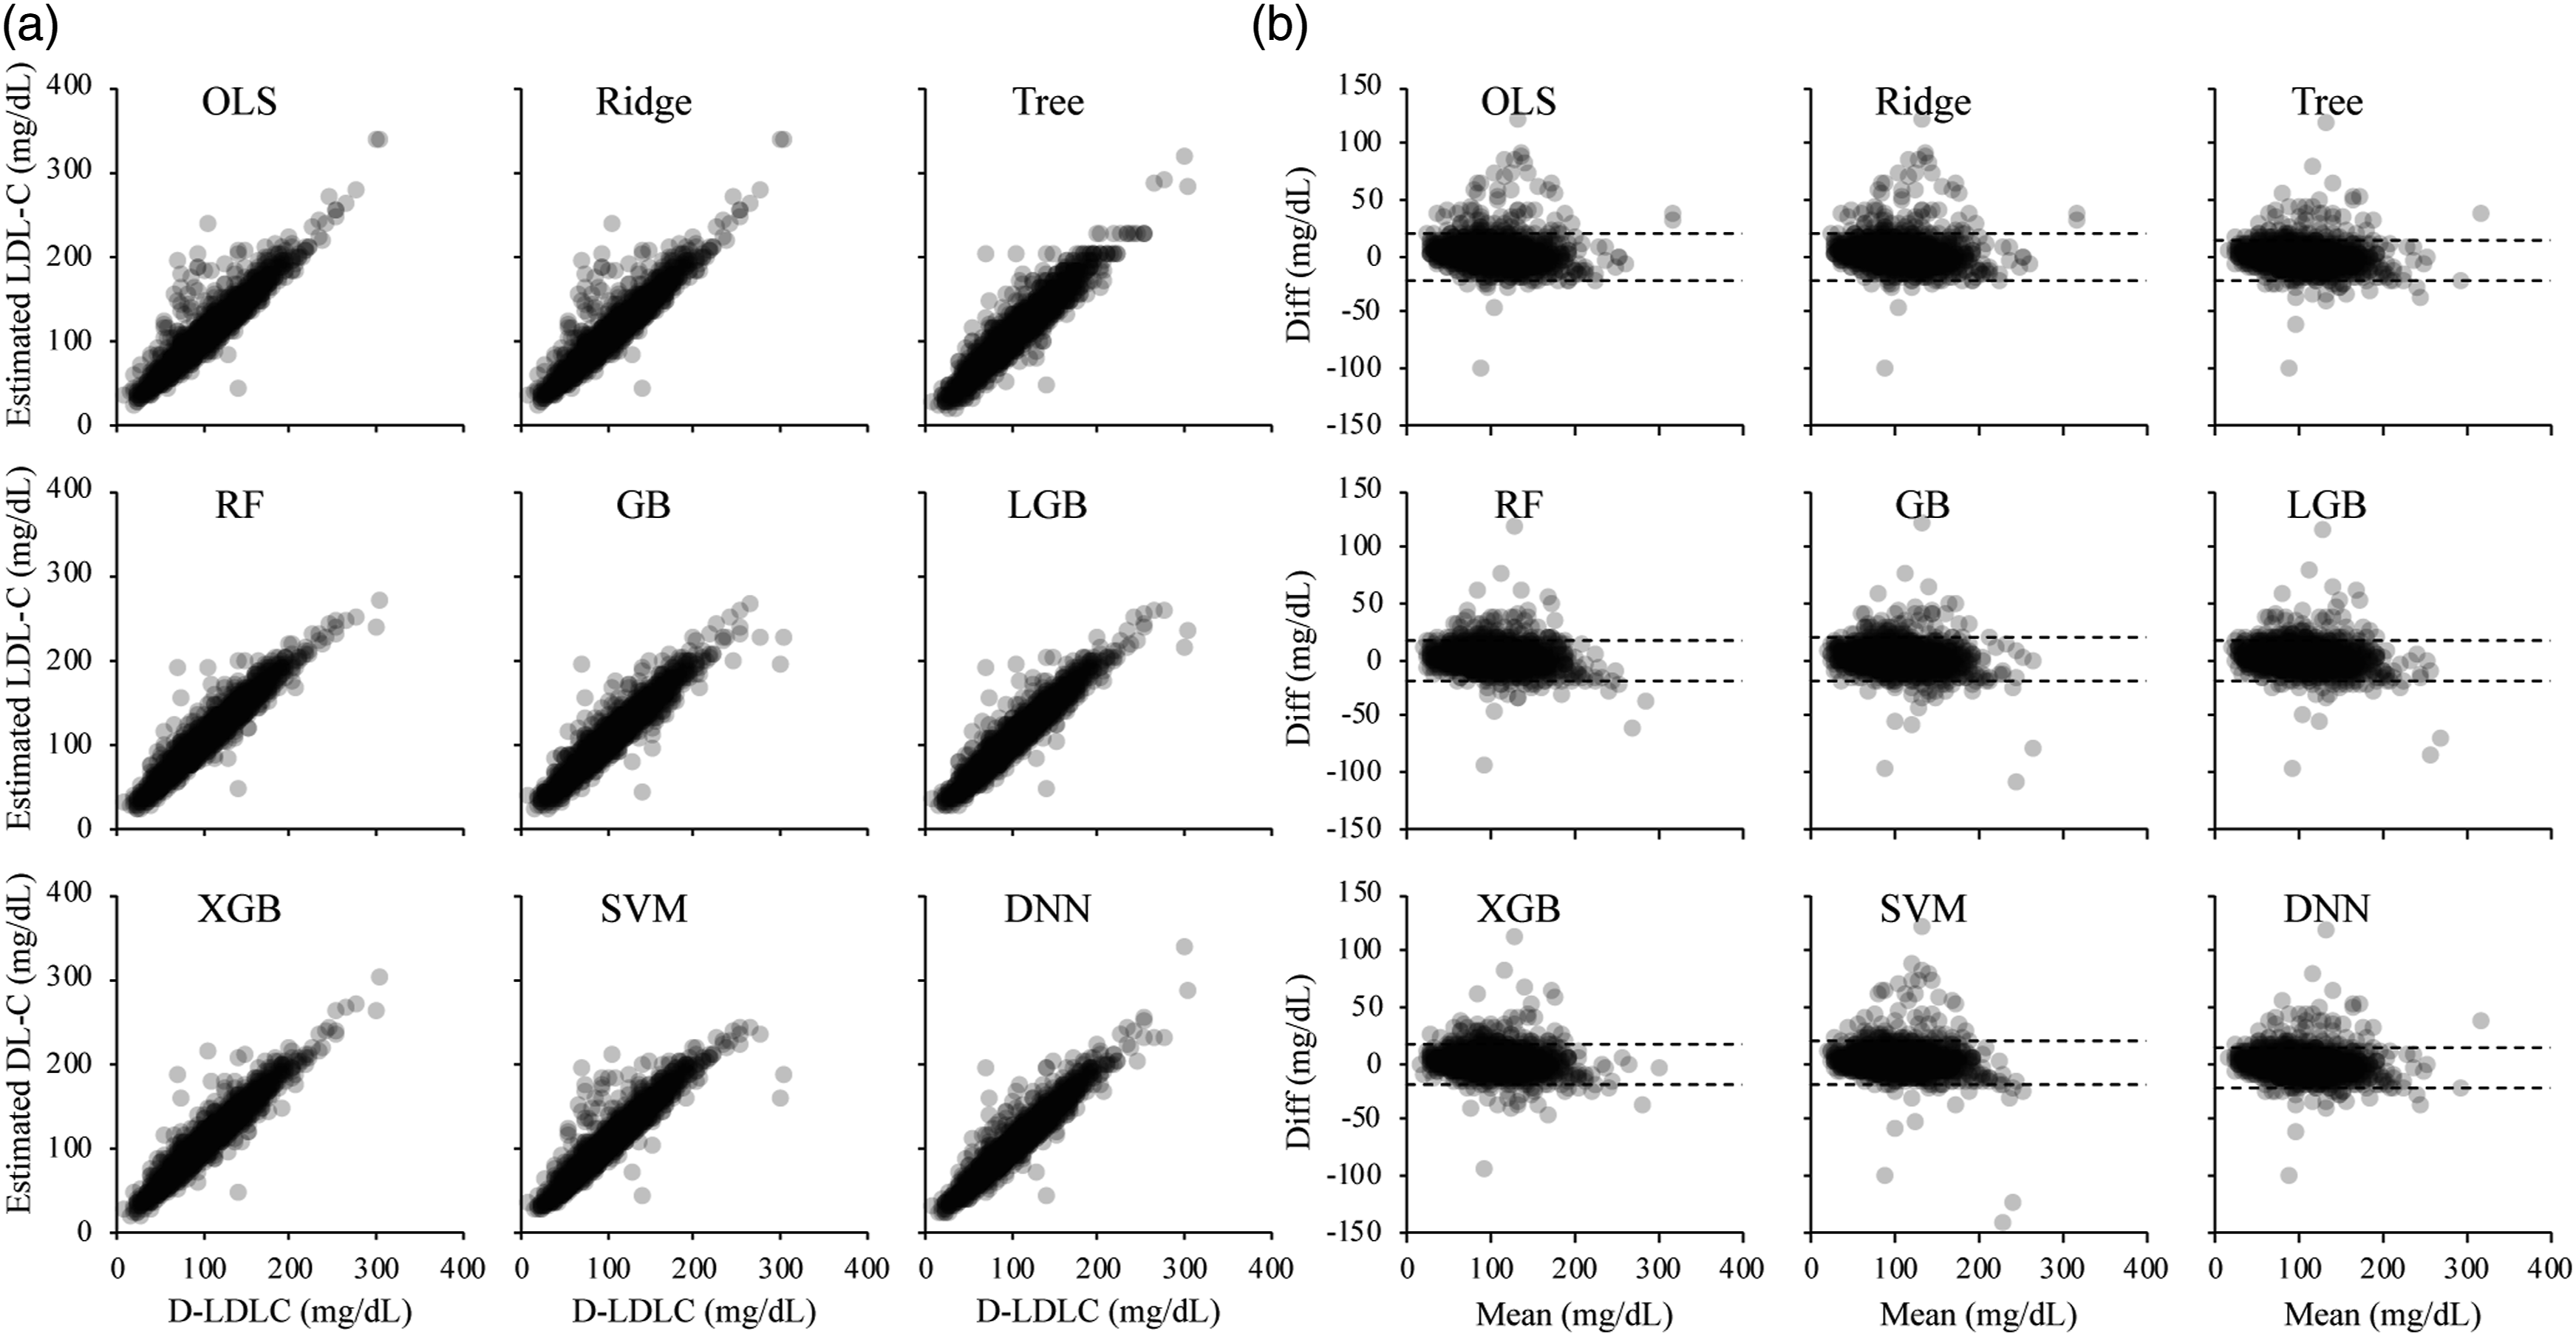
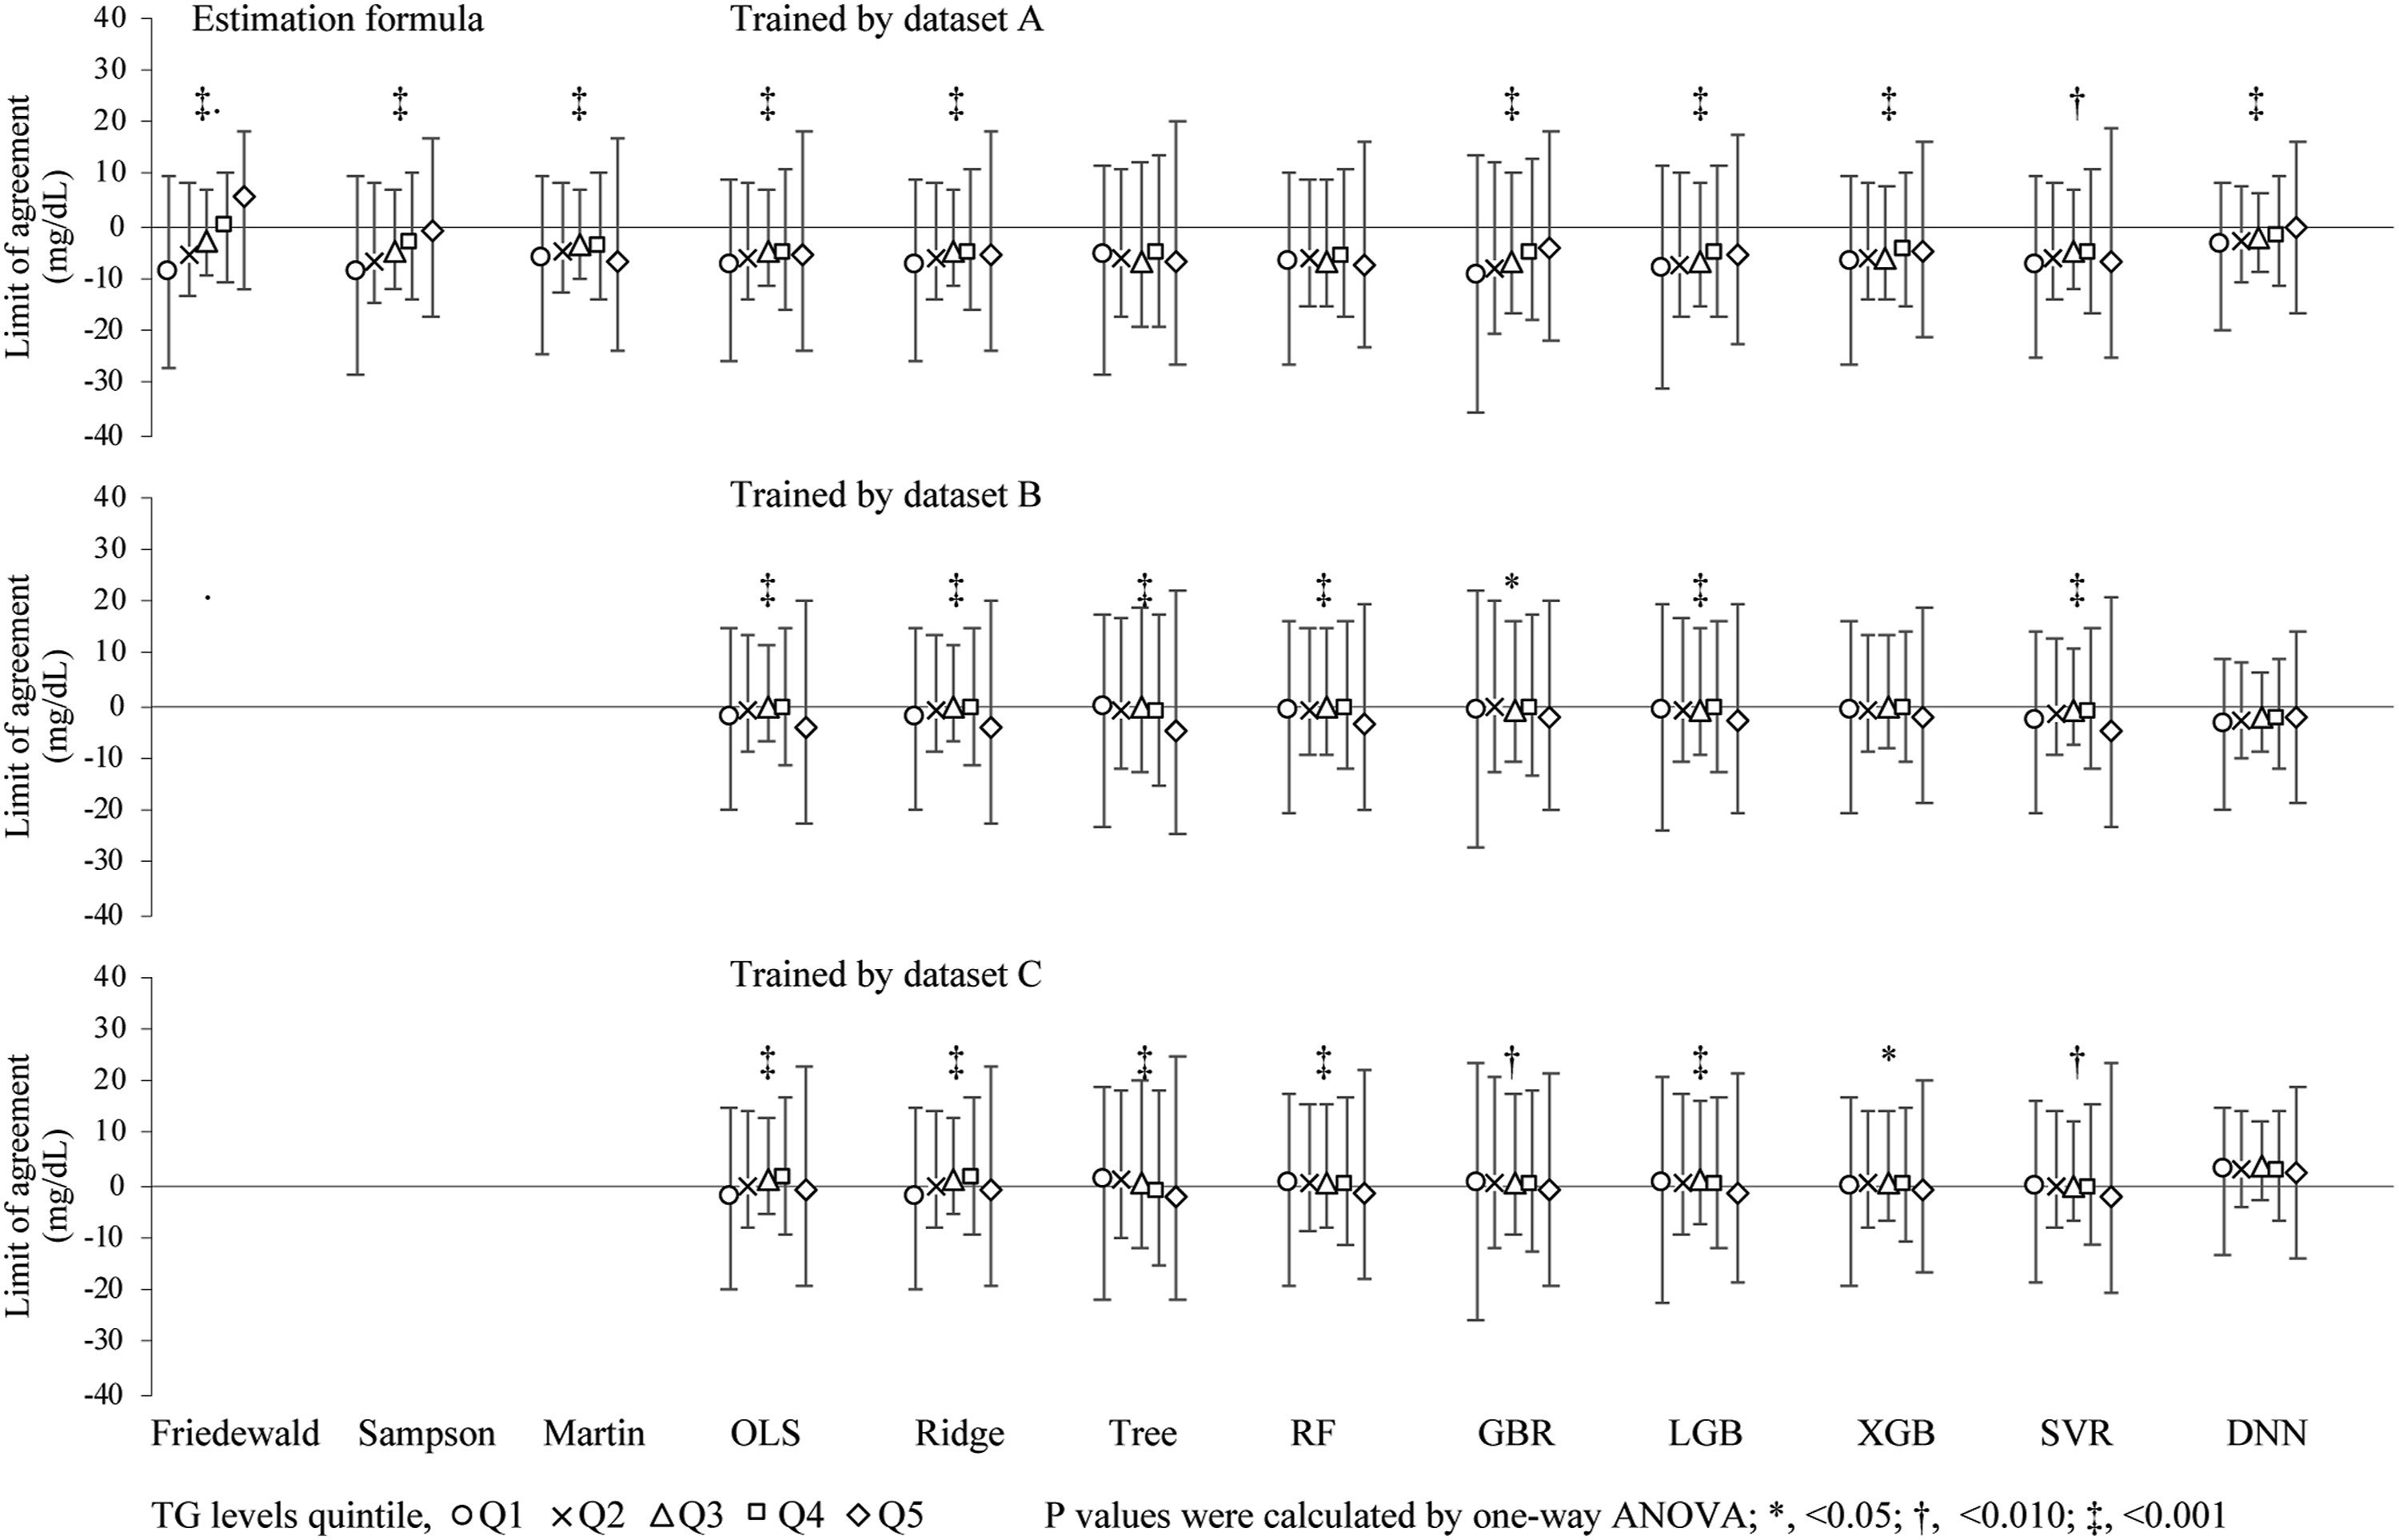
The M-LDLC values better converged to the D-LDLC values than the F-LDLC values, but the S-LDLC and M-LDLC values best converged to the D-LDLC values in many cases (Supplemental Figure 2). We predicted the LDL-C values on the test dataset using the nine machine learning models pre-trained on dataset A and compared them with the D-LDLC values (Figure 1). The values predicted by each model showed positive mean differences from the D-LDLC, and many cases were outliers of the high values (Table 1). The RF, GB, and LGB models trained on dataset A produced sigmoidal scatter plots that shifted positively and negatively in the low and high D-LDLC ranges, respectively. The predictions of the machine learning models trained on dataset B also included many positive outliers from the D-LDLC values, but the outliers were fewer than when the models were trained on dataset A (Figure 2). The nine models were similar with no outstanding characteristics. Moreover, the models trained on dataset C converged better than the models trained on dataset A and contained fewer biases of the difference from the D-LDLC values (Figure 3). The RF, GB, LGB, XGB, SVM, and DNN models yielded higher Spearman’s correlation coefficients than M-LDLC. Among the models, the DNN model showed a negative mean difference from D-LDLC but the other models were less biased and their LoA ranges were more convergent than those of models trained on the other datasets (Table 1). These results were obtained not only for the cases overall but also for those with TG <400 mg/dL, which is the limit for using the Friedewald formula (Supplemental Table 1). We also compared the LoA between the D-LDC and estimated LDL-C at each TG-level quintile. The mean difference between the D-LDC LoAs and those estimated by the F-LDLC and S-LDLC increased with increasing TG level. Overall, the LoA widths were larger in the TG Q1 and Q5 groups than in the Q2, Q3, and Q4 groups (Figure 4). Scatter plots (a) and Bland–Altman plots (b) of the test dataset for LDL-C measured by the direct method (D-LDLC) versus the LDL-C values estimated by a machine learning model trained on the training dataset A. OLS, ordinary least squares regression; Ridge, ridge regression; Tree, decision tree regression; RF, random forest regression; GB, gradient boosting regression; LGB, LightGBM regression; XGB, XGBoosting regression; SVM, support vector machine regression; and DNN, deep neural network. Spearman’s coefficients of correlation (ρ), and Deming regression, limits of agreement by Bland–Altman analysis. OLS, ordinary least squares regression; Ridge, ridge regression; Tree, decision tree regression; RF, random forest regression; GB, gradient boosting regression; LGB, LightGBM regression; XGB, XGBoosting regression; SVM, support vector machine regression; and DNN, deep neural network. Scatter plots (a) and Bland–Altman plots (b) of the test dataset for LDL-C measured by the direct method (D-LDLC) versus the LDL-C values estimated by a machine learning model trained on the training dataset B. OLS, ordinary least squares regression; Ridge, ridge regression; Tree, decision tree regression; RF, random forest regression; GB, gradient boosting regression; LGB, LightGBM regression; XGB, XGBoosting regression; SVM, support vector machine regression; and DNN, deep neural network. Scatter plots (a) and Bland–Altman plots (b) of the test dataset for LDL-C measured by the direct method (D-LDLC) versus the LDL-C values estimated by a machine learning model trained on the training dataset C. OLS, ordinary least squares regression; Ridge, ridge regression; Tree, decision tree regression; RF, random forest regression; GB, gradient boosting regression; LGB, LightGBM regression; XGB, XGBoosting regression; SVM, support vector machine regression; and DNN, deep neural network. Limits of agreement between D-LDLC and machine learning–estimated LDL-C in different triglyceride (TG) quintile levels. The TG quintile levels were grouped as follows: <69.0 mg/dL (Q1); 69.0–95.9 ng/mL (Q2); 96.0–125.9 ng/mL (Q3); 126.0–171.9 mg/dL (Q4); ≥172.0 mg/dL (Q5). The D-LDLC and LDL-C values were measured using the direct method. The symbols are defined in the caption of Figure 1.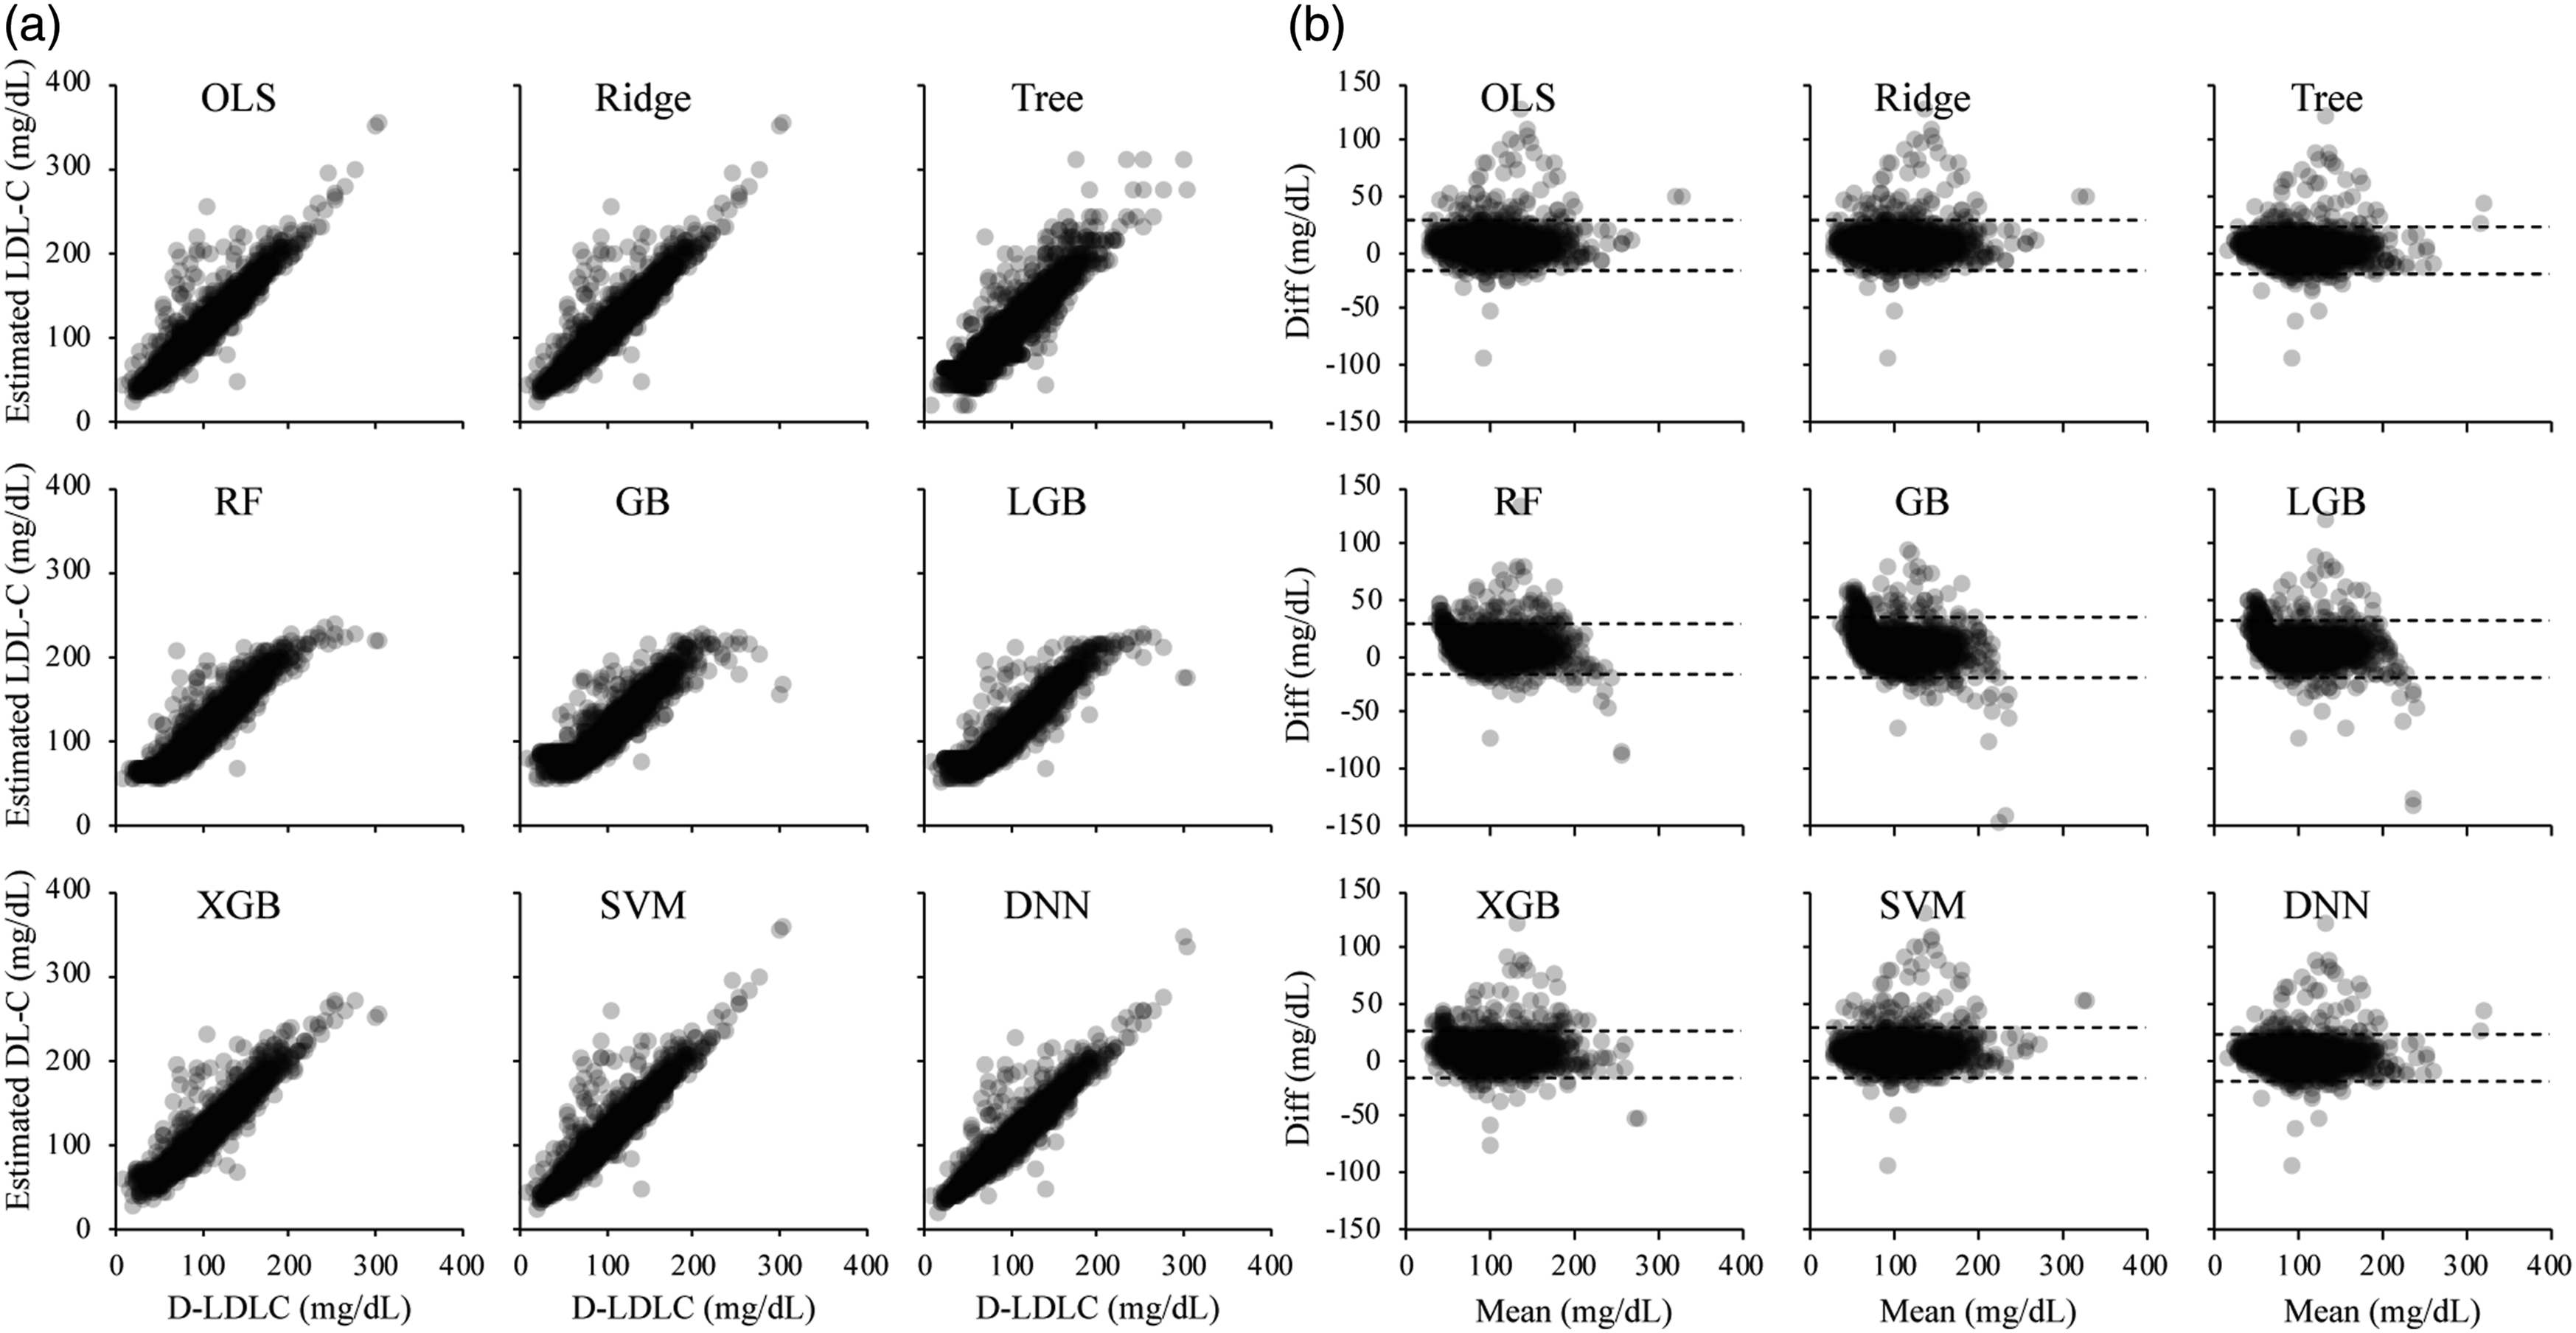
Under- and overestimation rates of the estimated LDL-C values in the 2019 ESC/EAS Guidelines classification of LDL-C
Each of the D-LDLC and LDL-C values estimated by the formulas and machine learning models were classified into the 2019 ESC/EAS Guidelines categories of LDL-C, which were verified to agree with the categories of D-LDLC. Relative to the D-LDLC, the overall average underestimation rates of F-LDLC, M-LDLC, and S-LDLC were lower than 13.5%, higher than 3.7%, and higher than 6.5%, respectively. The D-LDLC was underestimated by 5.4%, 8.9%, and 11.5% for the models trained on datasets A, B, and C, respectively. The underestimation rates of the LDL-C levels did not significantly differ among the models. In contrast, the overall overestimation rates of F-LDLC, S-LDLC, and M-LDLC (relative to D-LDLC) were 14.8%, 18.8%, and 20.9%, respectively, increasing to 29.7%, 14.7%, and 10.3% for the models trained on datasets A, B, and C, respectively. The overestimation rates of the tree-based models (GB) trained on dataset A were higher in the low range of LDL-C levels than in the high range. Most of the other models and models trained on datasets B or C yielded the highest overestimation rates of LDL-C ≥190 mg/dL (Figure 5). Under- and overestimation rates in LDL-C classifications on the 2019 ESC/EAS Guideline. D-LDLC and LDL-C values were measured by the direct method. The symbols are defined in the caption of Figure 1.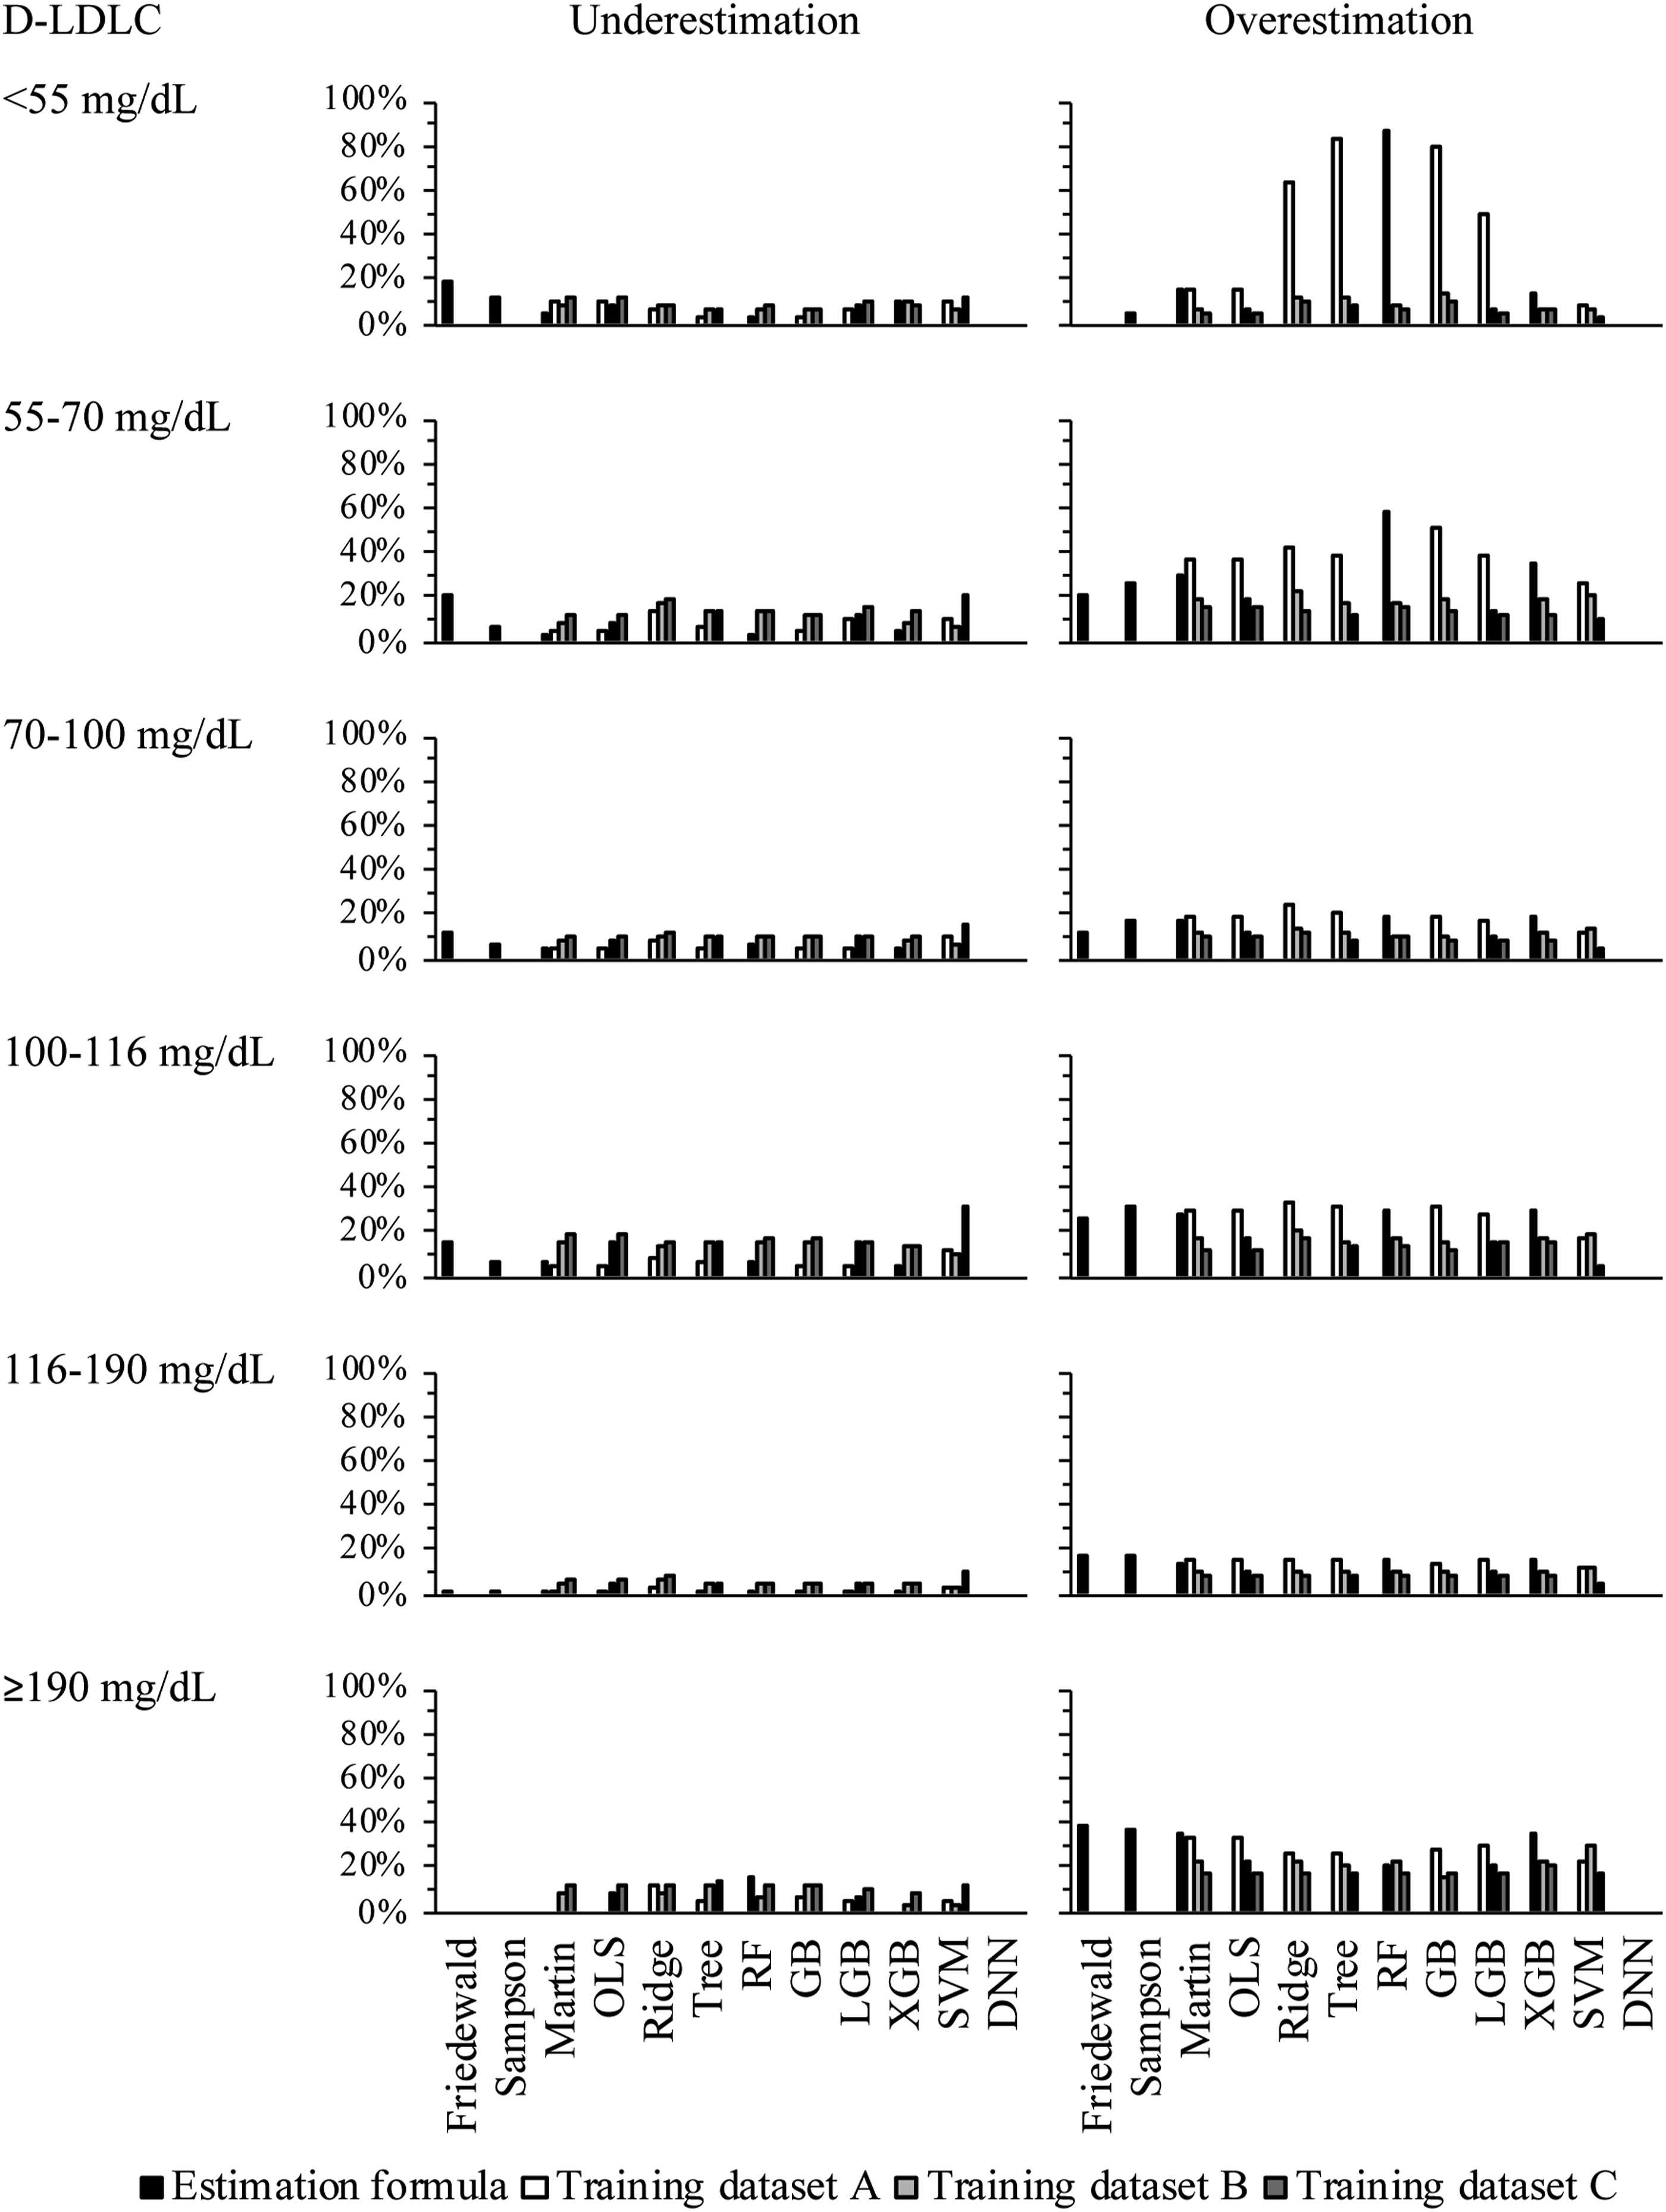
Discussion
This study aimed to validate the feasibility of LDL-C estimation by machine learning. The LDL-C estimation models were trained on training datasets with three different characteristics. The cross-validations on the training datasets did not significantly differ among the created models. The validation of the test dataset revealed that some machine learning models achieved higher R 2 than F-LDLC and M-LDLC. The models trained on dataset C (whose population was the same as the test dataset) obtained better LoA means differences and range convergences to D-LDLC than the models trained on datasets A and B. The present study had several limitations. First, our results were not compared with those of the BQ method, the standard method used by the Centers for Disease Control and Prevention. Second, as the amount of data for machine learning differed among the training datasets, increasing the amount of data may lead to inconsistent results. Third, the machine learning was limited to TC, HDL-C, and TG; using a higher number of parameters might improve the accuracy of our methods.
Several reports have confirmed the accuracy of LDL-C estimation by machine learning models, but most of these reports used single-center data to create and validate their models. Singh et al. created RF models on 80% of a dataset containing the lipid profiles of 17,500 individuals. 22 Cubukcu et al. created a linear regression model, gradient-boosting trees, and artificial neural network models on 80% of a training dataset containing the data of 59,415 individuals. 23 Kwon et al. created DNN models on 70% of the data of 129,930 individuals contained in two cohort datasets. 26 Ghayad et al. built k-nearest neighbour models on 31,853 retrospective data samples and validated them on 6599 prospective data samples. 25 Fan et al. trained their models on the data of 111,448 individuals and performed external validation on other datasets obtained from 3,188, 1,300, and 17,500 individuals. 24 The models in each study outperformed the Friedewald formula and Martin method. However, whether differences among the training datasets affected the performance on the test dataset have not been validated.
In this study, we evaluated the fitness of each model derived from three datasets and found no considerable difference between the R 2 of M-LDLC and those of OLS-LDLC and Ridge-LDLC trained on any of the three datasets. The R 2 results of the models other than OLS and Ridge were lowest, intermediate, and highest after training on datasets A, B, and C, respectively. In terms of R 2 , the XGB and DNN models trained on dataset A, the RF, GB, LGB, XGB, and DNN models trained on dataset B, and the Tree, RF, GB, LGB, XGB, SVM, and DNN models trained on dataset C outperformed the M-LDLC. Meanwhile, the DNN model trained on dataset A, the RF, LGB, XGB, and DNN models trained on dataset B, and all models trained on dataset C obtained lower LoA values than M-LDLC. Moreover, the mean differences from D-LDLC ranged from 2.3 to 6.9 mg/dL for the models trained on dataset A, from 1.2 to 2.9 mg/dL for the models trained on dataset B, and from −2.7 to 0.9 mg/dL for the models trained on dataset C. In the F-LDLC and D-LDLC, the mean differences from d-LDLC were 2.4 and 5.2 mg/dL, respectively. Furthermore, this study suggested that LDL-C estimation by machine learning was less affected by the TG level than F-LDLC. These differences can plausibly be attributed to differences among the dataset characteristics. Dataset A is based on fasting blood samples from health check-up participants, whereas datasets B and C were collected from clinical patients. This difference might have contributed to bias and variability in the results. Difference among the agreement rates of the LDL-C classification in the 2019 ESC/EAS guideline was also observed. The models trained on dataset A obtained high overestimation rates in the low LDL-C-level range. In addition, the models trained on datasets A and B were overall inferior to those trained on dataset C. In summary, machine learning models for LDL-C prediction can outperform the Martin method, but may require training on a dataset that matches the characteristics of the subjects. In this study, we created machine learning models of nine methods for LDL-C estimation. The OLS model is a basic regression analysis that assumes a linear relationship between the objective variable and explanatory variables.28,29 The Ridge model is an improved version of the OLS, which can prevent overfitting and improves the fitting to the training data.28,29 However, the performance of this model degrades when the objective variable is non-linearly related to the explanatory variables.28,29 The tree regression model creates a tree based on data splits and predicts the mean value at each leaf node. The RF and GBR are ensemble learning models. RF combines multiple decision trees and can prevent overfitting, whereas GBR minimizes the error by successively improving the decision tree. The LGB and XGB models improve the GBR model by enabling high-speed scalable learning.30–32 These decision tree-based models can capture nonlinear relationships and are effective for data with complex relationships. The SVM model also captures nonlinear relationships between the objective variable and the explanatory variables by finding the optimal decision boundary.28,29 The DNN model combines multiple layers of neurons to capture nonlinear relationships. 33 A DNN performs well on large amounts of data, but its results are difficult to interpret than linear regression results. In the present study, the nonlinear regression models (especially the XGB and DNN model) outperformed the linear regression model.
The TC, HDL-C, LDL-C, and TG indices, which are widely used in general clinical practice, are affected by age.34,35 A previous study suggested that adding age and gender to machine learning models improve the robustness and reliability of detection. 24 As machine learning can readily handle more items and data sources, we recommend the building of models that are independent of facility patients and characteristics, along with more accurate and generalizable methods. In this study, we verified the applicability of LDL-C predictive machine learning models created from three subject groups with different backgrounds. Ideally, the model should be created using datasets with the same background, but our datasets were not created and verified as a single large dataset. In the future work, the machine learning model should be built and verified on a larger dataset that does not depend on the patient backgrounds.
Conclusion
In the present study, machine learning models for LDL-C estimation were built on the basis of three datasets with different characteristics. The models were then evaluated. Machine learning methods are valuable tools in LDL-C estimation but their applicability depends on the dataset used for training. In the future work, we should create a model using a dataset that does not depend on patient background and verify its clinical usefulness.
Supplemental Material
Supplemental Material - Dataset dependency of low-density lipoprotein-cholesterol estimation by machine learning
Supplemental Material for Dataset dependency of low-density lipoprotein-cholesterol estimation by machine learning by Ishida Hidekazu, Hiroki Nagasawa, Yasuko Yamamoto, Hiroki Doi, Midori Saito, Yuya Ishihara, Takashi Fujita, Mariko Ishida, Yohei Kato, Ryosuke Kikuchi, Hidetoshi Matsunami, Masao Takemura, Hiroyasu Ito, and Kuniaki Saito in Annals of Clinical Biochemistry
Supplemental Material
Supplemental Material - Dataset dependency of low-density lipoprotein-cholesterol estimation by machine learning
Supplemental Material for Dataset dependency of low-density lipoprotein-cholesterol estimation by machine learning by Ishida Hidekazu, Hiroki Nagasawa, Yasuko Yamamoto, Hiroki Doi, Midori Saito, Yuya Ishihara, Takashi Fujita, Mariko Ishida, Yohei Kato, Ryosuke Kikuchi, Hidetoshi Matsunami, Masao Takemura, Hiroyasu Ito, and Kuniaki Saito in Annals of Clinical Biochemistry.
Footnotes
Declaration of conflicting interests
The author(s) declared no potential conflicts of interest with respect to the research, authorship, and/or publication of this article.
Funding
The author(s) disclosed receipt of the following financial support for the research, authorship, and/or publication of this article: This research was supported by Fujita Health University Graduate School.
Ethical approval
Gifu University Hospital Clinical Research Ethics Board (2021-A059) and the Fujita Health University Research Ethics Board (FM21-093) approved this study.
Guarantor
KS.
Contributorship
HI, YY, and TM researched literature and conceived the study. HI gained ethical approval and wrote the first draft of the manuscript. HI, HN, YY, and TM involved in the investigation and data analysis. HD, MS, YI, TF, MI, YK, RK, HM, MT, and TH involved in the supply of clinical laboratory data. HI and KS involved as supervision and project administration. All authors reviewed and edited the manuscript and approved the final version of the manuscript.
Supplemental material
Supplemental material for this article is available online.
References
Supplementary Material
Please find the following supplemental material available below.
For Open Access articles published under a Creative Commons License, all supplemental material carries the same license as the article it is associated with.
For non-Open Access articles published, all supplemental material carries a non-exclusive license, and permission requests for re-use of supplemental material or any part of supplemental material shall be sent directly to the copyright owner as specified in the copyright notice associated with the article.