
Abstract
Background
LDL-C is a strong risk factor for cardiovascular disorders. The formulas used to calculate LDL-C showed varying performance in different populations. Machine learning models can study complex interactions between the variables and can be used to predict outcomes more accurately. The current study evaluated the predictive performance of three machine learning models—random forests, XGBoost, and support vector Rregression (SVR) to predict LDL-C from total cholesterol, triglyceride, and HDL-C in comparison to linear regression model and some existing formulas for LDL-C calculation, in eastern Indian population.
Methods
The lipid profiles performed in the clinical biochemistry laboratory of AIIMS Bhubaneswar during 2019–2021, a total of 13,391 samples were included in the study. Laboratory results were collected from the laboratory database. 70% of data were classified as train set and used to develop the three machine learning models and linear regression formula. These models were tested in the rest 30% of the data (test set) for validation. Performance of models was evaluated in comparison to best six existing LDL-C calculating formulas.
Results
LDL-C predicted by XGBoost and random forests models showed a strong correlation with directly estimated LDL-C (r = 0.98). Two machine learning models performed superior to the six existing and commonly used LDL-C calculating formulas like Friedewald in the study population. When compared in different triglycerides strata also, these two models outperformed the other methods used.
Conclusion
Machine learning models like XGBoost and random forests can be used to predict LDL-C with more accuracy comparing to conventional linear regression LDL-C formulas.
Introduction
Cardiovascular diseases are the leading cause of mortality globally. 1 People with cardiovascular disease or with high-risk factors require early detection and management. LDL cholesterol is established as one of the strongest predictors of cardiovascular diseases.2,3 As NCEP ATP III focuses on serum LDL-C level as the primary treatment target and basis for risk categorization, accurate laboratory estimation of LDL-C is very important. 4 The reference method for LDL-C estimation is beta quantification. But this technique involves complex handling techniques, requires a large sample volume, expensive, and needs long ultracentrifugation time. 5 Hence, beta quantification is not suited for routine laboratory evaluation.
Many laboratories use direct homogenous assays for LDL-C measurement. 6 Comparing with the reference method, many of these homogenous assays measure LDL-C with a sufficient degree of accuracy and precision. Still, these are also not performed routinely in clinical laboratories as many of such methods are costly. Instead, most clinical laboratories use Friedewald formula to calculate LDL-C. 7 It is simple, cost-effective, and widely used for routine LDL estimation as well as in many clinical studies. This formula has some limitations. It cannot be used for LDL-C calculation in a sample with triglycerides above 400 mg/dL and can be applied only in the fasting samples. 8 Several formulas have been developed to overcome these limitations. Formulas such as Chen, Vujovic, Anandaraja, Puavikai, Hatta, and Martin are used for LDL-C calculation.9–14 These formulas are validated in different populations and require further studies to be applied to the general population. Previous studies comparing these formulas with Friedewald formula gave contrasting results over different triglycerides levels.15–19
Most of these formulas were generated using linear regression. The advancement in data science made machine learning (ML) algorithms more popular in clinical researches also. Machine learning models were already used to predict the risk for developing cardiovascular disease, 20 for delayed wound healing, 21 for predicting and stratifying early-onset neonatal sepsis, 22 and for predicting hypercholesterolemia. 23 Since in most cases there will be multiple dependent factors or risk factors that interact in a very complex manner resulting in the outcome, linear regression models sometimes fall short in these scenarios for the prediction of the outcomes. Machine learning algorithms are the best alternative approach to overcome these limitations. Machine learning models can learn the nonlinear and complex interactions between the dependent variables and thus can improve the prediction accuracy drastically. 24 Random forests model was used in a study to predict LDL-C, and the performance was found to better than Friedewald and Martin formulas. 25
In this light, we used three machine learning models—random forests, XGBoost, and support vector regression (SVR) models, to predict LDL-C from total cholesterol, triglyceride, and HDL-C in the eastern Indian population. We compared the LDL-C predicted by these models with directly estimated LDL-C. We also checked the predictive performance of these machine learning models comparing with a linear regression model and some existing formulas for LDL-C calculation.
Materials and methods
Study population
This study was conducted in the Department of Biochemistry of AIIMS Bhubaneswar as a retrospective comparative study. This study included the lipid profiles performed at the clinical biochemistry laboratory of AIIMS Bhubaneswar for the out-patients and in-patients between the time period 2019 January and 2021 March. Majority of the outpatients and inpatients of the institute are the residents of eastern Indian states, Odisha and West Bengal. The study was approved by the Ethics committee of AIIMS Bhubaneswar. Lipid profile data was collected from the laboratory database. Standard lipid profile analysis included the patient’s total cholesterol (TC), triglyceride (TG), HDL-C, and LDL-C on the same day. Lipid profile results with missing total cholesterol/triglycerides/HDL-C/LDL-C and results beyond the linearity limit of the specific assays used were excluded. If the same patient had undergone lipid profile test multiple times during the study period, only the first result was included in the dataset. After the review of the laboratory data, 13,391 lipid profiles were selected for the current study.
Lipid profile testing
All lipid profile parameters were measured on automatic chemistry analyzer Beckman Coulter AU 5800 of AIIMS Bhubaneswar clinical biochemistry laboratory. Total cholesterol (TC) was estimated using the enzymatic cholesterol oxidase/PAP method, while triglyceride (TG) was estimated using the enzymatic glycerol phosphate oxidase/ PAP method. HDL-C was measured by direct homogenous assays without precipitation (using anti-human β lipoprotein antibody). LDL-C was measured by a direct homogenous assay that uses a selective protective agent to separate LDL from chylomicrons, HDL-C, and VLDL and then estimated by Cholesterol oxidase/PAP method. All tests were performed using Beckman Coulter AU reagents and calibrators while used Bio-Rad quality control material.
Machine learning
Machine learning models were built using python library SciKit Learn. After data collection, the dataset was divided into a training dataset (70%) and a test dataset (30%). LDL values were set as target variables, whereas triglyceride, HDL, and total cholesterol were the independent variables. Three models were deployed, namely, random forest regressor, support vector regressor (SVR), and XG boost regressor. These models were initially trained with the training dataset. Then, the performance of these models was assessed on the test set. The evaluation was done with metrics like correlation and mean absolute difference (MAD).
Derivation of formula using linear regression
Most of the existing LDL calculating formulas are derived using linear regression analysis. So, we also applied multivariate linear regression in training data to find the relationship between directly estimated LDL-C, total cholesterol, triglycerides, and HDL-C. Formula derived using the multivariate linear regression is applied to test data. LDL-C calculated using this formula was compared with direct estimated LDL-C. Accuracy of the formula was evaluated and compared with ML models and six existing LDL calculation formulas.
LDL calculation formulas
Performance of LDL was estimated using machine learning algorithm and linear regression compared with some of the existing LDL calculation formulas. LDL-C was calculated using Friedewald, Martin, Chen, Vujovic, Anandaraja, and Puavikai formulas. To determine the LDL-C values as per the Martin equation, LDL calculator is used (http://www.LDL-Calculator.com). In the test data, for each patient, LDL was calculated using these formulas and compared to directly estimated LDL-C. The accuracy of these existing formulas to calculate the LDL-C was compared with the machine learning algorithm and formula generated using linear regression.
Statistical analysis
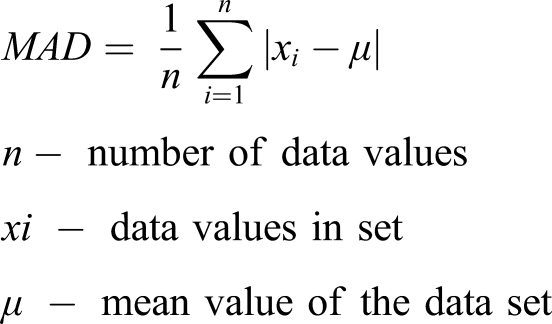
Statistical analysis was performed using SPSS. 13,391 lipid profile data were included in the study. Continuous variables are represented as mean and standard deviation. Collected data of 13,391 profiles were randomly divided into a training set (70% of total data) and test set (30% data). Thus, 9373 lipid profiles data were used to formulate the machine learning models and the rest 4018 lipid profiles were used to test the models. On the assumption that directly measured LDL-C is most accurate, LDL-C predicted using the three machine learning models, linear regression, and by the five existing formulas was compared to the directly measured LDL-C. Paired t-test was used for the comparison of means. Pearson correlation test is performed to assess the correlation of directly measured LDL-C with ML algorithm models, linear regression model, and six existing LDL-C calculating formulas. p-value <0.05 was taken as statistically significant. To check the accuracy of the ML models, linear regression formulas and existing LDL-C formulas, mean absolute difference (MAD) was calculated. MAD is the average of absolute deviations from the mean in a dataset. Models or formula having a low MAD score is better compared to those having a high MAD score.
We also assessed the performance of these models and formulas in classifying the patients to correct treatment groups as per NCEP ATP III guidelines. 2 Based on the directly estimated LDL-C, patients classified into groups—<100 mg/dL (Optimal), 100–129 mg/dL (near optimal/above optimal), 130–159 mg/dL (borderline high), 160–189 mg/dL (high) and ≥190 mg/dL (very high). If the patient was classified into the same treatment group with these models and formulas, it was taken as correctly classified. Percentage of patients classified correctly into appropriate treatment groups was calculated and compared. In order to check the accuracy of these models and formulas to classify the patients to correct treatment groups, confusion matrices were constructed. Accuracy of these models and formulas was calculated as the sum of correct classification divided by the total number of classifications.
Since many existing formula performances varied widely across different TG ranges, we classified the test data into four groups based on triglycerides (TG <100, TG 100–199, TG 200–399, TG ≥ 400). Performance of these machine learning models, linear regression formula, and existing formulas was assessed in these four groups.
Results
Characteristics of the Study Population (N = 13,391).
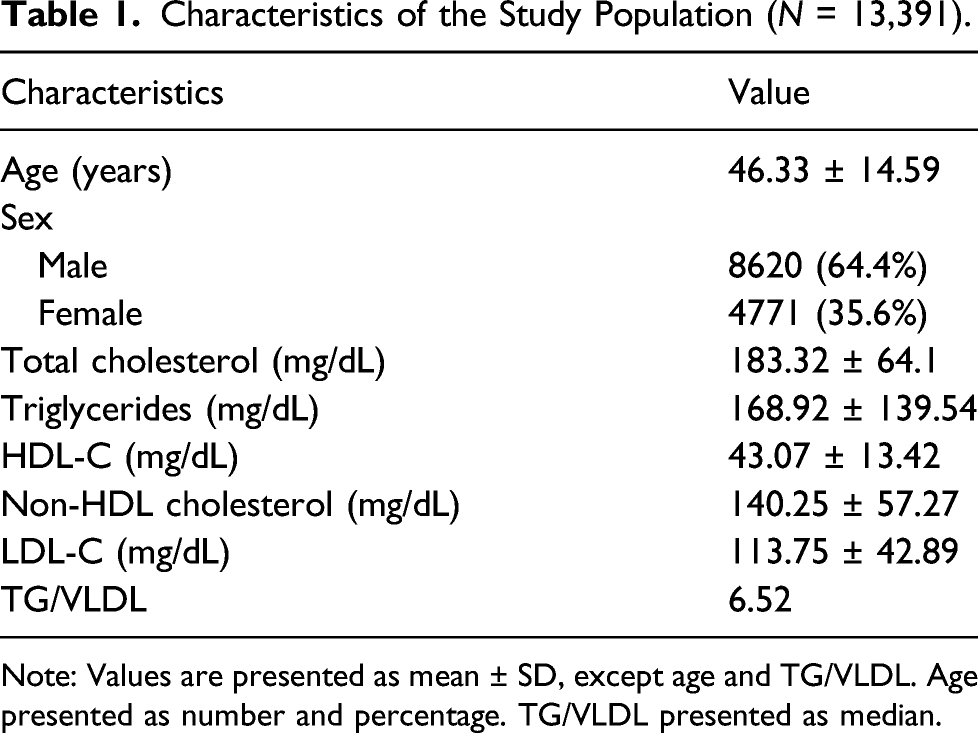
Note: Values are presented as mean ± SD, except age and TG/VLDL. Age presented as number and percentage. TG/VLDL presented as median.
Comparison of LDL-C predicted by different ML algorithms, linear regression, and different LDL-C formulas with directly measured LDL-C (N = 4018).
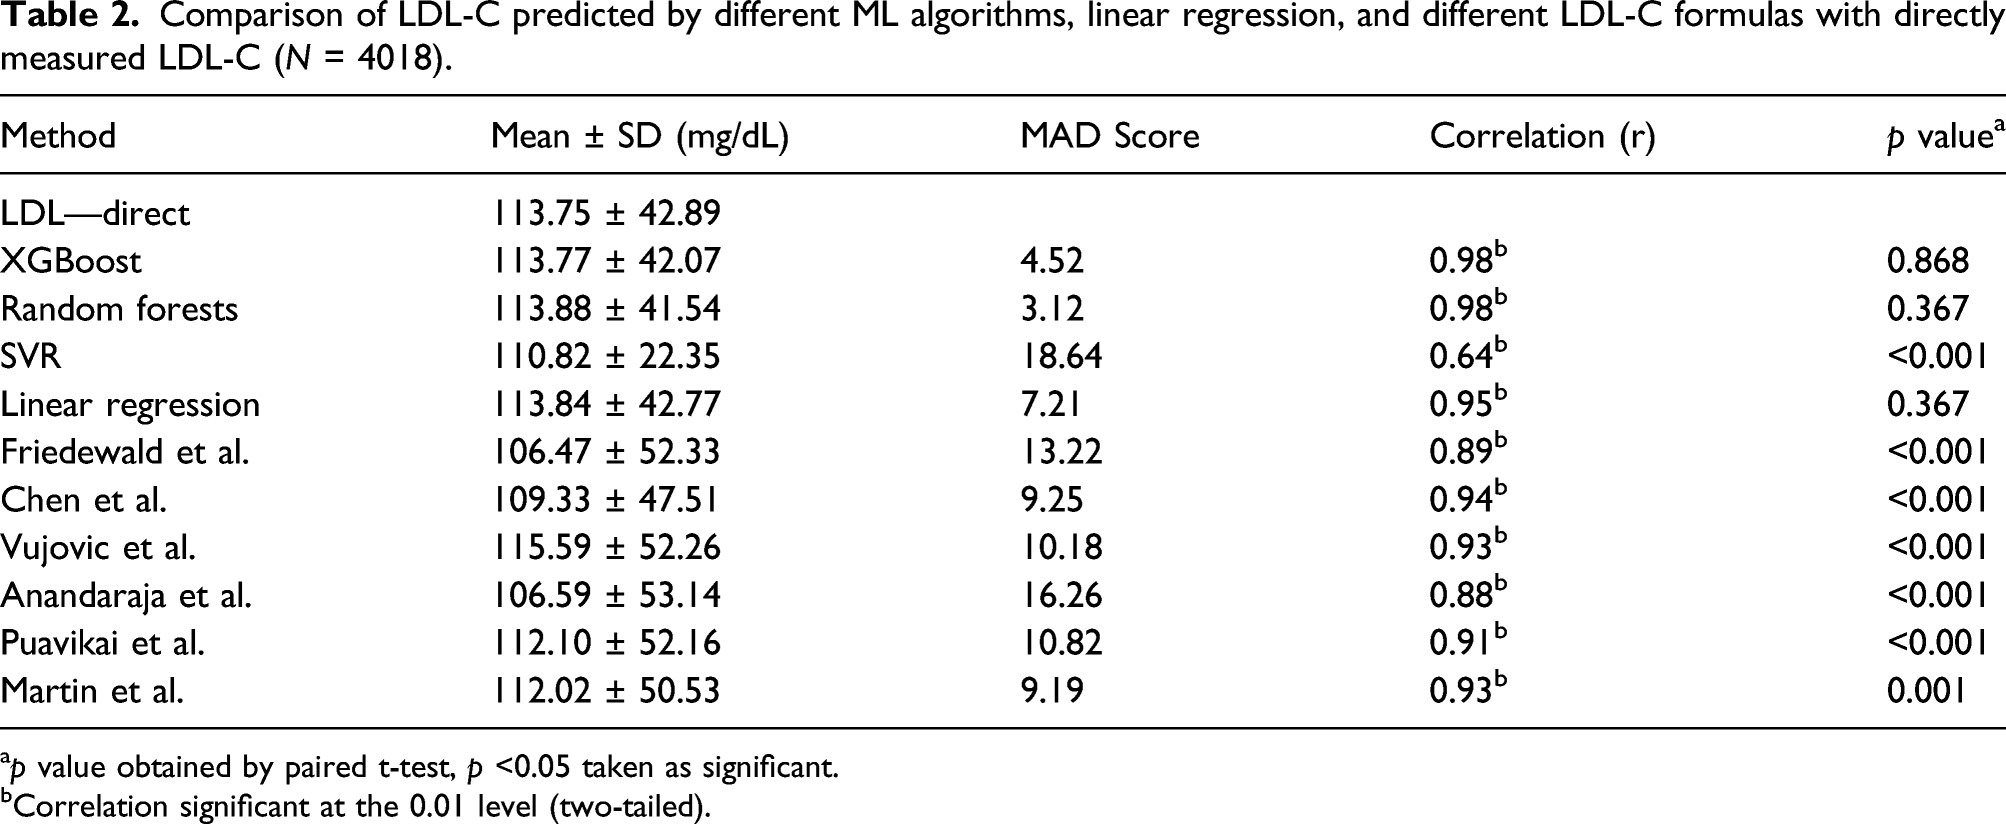
ap value obtained by paired t-test, p <0.05 taken as significant.
bCorrelation significant at the 0.01 level (two-tailed).
All three ML learning models used to predict LDL-C correlated significantly with directly estimated LDL-C. But among the three models, XGBoost and random forests model–predicted LDL-C showed a strong correlation with directly measured LDL-C. r value was 0.98 for both of these models. While SVR-predicted LDL-C showed a correlation coefficient of 0.64 only (Figure 1 and Table 2). With the training set, we generated a formula using multivariate linear regression analysis to calculate LDL-C from total cholesterol, triglycerides, and HDL-C. Formula was (0.80 × TC) − (0.66 × TG) − (0.73 × HDL) + 11.43. LDL-C calculated with this formula showed an r value of 0.95. Six LDL-C calculating formulas we used also showed a significant correlation with directly estimated LDL-C. Among the formulas, Chen et al. formula showed the highest correlation (r = 0.94) while Anandaraja formula showed the lowest correlation (r = 0.88). Friedewald formula, which is the most popular formula currently in use, showed a correlation coefficient of 0.89. Other formulas like Vujovic et al., Martin et al., and Puavikai et al. formula showed a better correlation than Friedewald formula (r value—0.93, 0.93, 0.91, respectively). ML learning models XGBoost and random forests showed better correlation than all the six existing formulas, but SVR performed poorly compared to these existing formulas. On comparing the mean by paired t-test, LDL-C predicted by XGBoost, random forests, and linear regression formula generated showed no statistically significant difference from the directly measured LDL-C, while SVR and all six existing formulas we used showed a significant difference. Correlation of directly measured LDL-C with LDL-C predicted/calculated by different methods: (A) XGBoost (r = 0.98, p < 0.001); (B) random forests (r = 0.98, p < 0.001); (C) SVR model (r = 0.64, p < 0.001); (D) linear regression model (r = 0.95, p < 0.001); (E) Friedewald formula (r = 0.89, p < 0.001); (F) Chen (r = 0.94, p < 0.001); (G) Vujovic (r = 0.93, p < 0.001); (H) Anandaraja (r = 0.88, p < 0.001); (I) Puavikai (r = 0.91, p < 0.001); (J) Martin (r = 0.93, p <0.001).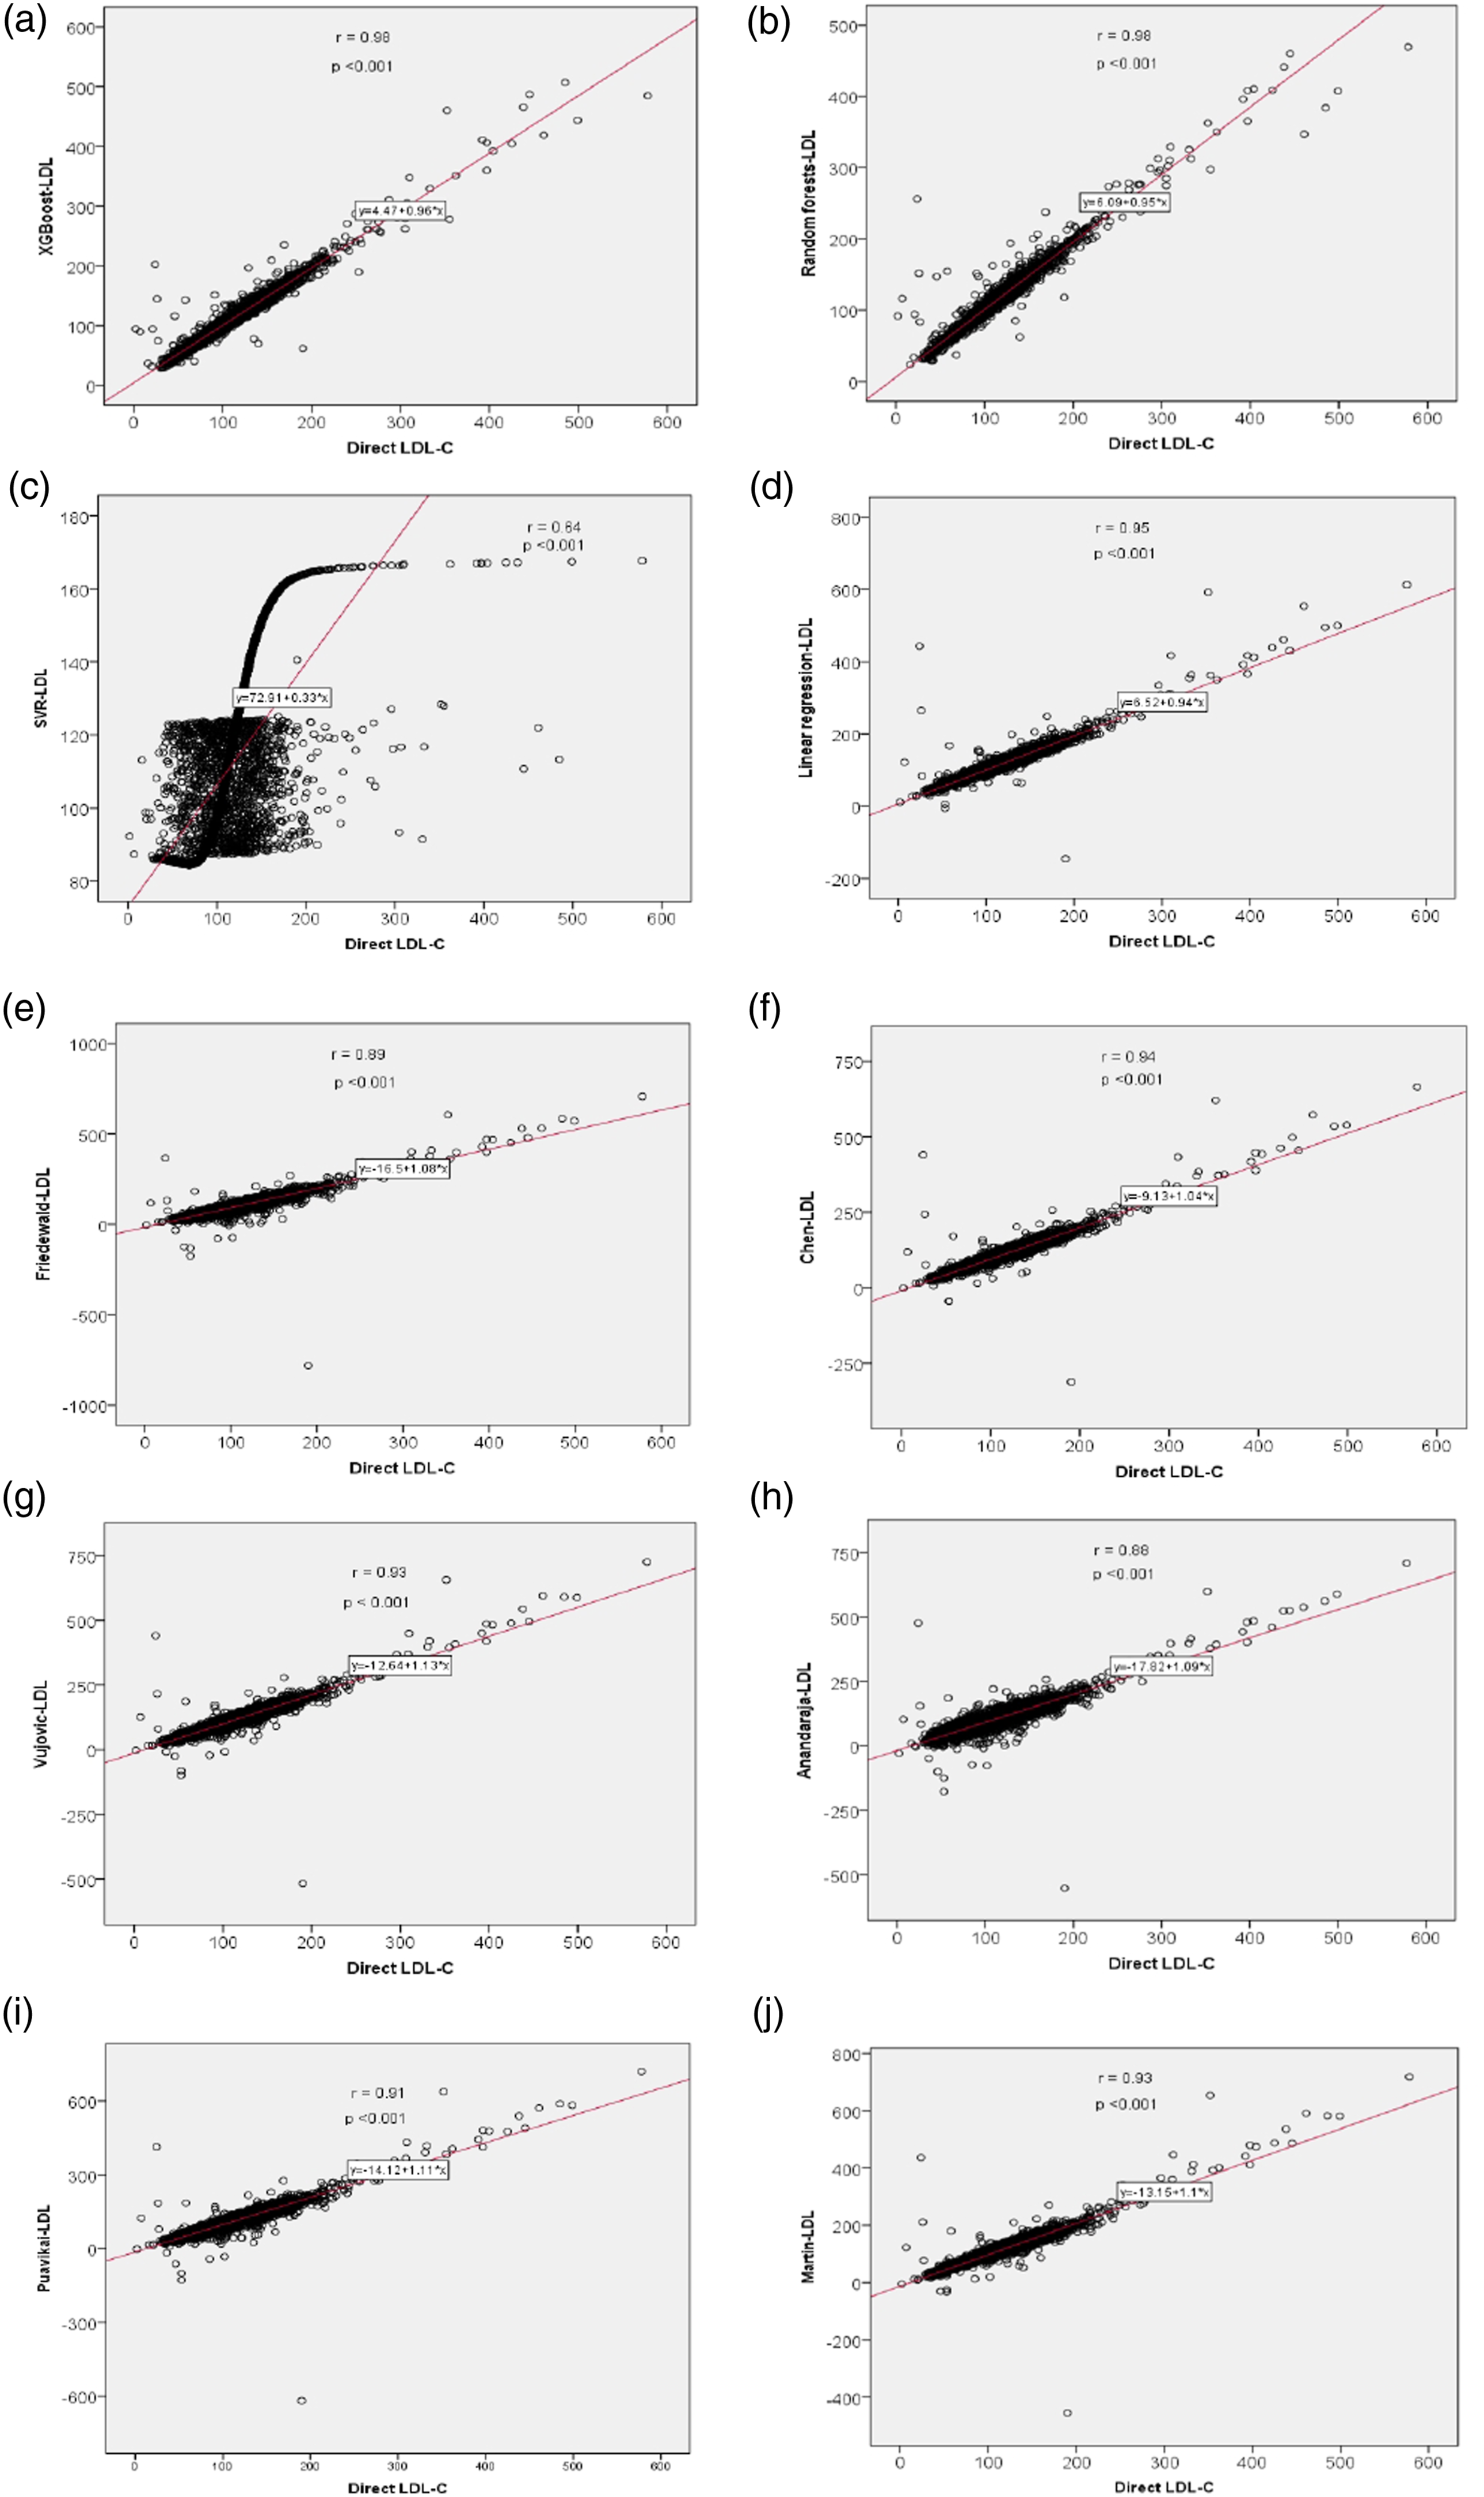
To compare the accuracy of different methods we used to predict LDL-C, we calculated mean absolute difference (MAD) score. Among the different methods we used, random forests showed the least MAD score. XGBoost was the second-best accurate among the different methods, with a MAD score of 4.52 (Figure 2 and Table 2). SVR was the worst accurate among all the methods used (MAD score—18.64). Among the six formulas currently in use, we found Martin et al. and Chen et al. as the better ones with MAD scores of 9.19 and 9.25, respectively. Friedewald formula showed a MAD score of 13.22. Mean absolute difference (MAD) of different methods used to predict/calculate LDL-C.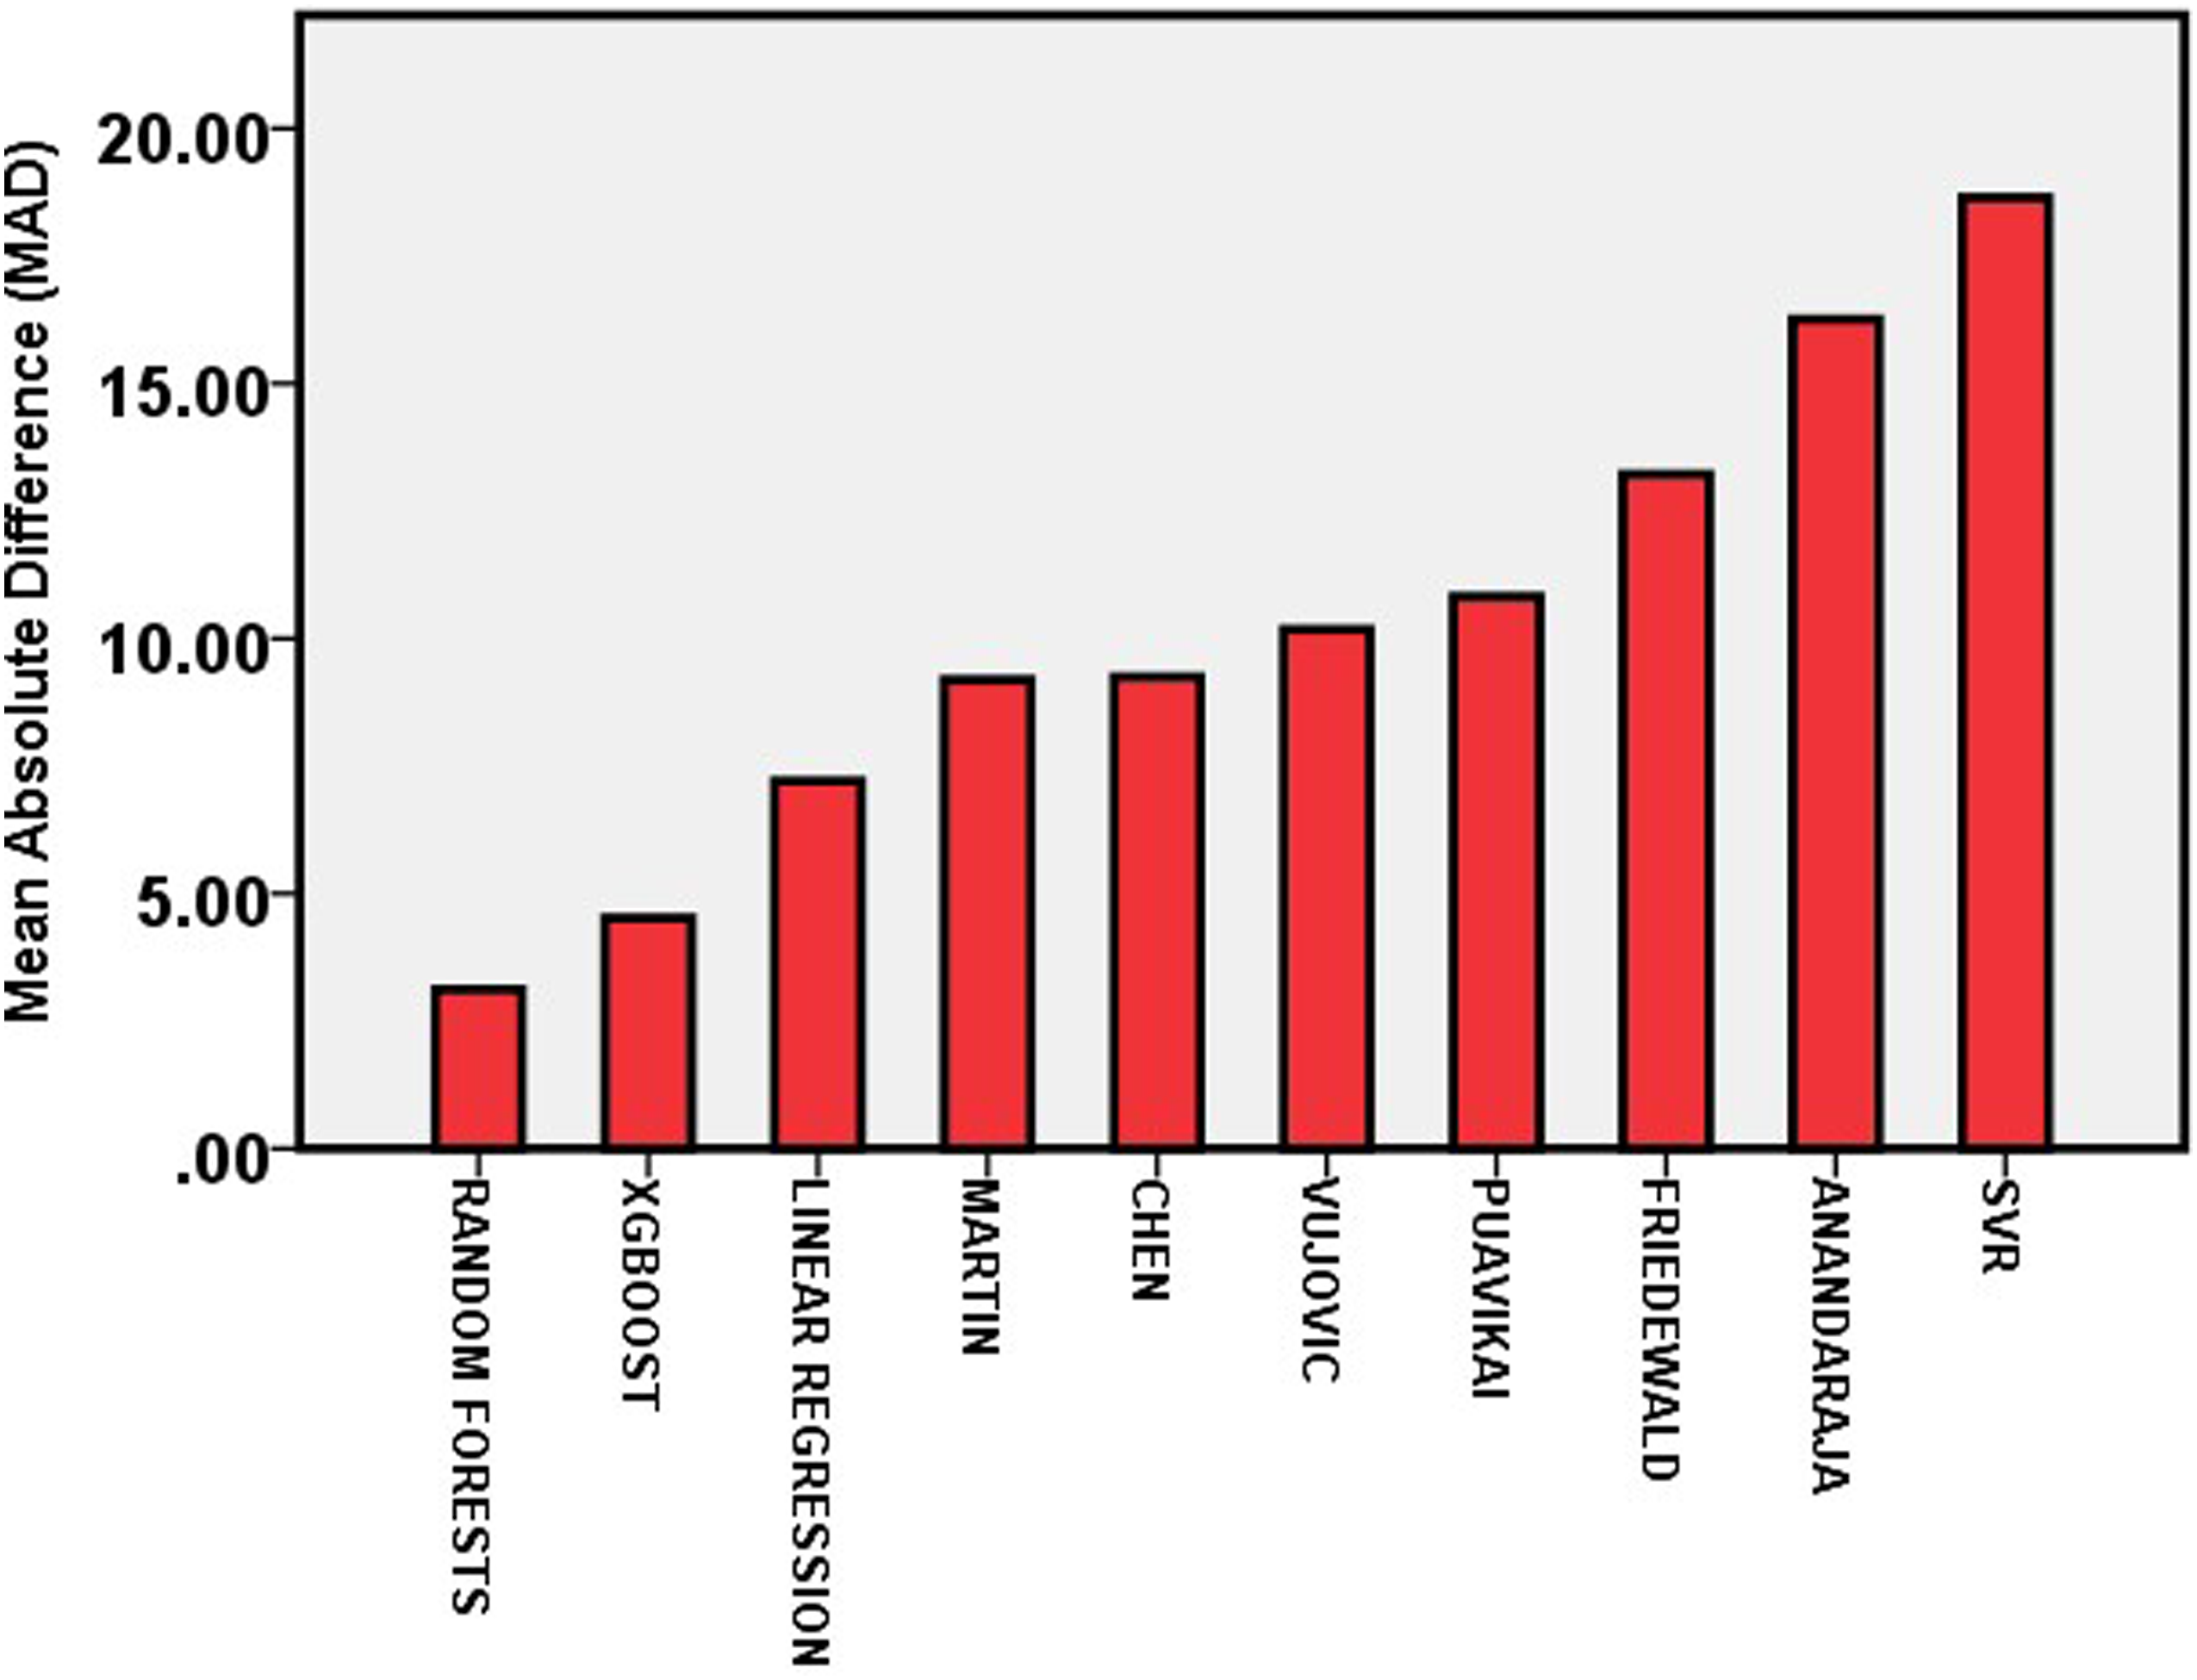
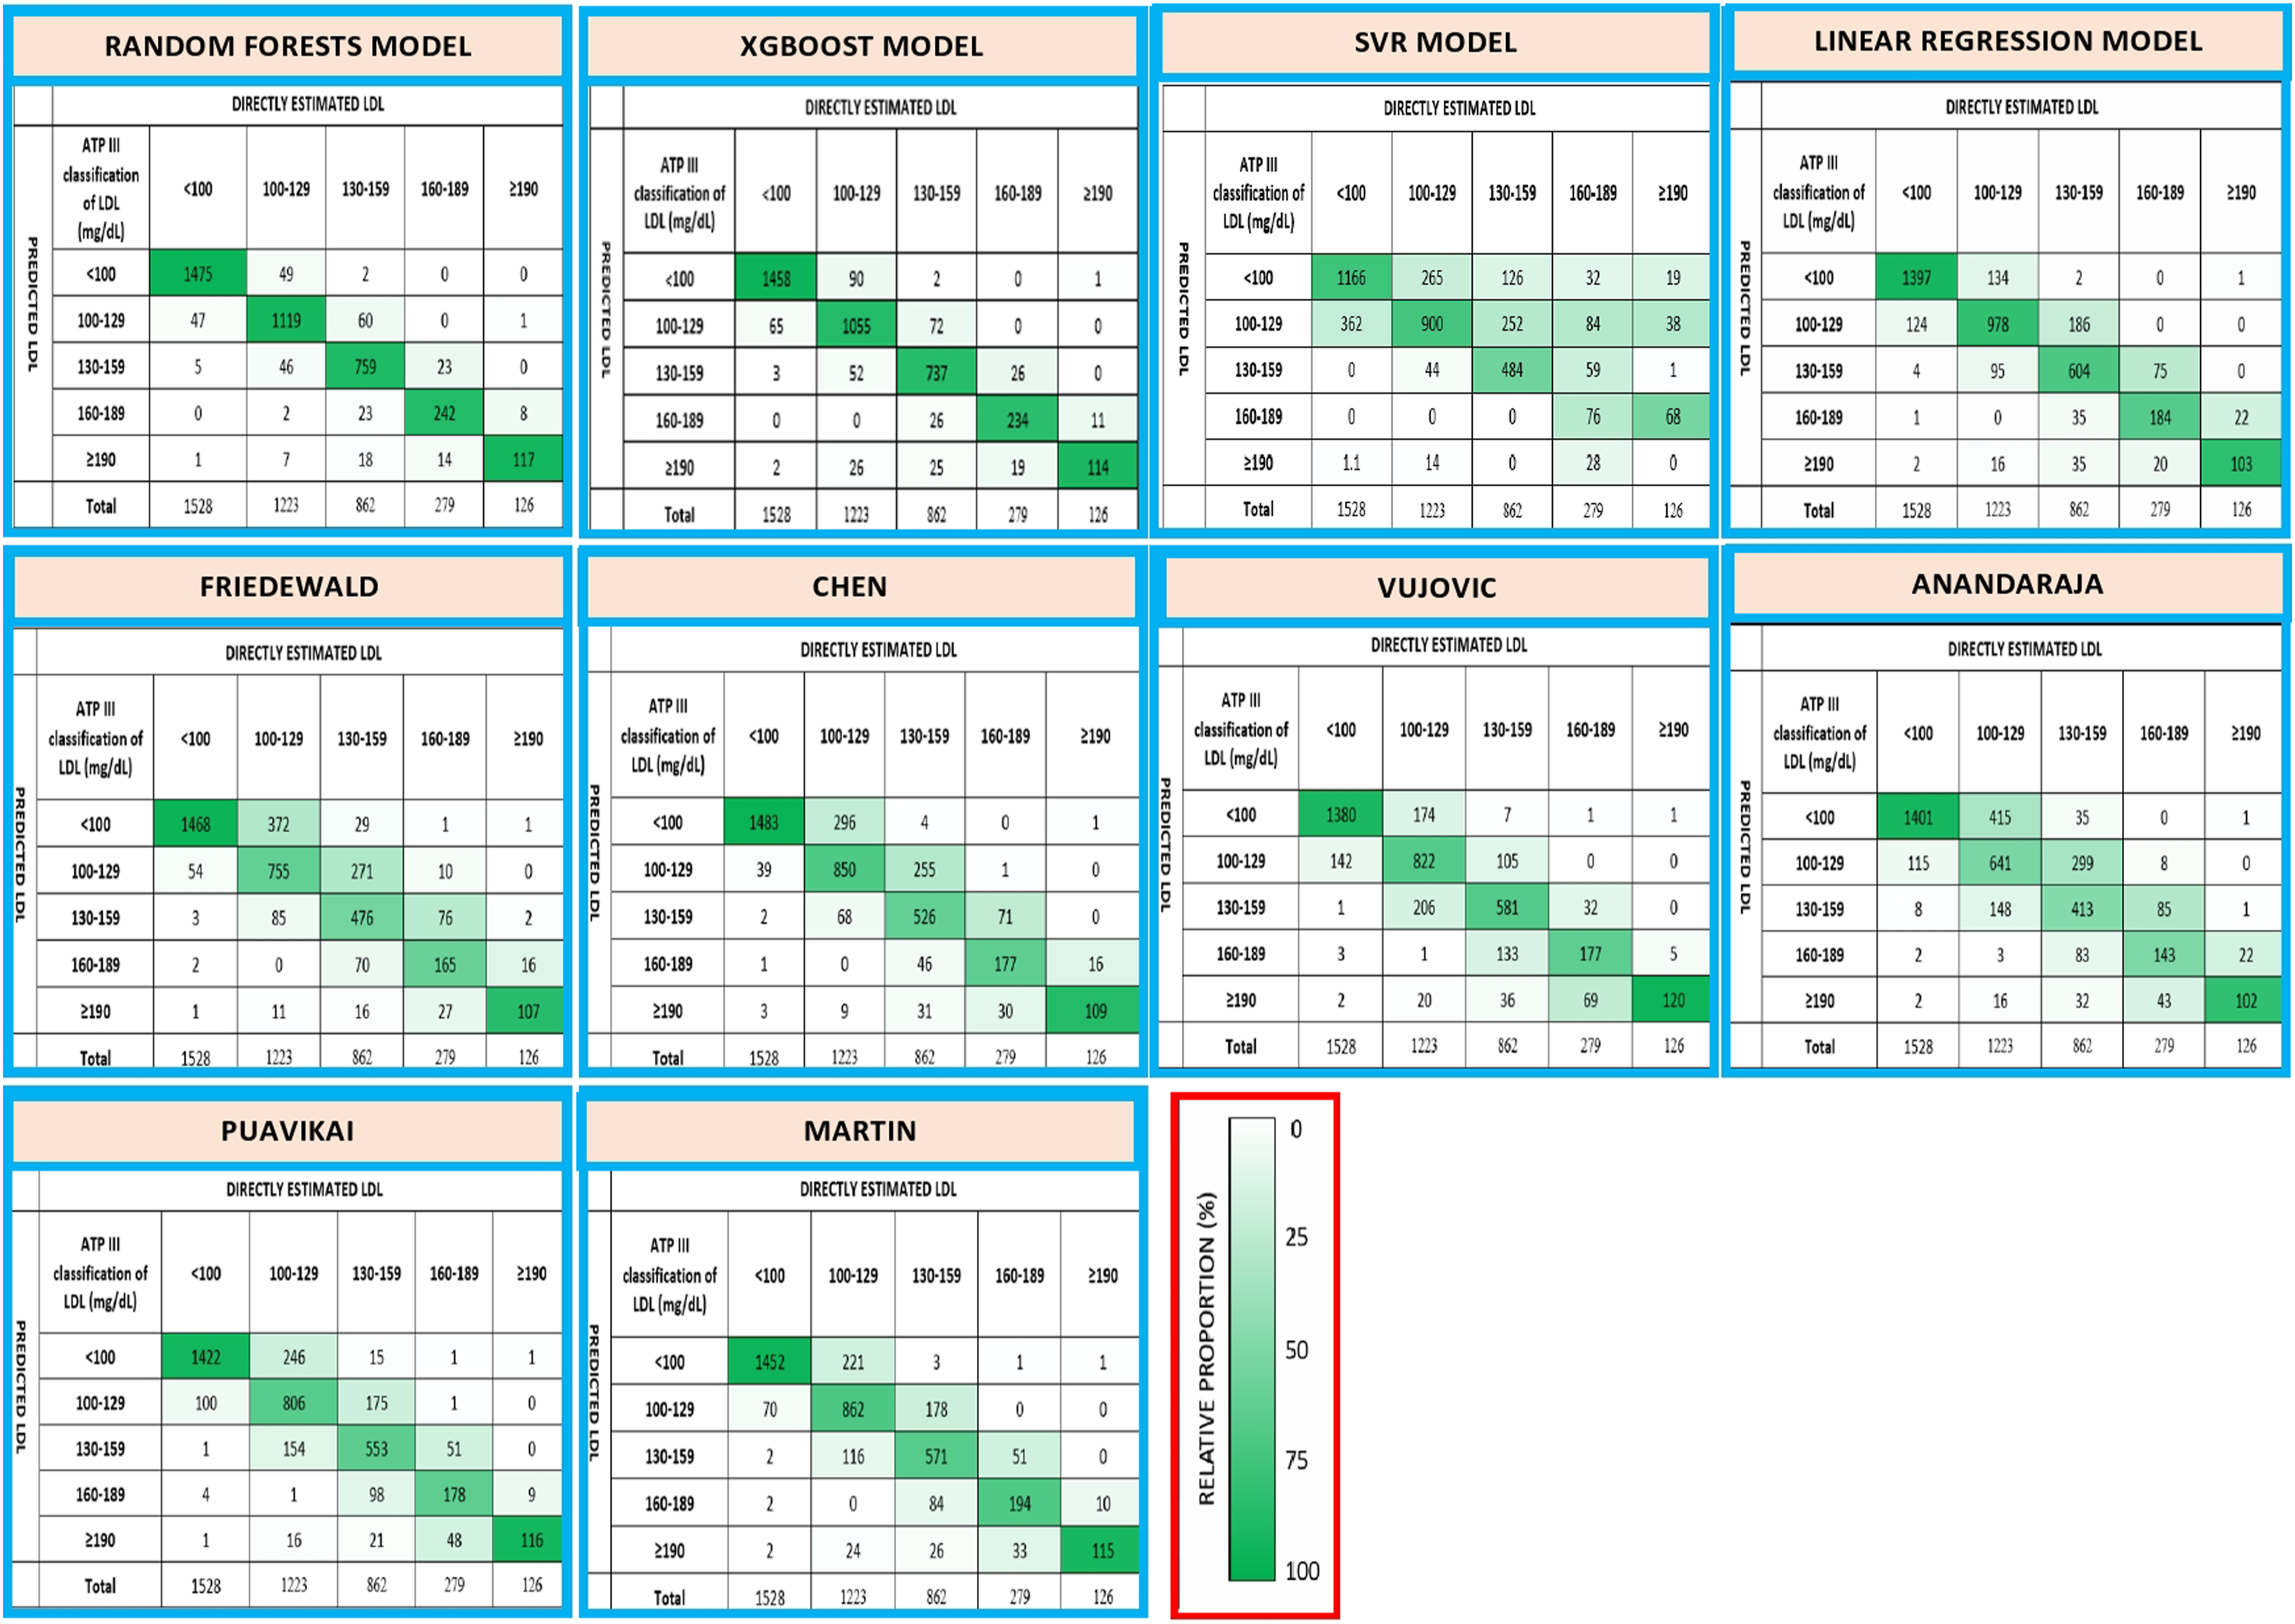
Since LDL-C value is important in determining the treatment of the patients, we also assessed how accurate these methods act to classify patients to correct treatment groups. Random forests and XGBoost models performed well in assigning patients to correct LDL-C groups. 92% of patients were classified into the correct group by random forests model. XGBoost classified 90% of patients into the correct group (Figure 3). Among the existing LDL-C formulas, Martin et al. formula showed the best concordance. This formula correctly classified 79% of patients into proper treatment groups. Chen et al. performed well, classified 78% of patients correctly. Anandaraja formula was the least accurate among the existing formulas we used in terms of assigning correct LDL-C treatment groups. Friedewald formula classified 74% of patients correctly, while 19% of patients misclassified into a lower treatment group. The linear regression model was better in classifying patients comparing to all six existing formulas we used. SVR models performed the worst in the classification of patients. SVR model was inferior to all six existing formulas we used in classifying patients into different treatment groups. Confusion matrices were also constructed to check the accuracy of these models/formulas in classifying the patients into correct LDL-treatment groups (Figure 4). Random forests model was found to perform best in classifying patient into proper groups according to ATPIII classification (accuracy—0.92). XGBoost model also showed good accuracy in classifying patient into proper groups (accuracy—0.90). Among the existing LDL-C formulas, Martin et al. formula showed highest accuracy (0.79). Performance of SVR model was the worst in assigning patient to proper LDL treatment groups (accuracy—0.65). Comparison of concordance in classification of patients to different treatment groups based on the NCEP ATPIII guidelines. Bars represent the percentage of patients correctly classified or misclassified into higher/lower treatment groups based on directly measured LDL-C. Confusion matrix for the classification of patients into LDL treatments groups as per NCEP ATPIII guidelines. Columns represent the directly estimated LDL-C groups; rows represent calculated LDL-C using different models/formulas. Each cell represents the number of patients. Cell color represents relative proportion (number of patients in an individual cell compared to total number of patients in the corresponding columns). Accuracy of each model/formula calculated as the sum of correct classification (values in the cells of main diagonal of confusion matrix) divided by the total number of classifications (n = 4018). (1) Random forests model (accuracy—0.92); (2) XGBoost model (accuracy—0.90); (3) SVR model (accuracy—0.65); (4) linear regression (accuracy—0.81); (5) Friedewald (accuracy—0.74); (6) Chen (accuracy—0.78); (7) Vujovic (accuracy—0.77); (8) Anandaraja (accuracy—0.67); (9) Puavikai (accuracy—0.76); (10) Martin (accuracy—0.79).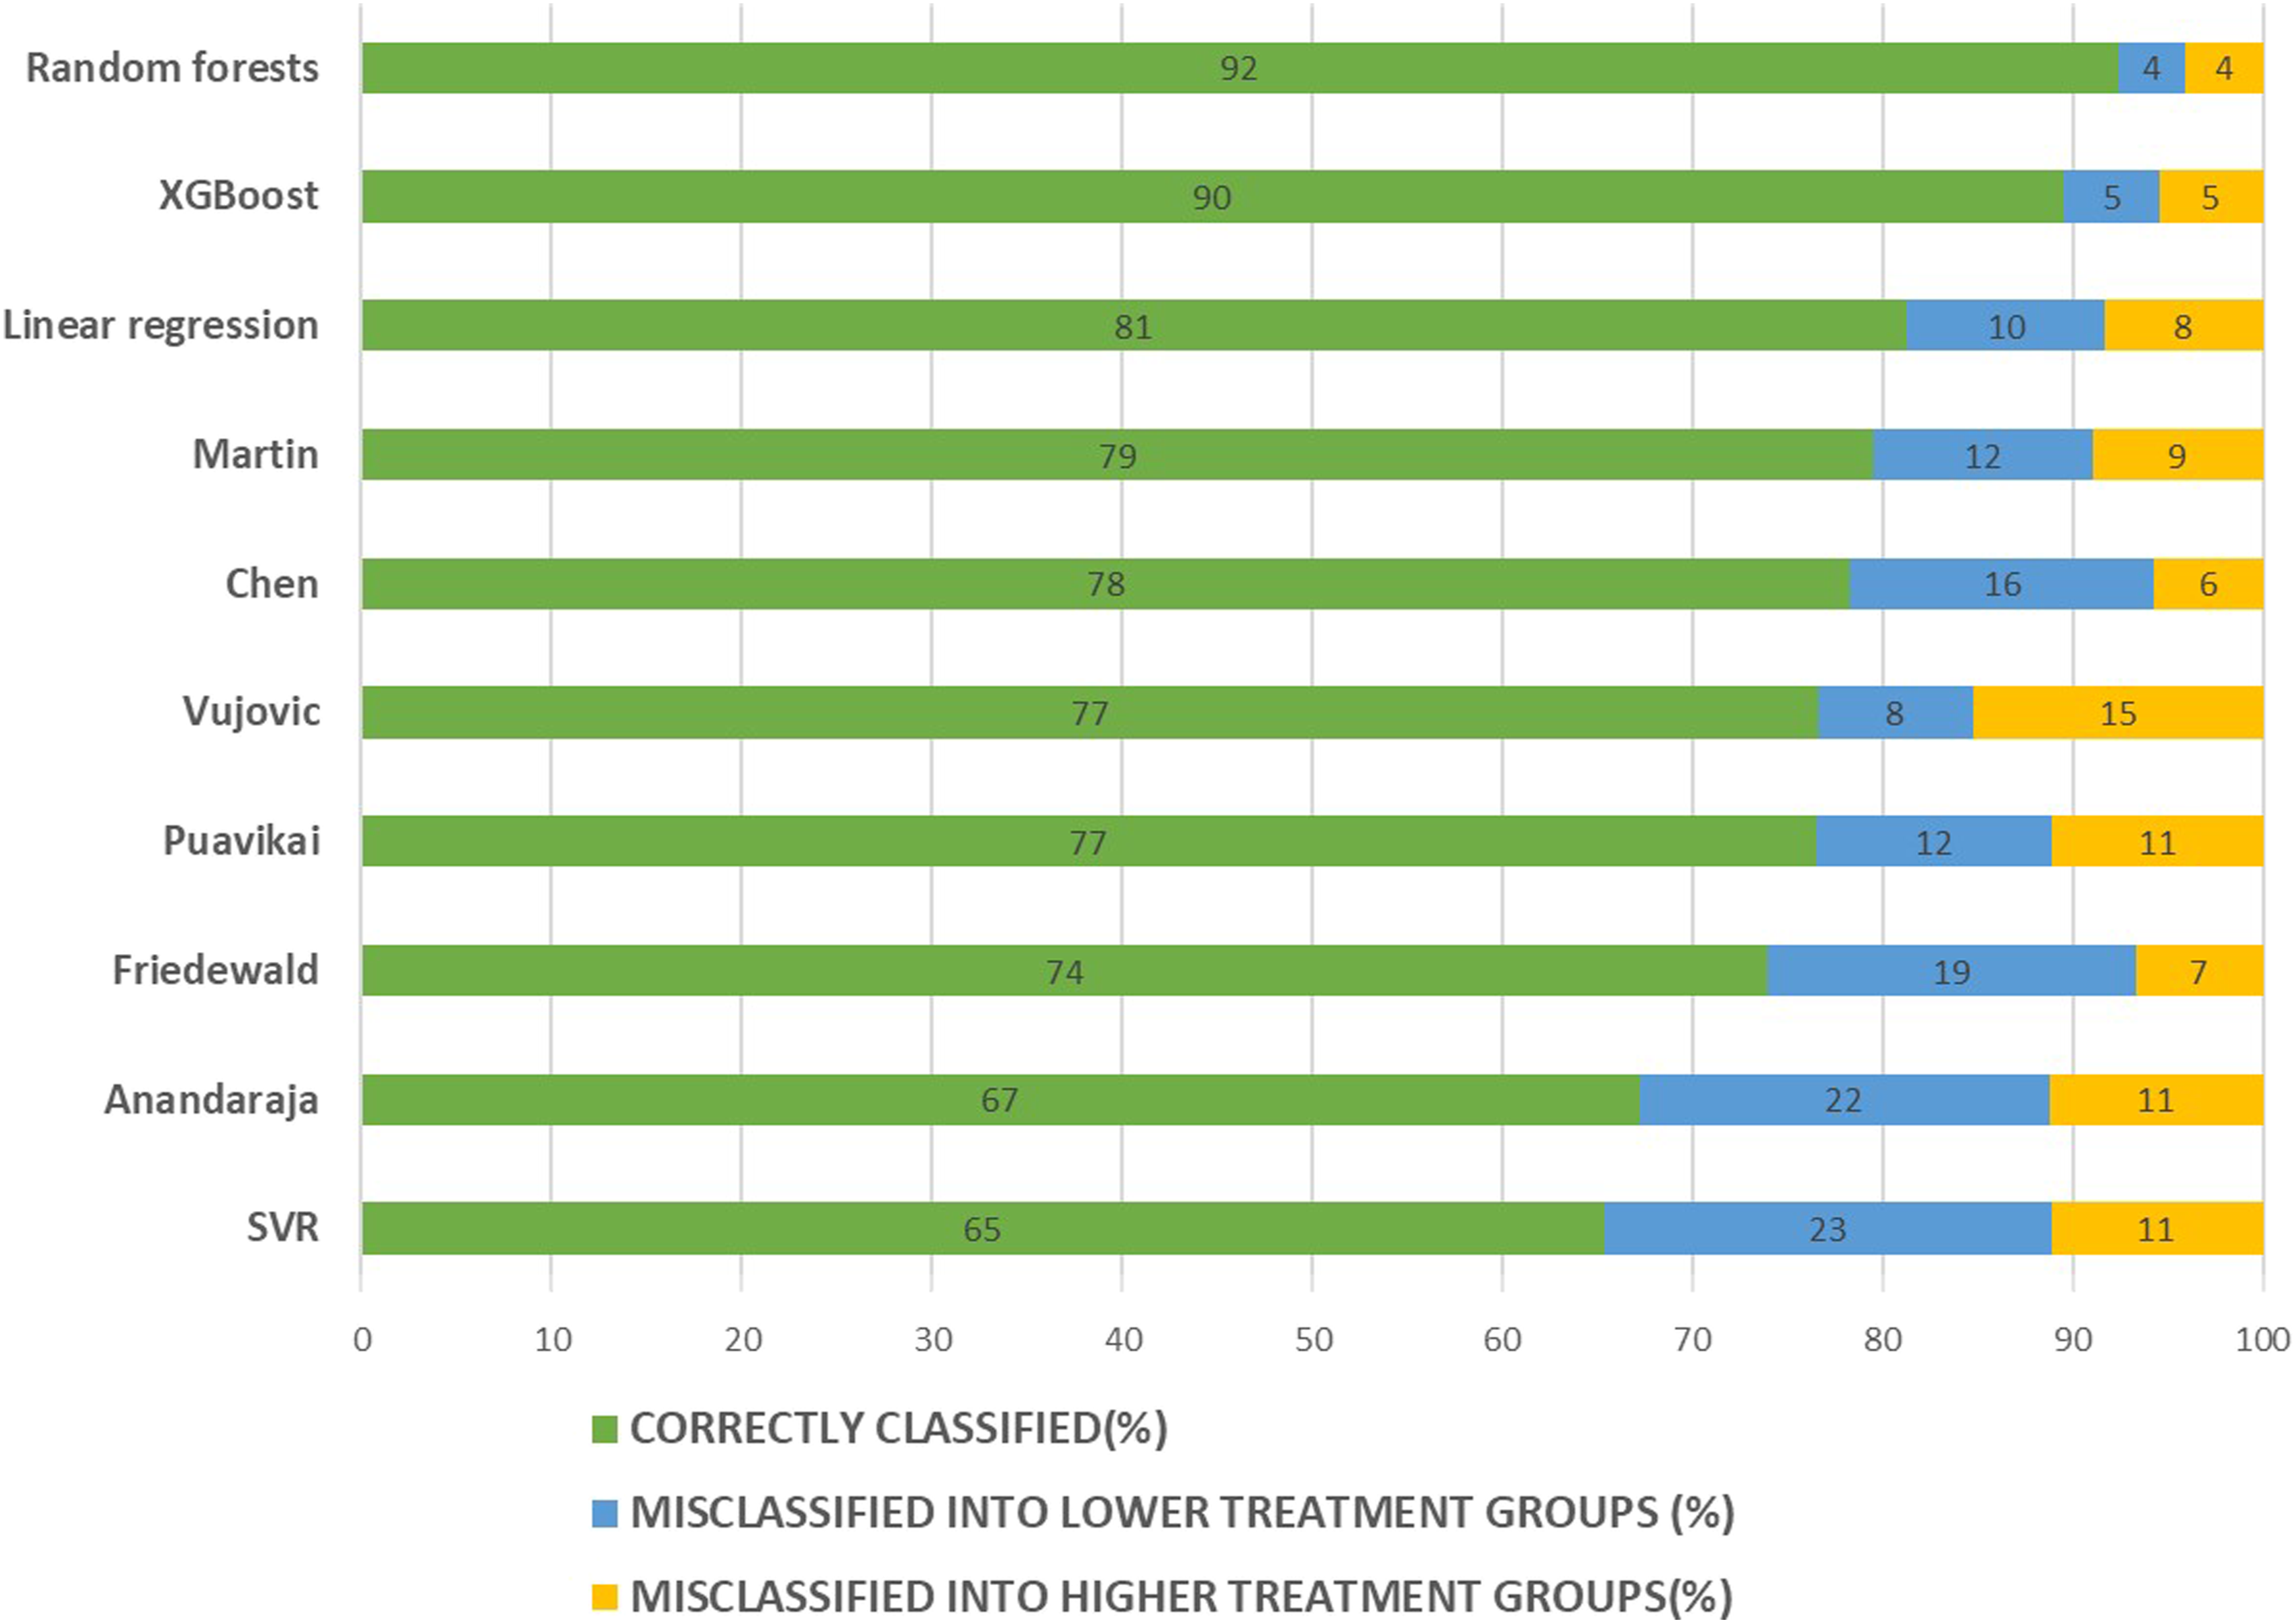
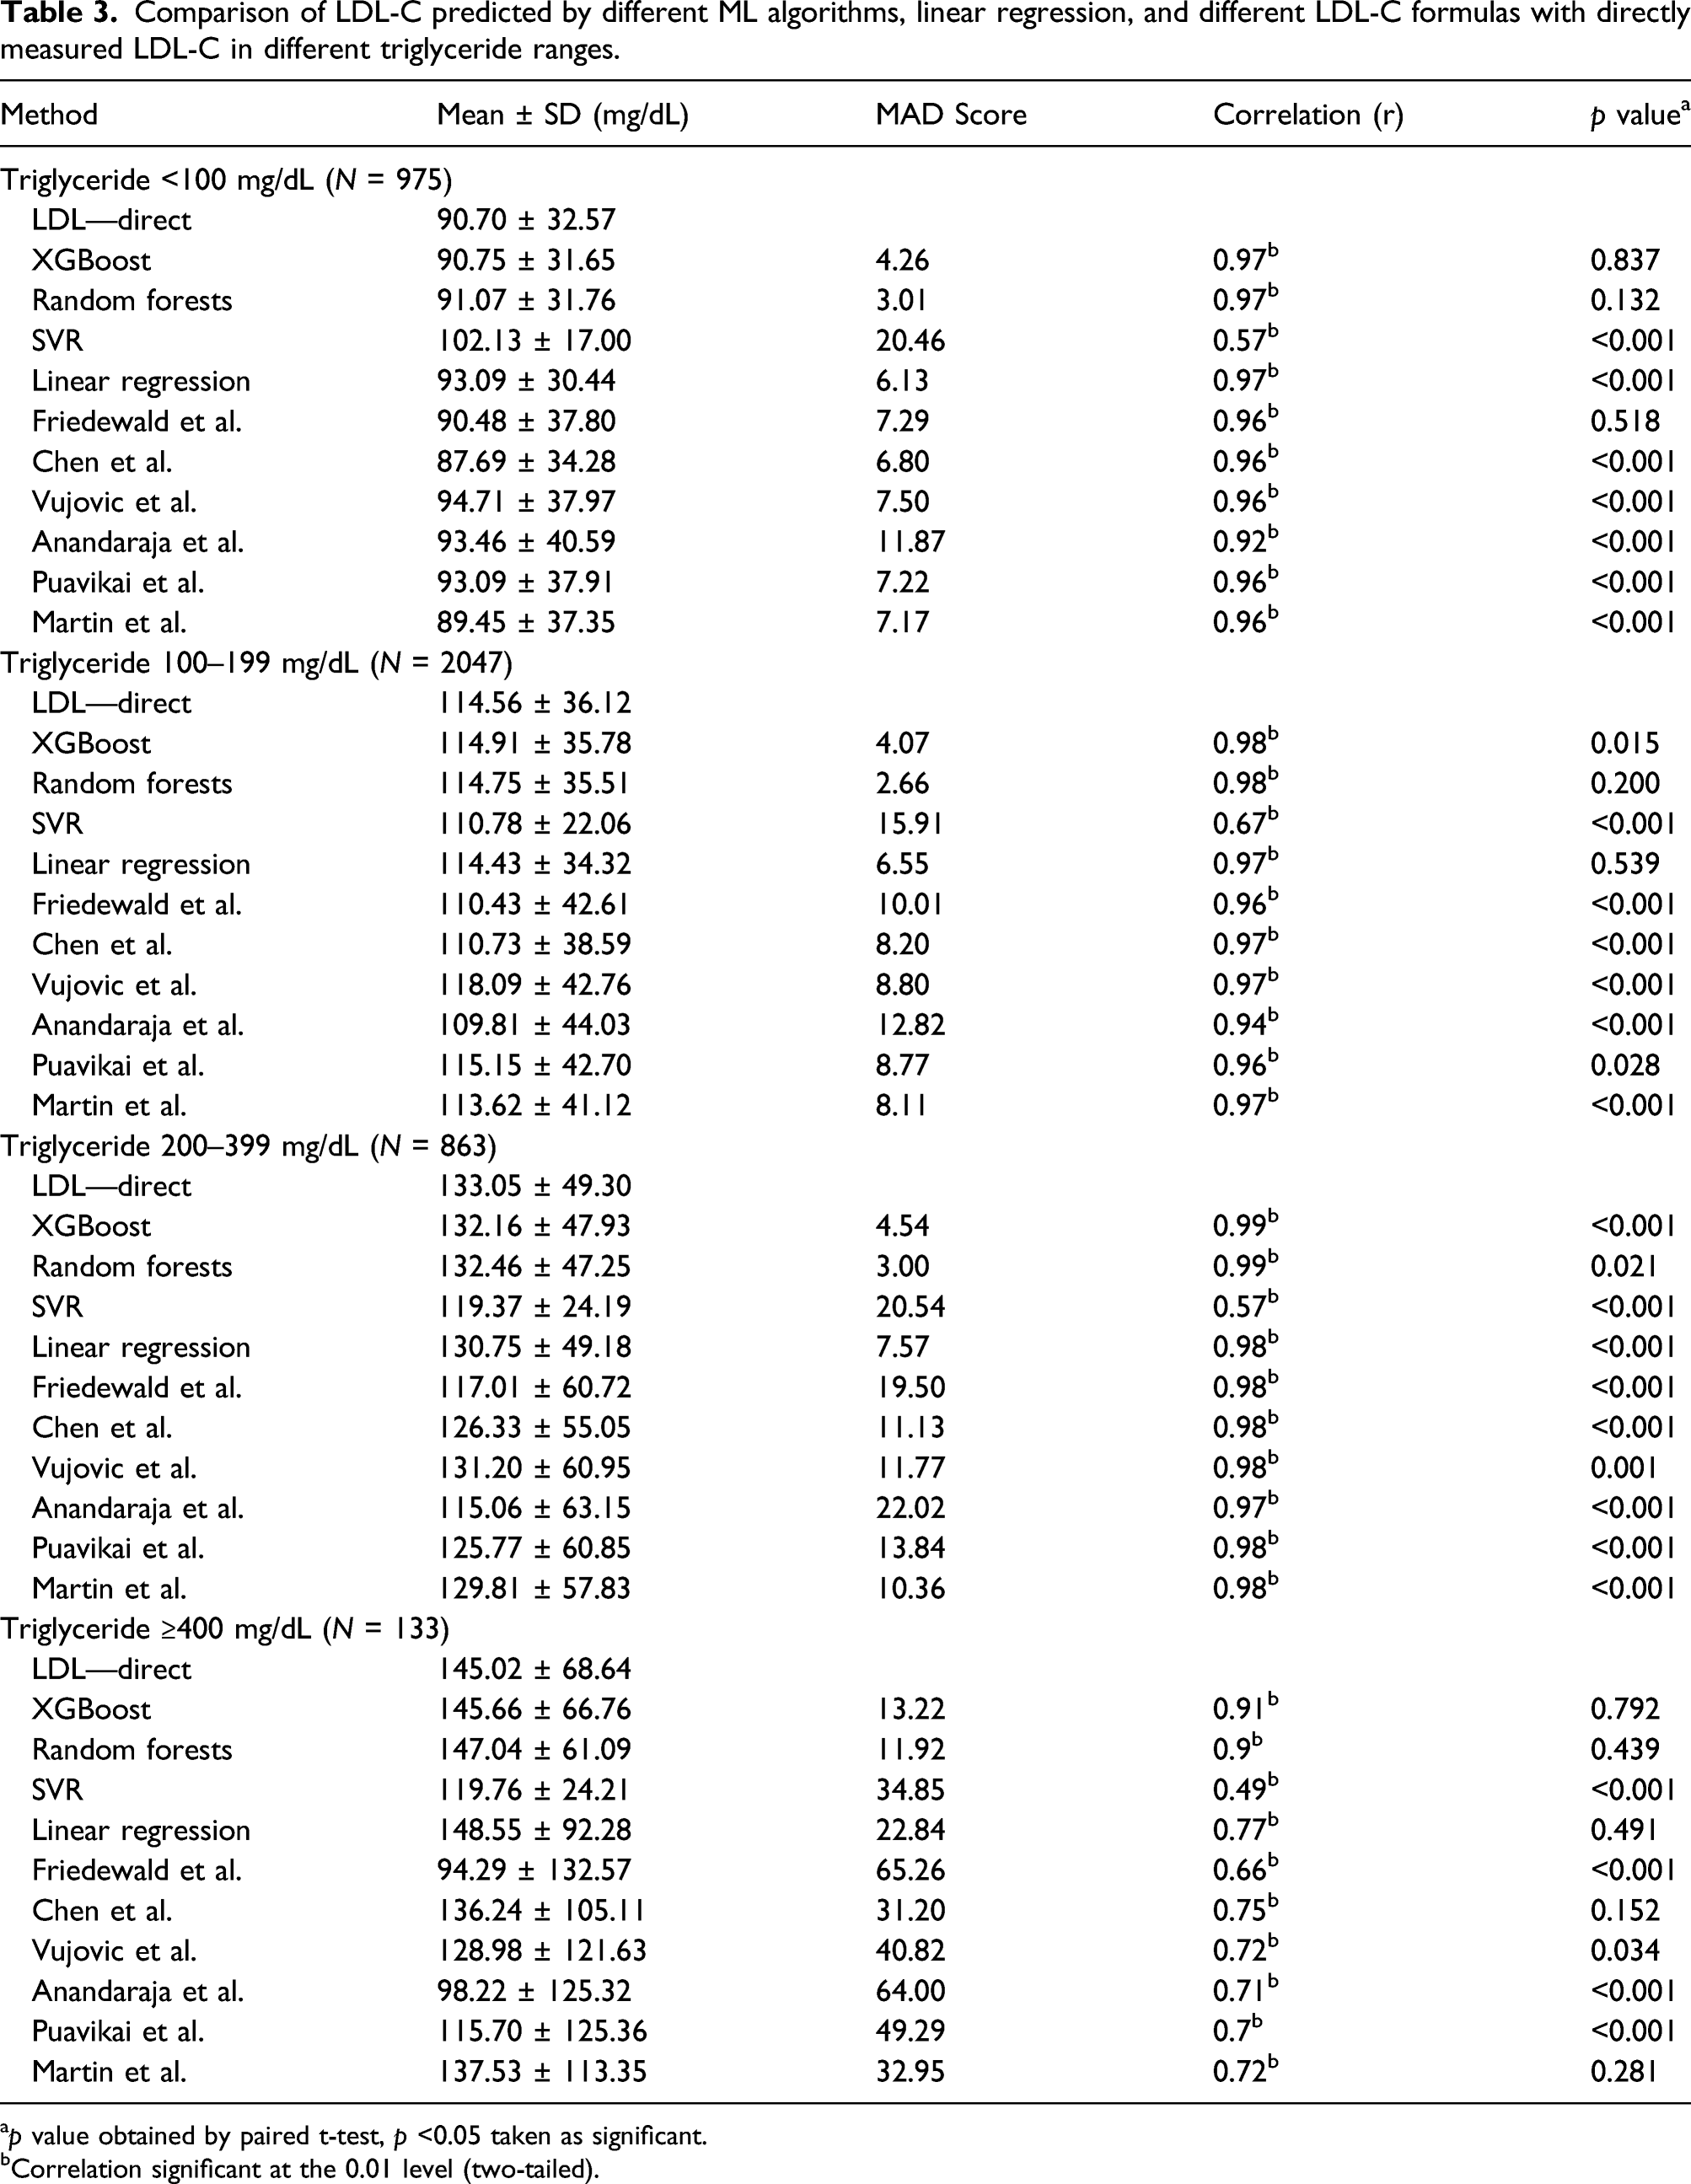
Comparison of LDL-C predicted by different ML algorithms, linear regression, and different LDL-C formulas with directly measured LDL-C in different triglyceride ranges.
ap value obtained by paired t-test, p <0.05 taken as significant.
bCorrelation significant at the 0.01 level (two-tailed).
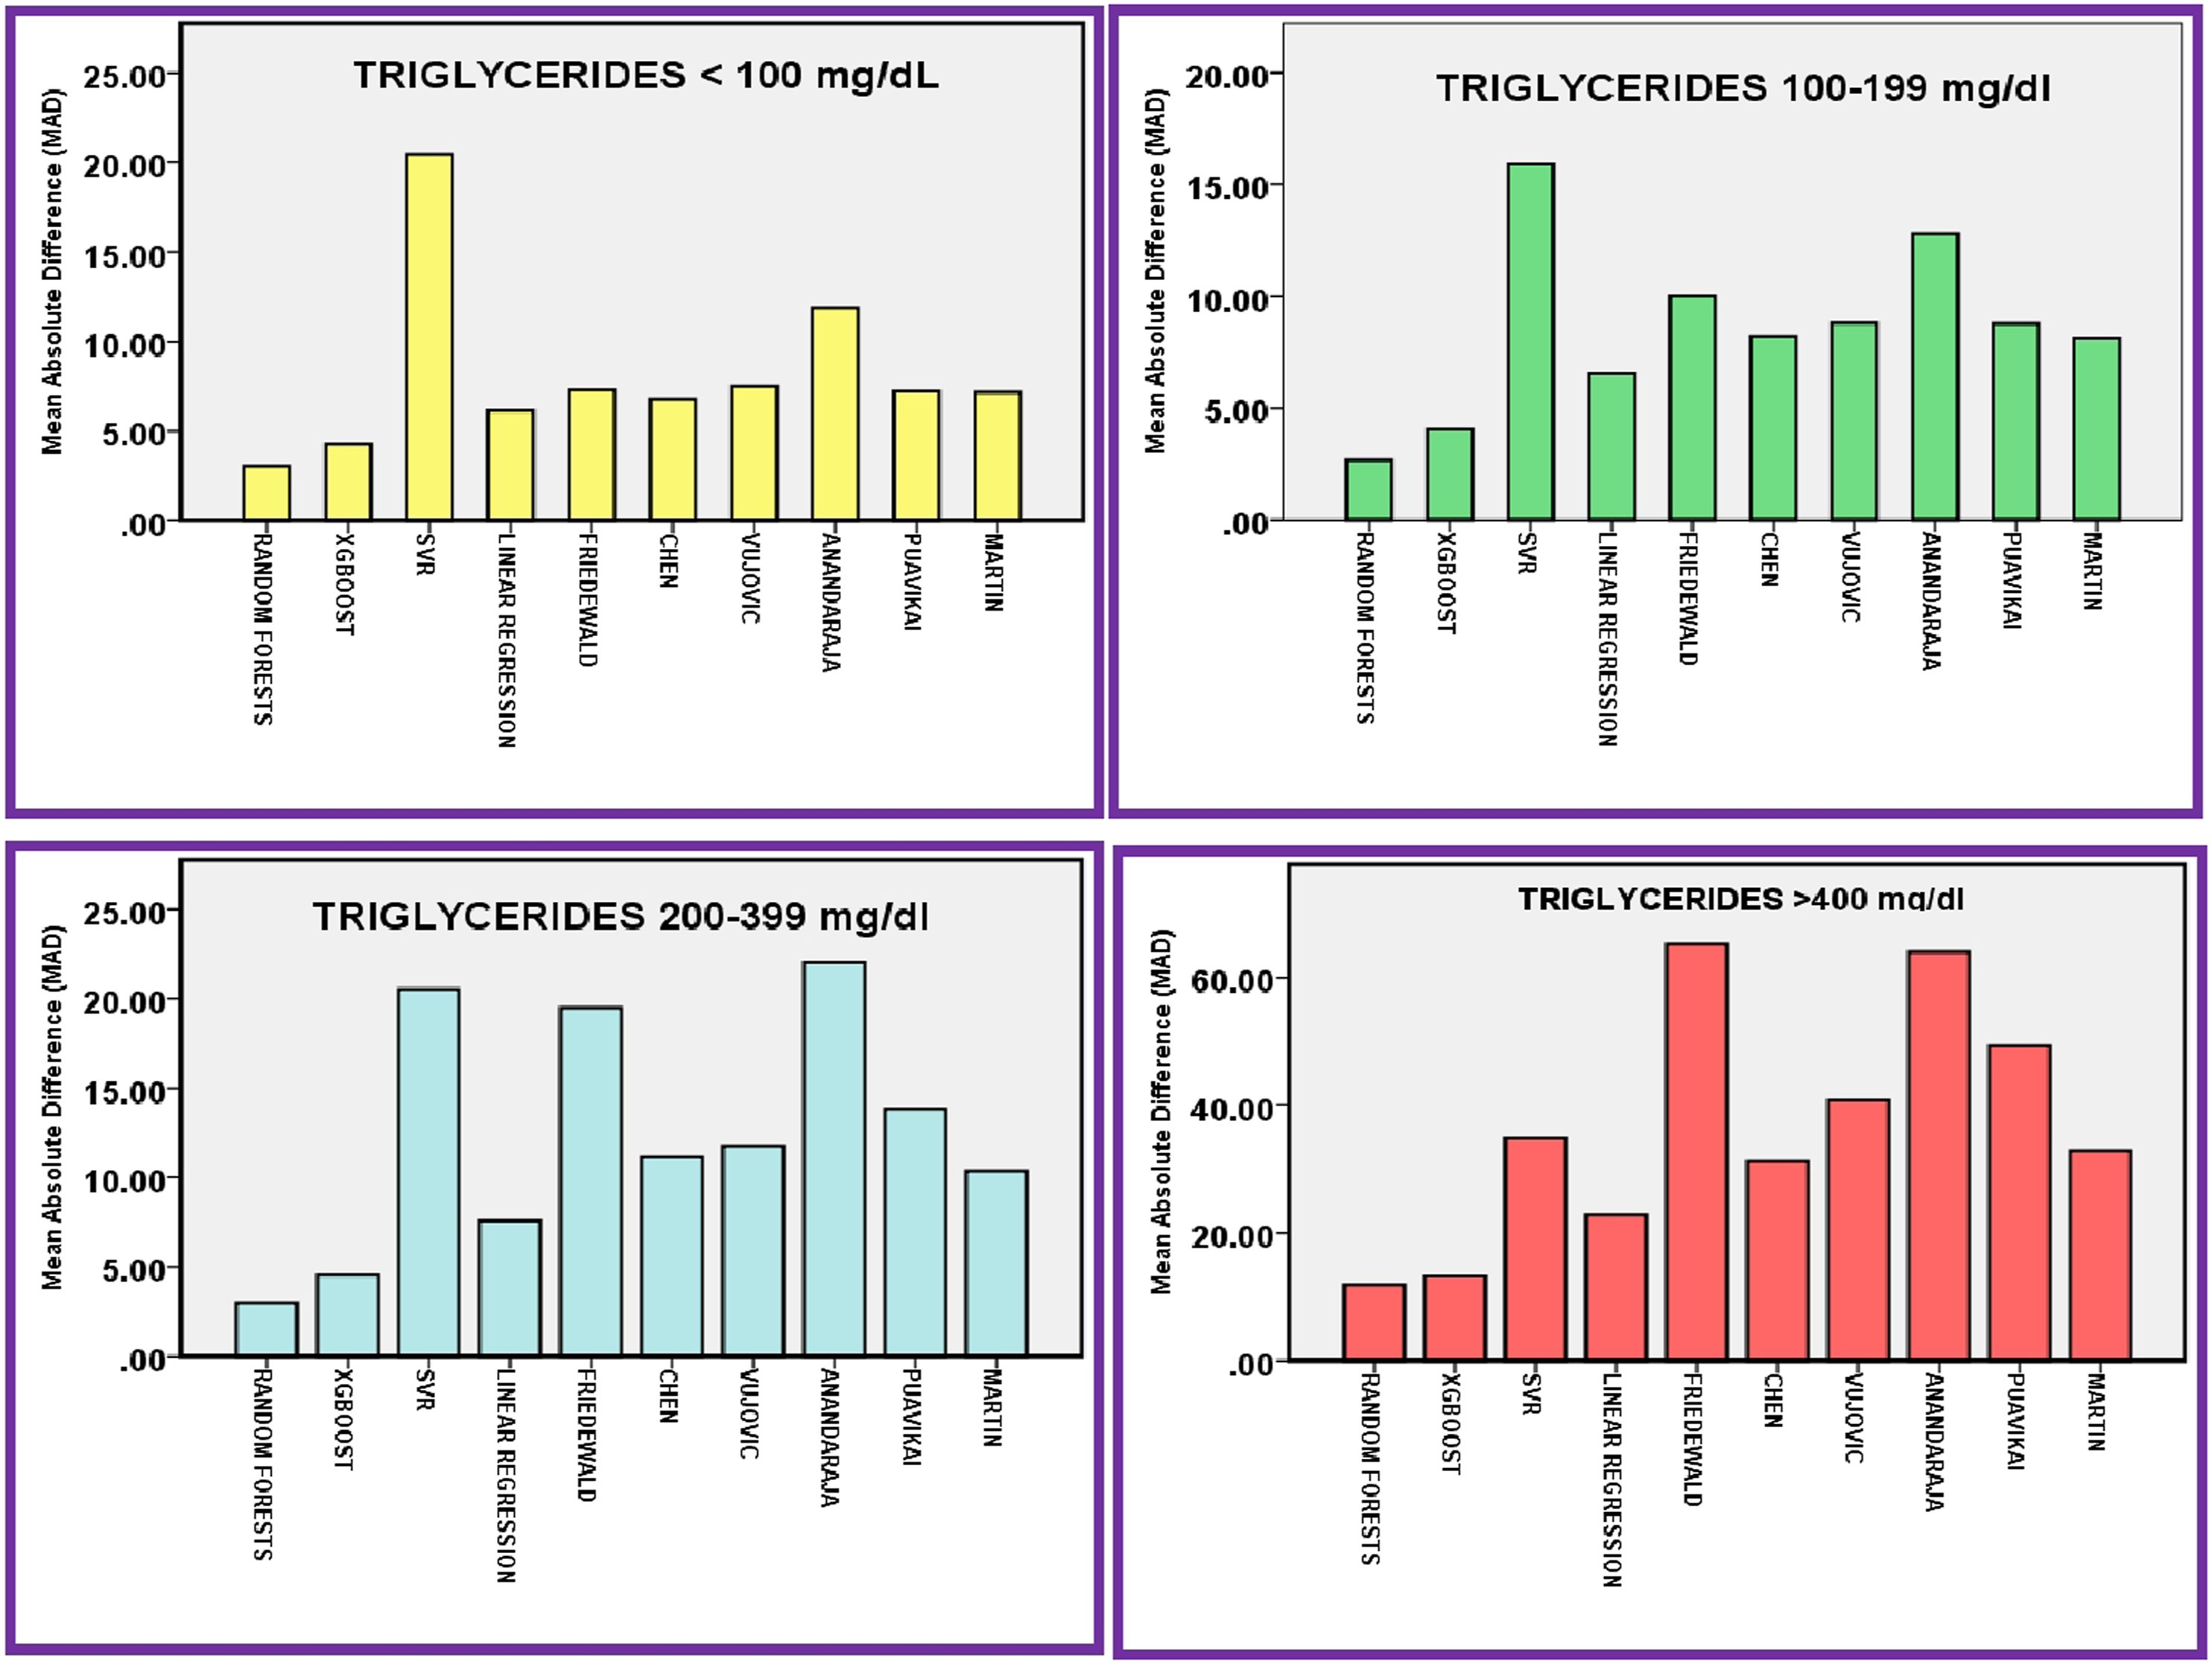
Mean absolute difference (MAD) score of different methods to predict/calculate LDL-C in different triglycerides ranges.
Results of this study point out that ML algorithms can be used to predict LDL-C from the total cholesterol, triglycerides, and HDL-C. These models can perform better than traditional LDL-C calculating formulas. Among the three ML models we used, random forests and XGBoost models accurately predicted LDL-C. These models showed highly superior performance compared to different LDL-C calculating formulas including Friedewald formula. These two models also performed better than the linear regression model we generated. While the third ML model we used, SVR performed worst among all the methods we used. Among the six existing LDL-C calculating formula we used in the eastern Indian study population, we found that Martin et al. and Chen et al. formulas were more accurate.
Discussion
Machine learning algorithms can learn the complex relationship between variables and can utilize this knowledge to predict the outcomes. In this era of artificial intelligence, machine learning models are started to be explored for the better prediction and risks of various diseases. 26 Previous studies already demonstrated the superior performance of some of these ML models in assessing cardiovascular disease severity compared to conventional methods currently in use. 27 LDL-C being a strong marker of CAD and the primary target for therapy, estimation of accurate LDL-C value is crucial. 28 Our effort was to validate the performance of ML models in predicting LDL-C. We applied three different machine learning algorithms (XGBoost, random forests, SVR) to predict LDL-C from total cholesterol, triglycerides, and HDL-C in the data obtained from the population of eastern India and compared its accuracy with the directly estimated LDL-C. The performance of these models was compared with a linear regression model and six existing LDL-C calculation formulas. To the best of our knowledge, it is the first study in an Indian population seeking a better ML model to predict LDL-C with more accuracy.
Our study demonstrated random forests and XGBoost machine learning models predict LDL-C far better on comparing to conventional formulas like Friedewald formula. These models showed a correlation coefficient of 0.98 as compared to Chen et al. which was found to be better among the existing LDL-C formulas in the study population (correlation coefficient—0.94). The accuracy of these models was further demonstrated by evaluating MAD Score. XGBoost and random forests showed a MAD score of 4.52 and 3.12, respectively, while Friedewald showed a much higher MAD score (MAD Score—13.22). Further, we attempted to evaluate the accuracy of these models and formulas in classifying patients into correct LDL-C treatment groups. Random forests and XGBoost models were demonstrated to have highest accuracy in classifying patients into correct LDL-C treatment groups as per NCEP ATPIII guidelines. This is important as the wrong classification may lead to the under or over-treatment of these patients. These two models outperformed other methods also when compared in different triglycerides strata. For patients with triglyceride more than >400 mg/dL, these models showed a good correlation of 0.9, and statically, there was no significant difference between the mean values. While Friedewald formula usage is limited to patients with triglycerides <400 mg/dL, these ML algorithms with help of a large dataset can predict LDL-C even with high triglycerides value. XGBoost and random forests models outperformed the linear regression model also. Most of the LDL-C formulas were developed using multivariate linear regression analysis only. Our results underline the advantage of ML models over the linear regression analysis in the prediction of LDL-C. But it is noteworthy to point out that the other ML model we used—support vector regression (SVR) model performed poorly compared to the six existing formulas we used. Previously, Singh et al. explored the performance of random forests model to predict LDL-C in comparison to Friedewald and Martin equations. This study documented a correlation coefficient of 0.982 between the directly estimated LDL-C and LDL-C predicted using random forests, similar to the present study. Random forests model–predicted LDL-C was found to be better correlating than Martin and Friedewald formula in all the three strata of triglycerides used for classification (triglyceride 0–150, 150–500, >500 mg/dL). For the group with triglyceride >500 mg/dL, previous study showed a correlation coefficient of 0.99 between the random forests model–predicted LDL-C and directly estimated LDL-C. But our study demonstrated lesser correlation coefficient (0.90) in the group of patients with triglyceride >400 mg/dL for the random forests model. 25
We evaluated six formulas—Friedewald, Martin, Chen, Vujovic, Puavikai, and Anandaraja in our study population. The performance of these formulas was found to be varying greatly in different populations in previous studies. Anandaraja formula was developed in the Indian population and to predict LDL-C more accurately than Friedewald formula. 11 But some previous studies showed its performance was not better than Friedewald in the Indian population. 29 Wadhwa et al. evaluated seven formulas in the Indian population and found Vujovic formula as better than other formulas like Friedewald and Anandaraja. 30 Friedewald formula is still the most popular one among the different LDL-C calculating formulas. Friedewald considered TG: VLDL ratio as a five and used this to calculate LDL-C. But many studies showed this ratio can vary. 31 Formulas like Puavikai and Hatta use different factors 6 and 4, respectively, as TG: VLDL ratio.12,13 In our study population, median TG: VLDL ratio was 6.48. Martin et al. suggested using an adjustable novel factor instead of this fixed factor. Martin formulas were found to perform better than Friedewald in many studies.32,33 In our study also, Martin et al. equation was found to be more accurate than Friedewald formula. Among the six formulas we used, Martin et al. and Chen et al. were found to better than Friedewald formulas and other formulas in our study population. With growing evidence suggestive of the poor performance of Friedewald formula in different populations, it is time to reconsider switching to novel methods like machine learning algorithms or better formulas like the Martin equation for predicting LDL-C.
Our study has some limitations also. This study included retrospectively collected lipid profile data from the laboratory database; hence, many clinical characteristics of the patients could not be included and analyzed. The ML models have better accuracy than the linear regression models and can predict the LDL-C more effectively. However, the complexity of these models is the major limitation in their application. Integration of these ML models into Electronic Health Record (EHR) systems will overcome this barrier and would be beneficial for calculating LDL-C at point of care and in planning the proper LDL lowering management protocol for patients.
Conclusion
In the present study, XGBoost and random forests predicted LDL-C more accurately and showed a strong correlation with the directly estimated LDL-C. Performance of XGBoost and random forests models in predicting LDL-C was found to be superior in comparison to six existing commonly used LDL-C calculating formulas and formulas we generated using linear regression. Physicians and laboratories could try to integrate these models for better prediction of LDL-C into their routine clinical practice instead of using the traditional formulas like Friedewald formulas.
Footnotes
Acknowledgments
We are thankful to our colleagues and staff of the clinical biochemistry laboratory, AIIMS Bhubaneswar.
Declaration of conflicting interests
The author(s) declared no potential conflicts of interest with respect to the research, authorship, and/or publication of this article.
Funding
The author(s) received no financial support for the research, authorship, and/or publication of this article.
Ethical approval
This study was approved by Institutional Ethical committee of AIIMS Bhubaneswar (T/IM-NF/BIOCHEM/20/162).
Guarantor
SK
Contributorship
APP and SK conceived the study. PP helped in acquisition of data. Development of the machine learning model and statistical analysis was done by ASR and SN. Drafting of the article was done by APP and SK. All authors reviewed and edited the article.