
Abstract
Background
The 1 mg overnight dexamethasone suppression test (ONDST) is recommended for the differential diagnosis of Cushing’s syndrome and the investigation of adrenal incidentalomas. Despite documented variation in serum cortisol immunoassay performance, little has been published regarding its effect on the ONDST.
Aims
Assess the performance of three immunoassay platforms (Roche Elecsys II, Abbott Alinity & Siemens Centaur) when compared to a liquid chromatography tandem mass spectrometry (LC-MS/MS) method.
Methods
Samples (n = 77) sent to the laboratory as part of an ONDST were retrieved prior to disposal, anonymized, and analysed on all platforms. Samples with factors impacting immunoassay analysis quality were excluded. Results were statistically compared to an LC-MS/MS method that previously demonstrated excellent comparability to a candidate reference method.
Results
The Roche gen II showed a mean bias of −2.4 nmol/L and a Passing–Bablok fit of y = −0.9 + 0.97x. This was not affected by sex. The Abbott showed a mean bias −18.8 nmol/L, and a fit of y = −11.3 + 0.88x. This bias was −20.7 nmol/L in females versus −17.2 nmol/L in males. The Siemens had a mean bias of 2.3 nmol/L and a fit of y = 1.4 + 1.07x. This bias was 5.7 nmol/L in males versus −1.0 nmol/L in females.
Conclusions
Clinicians should be aware of the method-dependent variation that exists within serum cortisol analysis during the ONDSTs. Roche and Siemens aligned more closely with LC-MS/MS while the Abbot may cause a reduction in ONDST sensitivity. This data supports assay-specific cut-offs for the ONDST.
Introduction
Cortisol is the major glucocorticoid secreted by the zona fasciculata of the adrenal glomerulosa. Its analysis in serum is recommended by the Endocrine Society’s clinical practice guidelines for the diagnoses of hyper- 1 and hypo-cortisolism. 2 Cushing’s Syndrome is characterized by chronic hypercortisolism lacking diurnal variation. This is most commonly iatrogenic in cause, precipitated by excessive administration of high-dose glucocorticoids for extended periods. 3 Outside of these cases, the majority of Cushing’s syndrome is caused by inappropriate adrenocorticotropic hormone (ACTH) release. 4 ACTH-dependent hypercortisolism is often caused by ACTH-secreting pituitary adenomas in Cushing’s disease, or ectopic ACTH secretion from tumours such as pancreatic carcinoids and small-cell lung tumours. 5 In ACTH-independent disease, autonomous cortisol secretion may occur due to the presence of hyperfunctioning adrenal adenomas and carcinomas or adrenal nodular hyperplasia. 6 The resulting chronic hypercortisolism causes a broad range of clinical presentations. Severe cases may precipitate some combination of typical symptoms, such as proximal muscle weakness, purple striae, mooning of the face, unexplained osteoporosis, and easy bruising. 7 However, non-specific symptoms in milder cases, including obesity, diabetes, hypertension, and oligomenorrhea, cause difficulty in discerning Cushing’s from other differential diagnoses.7,8 This necessitates reliable methods of diagnosis.
The 1 mg overnight dexamethasone suppression test (ONDST) has long been used for the diagnosis of syndromes of cortisol excess.1,9 Its use is also recommended by the European Society of Endocrinology clinical practice guidelines for the investigation of adrenal incidentalomas 10 and the procedure is now well standardized. 11 A serum cortisol ≤50 nmol/L indicates adequate suppression of the hypothalamic-pituitary-adrenal axis by dexamethasone and excludes Cushing’s Syndrome with >95% sensitivity and 80% specificity.1,10 Individuals that fail to suppress cortisol are indicated for further investigations, including further screening tests, high-dose suppression tests, imaging, or biopsy.
Although assay-dependant biases exhibited by immunoassay have been well documented,12,13 they remain the dominant method in routine clinical practice according to external quality assessment (EQA) providers. Typically, intra-assay imprecision is within acceptable limits for these platforms. However, inter-assay imprecision is consistently broad, leading to variability in patient outcomes depending on the assay used.
When comparing immunoassays to liquid chromatography tandem mass spectrometry (LC-MS/MS) for serum cortisol results, both positive and negative biases has been observed depending on assay manufacturer and demographics such as gender, pregnancy, oral contraception, and glucocorticoid medication. 12 Comparison with gas chromatography mass spectrometry (GC-MS) has also shown immunoassay bias in patients presenting with renal pathology, septic shock or to intensive care services.14,15 The poor inter-assay reproducibility inevitably results in variation in clinical outcome based on a patient’s presenting location.
Despite the well published poor performance of serum cortisol immunoassays in general, there is a paucity of data available on the performance of assays following the ONDST and how this may impact the universal 50 nmol/L cut-off.
Thus, the objective of this study was to assess the performance of three major routine immunoassays relative to an LC-MS/MS method in post-ONDST samples. Secondly, the present study aimed to determine the affect this performance might have on the interpretation of the ONDST.
Methods
Sample Handling
Between October 2015 and April 2021, 77 (M = 36, F = 41) post-dose ONDST blood samples were collected into serum separator tubes, sent to Wythenshawe Hospital for cortisol analysis, and retrieved prior to disposal. Samples sent into the laboratory from neighbouring hospitals were separated by centrifugation and aliquoted into fresh tubes to be transported at 4°C. Samples from Wythenshawe Hospital were separated and aliquoted into fresh tubes upon receipt at the laboratory and stored at 4°C before analysis. Samples were analysed routinely using LC-MS/MS at Wythenshawe Hospital. Following this, samples were retrieved, anonymized, and stored at −80°C until commencement of the present study. Upon immunoassay analysis, samples were defrosted, aliquoted, and re-frozen to be sent to participating laboratories. Samples were sent for cortisol analysis by Siemens AVIDA Centaur (Salford Royal Hospital) and Abbott Alinity Cortisol (Royal Oldham Hospital) immunoassays. Roche Elecsys Cortisol II analysis was performed at Wythenshawe hospital. At the time of analysis all assays were performing within the method mean for their respective external quality assessment (EQA) schemes and no internal quality control (IQC) issues were highlighted.
Liquid Chromatography Tandem Mass Spectroscopy
The LC-MS/MS cortisol analysis was performed using a previously published method. 16 This assay has ISO 15189 accreditation and is traceable to certified reference material (CRM). Further, this method has previously demonstrated its performance relative to a candidate reference measurement procedure (RMP). 12 This method achieves a limit of quantitation (LoQ) of 12.5 nmol/L.
To ensure appropriate compliance with the ONDST, to identify rapid metabolisers, and to identify slow absorbers, dexamethasone was also analysed on all samples. This was done using a previously published, ISO 15189 accredited LC-MS/MS method that is traceable to CRM. 17
Immunoassay Analysis
All three immunoassays were performed and calibrated on fully automated analysers according to manufacturer’s instructions. Details of the immunoassays investigated in the present study are given in Supplemental 1. At the time of analysis, all methods were performing acceptably in internal quality control studies and were within the respective method means for their group in external quality assurance schemes.
Exclusion Criteria
Post-dose dexamethasone concentrations of >3.3 nmol/L are adequate to suppress cortisol in healthy individuals.17,18 As such, dexamethasone was analysed on all samples using a previously published LC-MS/MS method 17 and those with dexamethasone ≤3.3 nmol/L were excluded (n = 18). Samples with cortisol below the LoQ for each assay (Roche <3 nmol/L, Abbott <27.6 nmol/L, Siemens <13.8 nmol/L, LC-MS/MS <12.5 nmol/L) could not be included in statistical comparisons, so were excluded (Roche n = 0, Siemens n = 0, Abbott n = 29, LC-MS/MS n = 1).
Clinical details that were readily available on the laboratory electronic requesting system were checked at the point of sample retrieval for the following factors, since they are known to affect the interpretation of the ONDST. Exogenous glucocorticoid administration (0), pregnancy (0), oral contraceptive pill (OCP) use (0), and known Cushing’s syndrome (0).
Patients (n = 6) were retrospectively excluded from comparison due to their results being consistent with hypercortisolism, despite this not being detailed on the request form. Two patients had post-ONDST cortisol >500 nmol/L, consistent with overt Cushing’s syndrome. N = 2 patients had post-ONDST cortisol >138 nmol/L, consistent with definite mild autonomous cortisol secretion (MACS), as defined in the European Society of Endocrinology 2016 clinical practice guidelines on the management of adrenal incidentalomas. 10 Patients with post-ONDST cortisol 50–138 nmol/L (n = 20), consistent with possible MACS, 10 were kept in the study since this has been found to produce a less pronounced increase in adrenal steroid precursors relative to overt hypercortisolism. 19
Finally, one patient was excluded from the Abbott analysis due to the sample being insufficient upon receipt. The number of samples of each comparison remaining were as follows: Roche n = 52 (M = 26, F = 26), Abbott n = 22 (M = 12, F = 10), and Siemens n = 52 (M = 26, F = 26).
Data Analysis
Statistical analysis was performed using Analyse-It (version 2.30, Leeds, UK). Each immunoassay was compared to LC-MS/MS using Passing–Bablok regression analysis and Bland–Altman plots.
Results
The performance of the Roche Elecsys Cortisol II immunoassay relative to the LC-MS/MS assay in post-ONDST samples is shown in Figure 1. Results from the two methods compared well, with the Roche showing a small, but statistically significant, negative bias. Figure 1(a) shows Passing–Bablok regression analysis and Figure 1(b) shows the Bland–Altman plot of the two methods. The Passing–Bablok linear regression intercept was −0.9 nmol/L (95% confidence interval (95% CI) −3.0 to 1.0 nmol/L), and the slope of the fit was 0.97 (95% CI 0.92–1.02). In Figure 1(b), the Bland–Altman plot showed a mean bias of −2.4 nmol/L (−5.8%) (95% CI: −3.3 to −1.6 nmol/L). Passing–Bablok regression analysis (a) and Bland–Altman plot (b) of serum cortisol following an ONDSTs when measured by a Roche Elecsys Cortisol II immunoassay compared to LC-MS/MS (n = 52). In A the grey line depicts the identity, and the dark line depicts the Passing–Bablok fit, which was y = −0.8814 + 0.985x. In B the solid line depicts the mean bias of the Roche immunoassay, which was −2.4 nmol/L, while the broken lines depict the 95% confidence intervals, which were −3.3 to −1.6 nmol/L.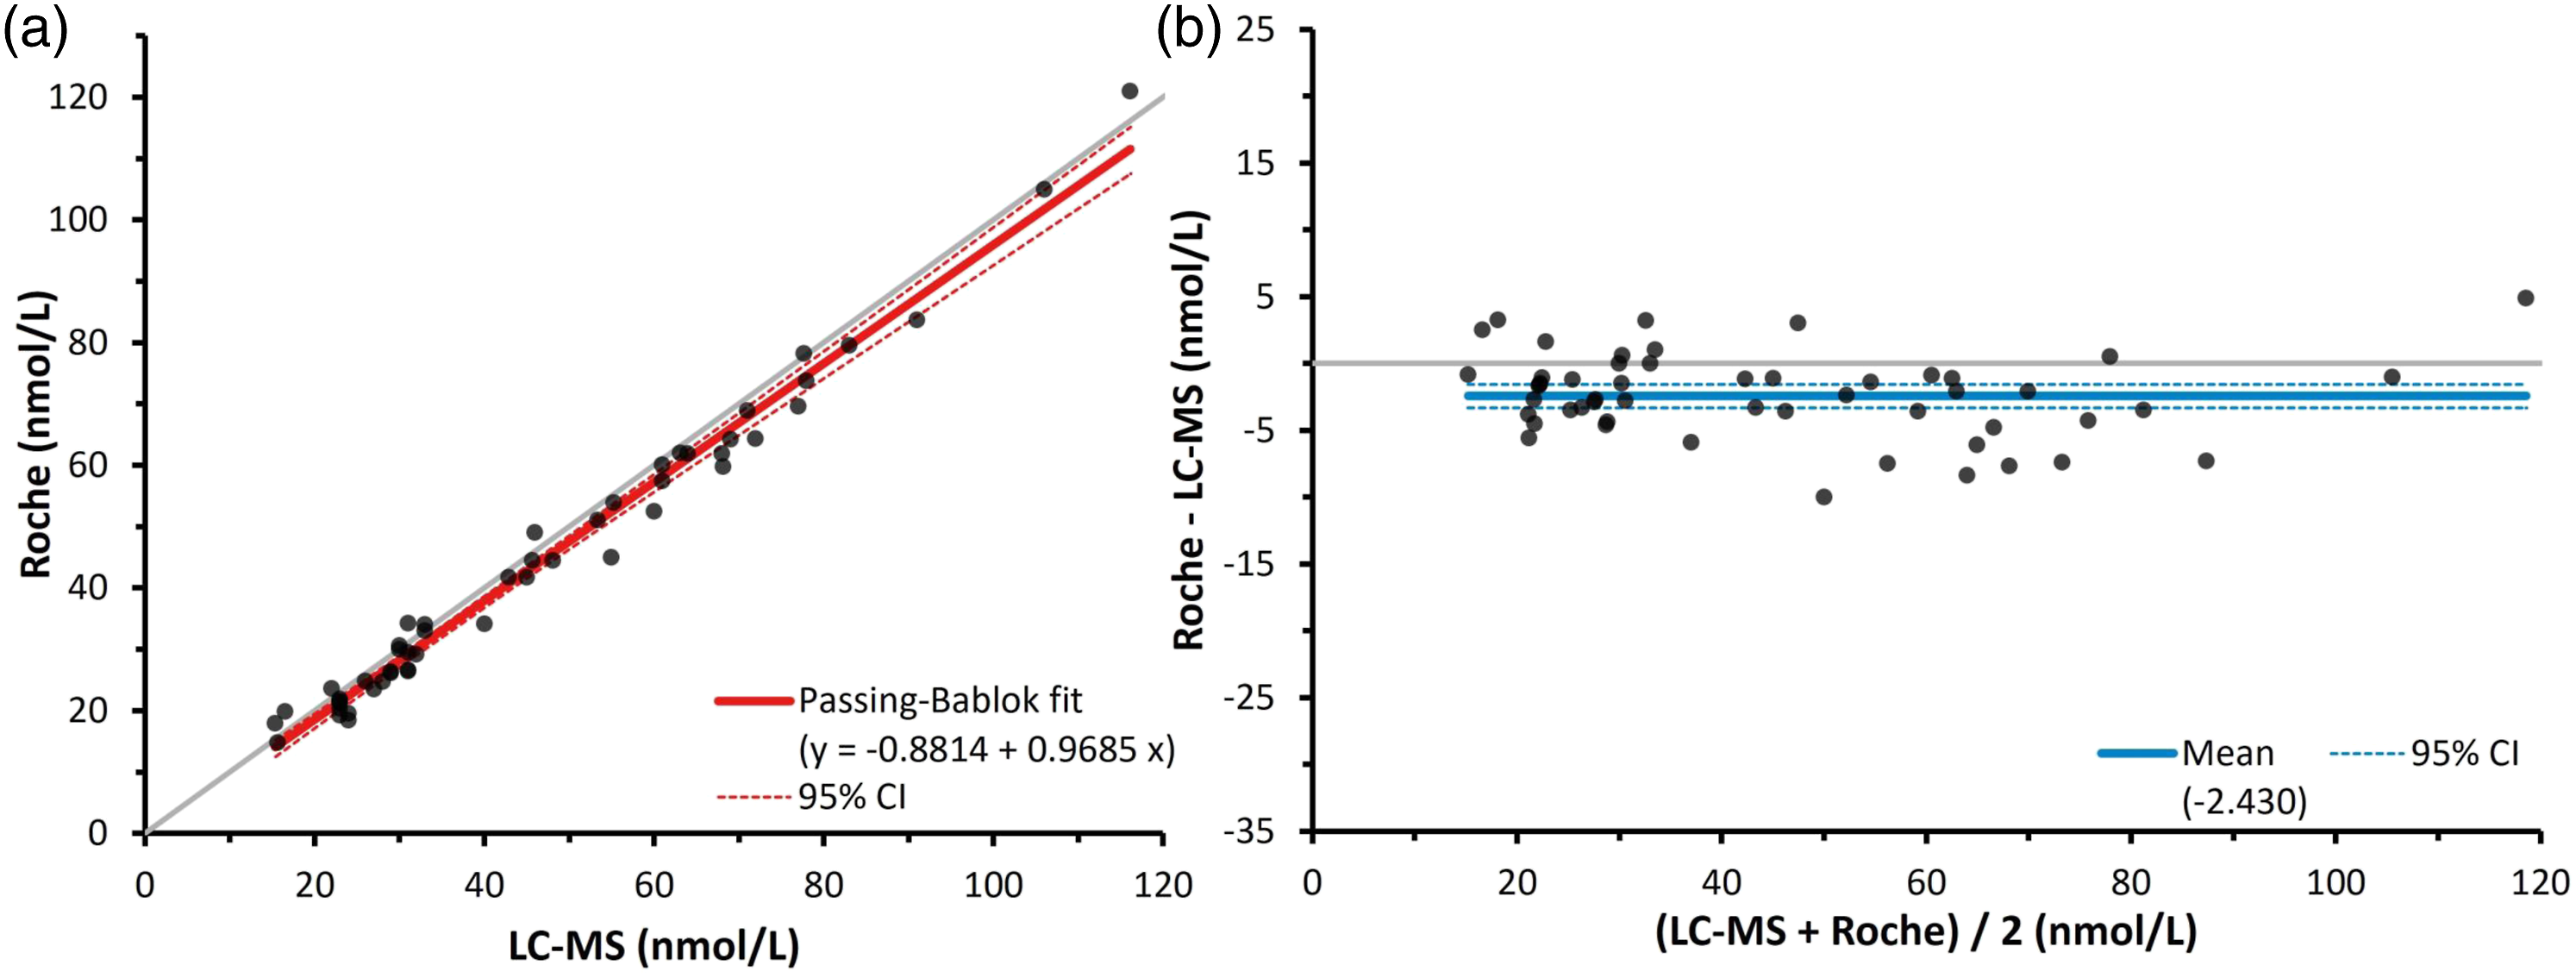
The performance of the Abbott Alinity cortisol immunoassay relative to an LC-MS/MS assay in post-ONDST samples is shown in Figure 2. Figure 2(a) shows Passing-Bablok regression analysis and Figure 2(b) shows the Bland–Altman plot of the two methods. Sizable constant and proportional bias was observed in Figure 2(a). The intercept was −11.3 nmol/L (95% CI: −25.4 to 1.5 nmol/), and the slope of the fit was 0.88 (95% CI: 0.66–1.08). The Bland–Altman plot agreed with this, yielding a mean bias of −18.8 nmol/L (−33.7%) (95% CI: −21.5 to −16.1 nmol/L). Passing–Bablok regression analysis (a) and Bland–Altman plot (b) of serum cortisol during ONDSTs when measured by an Abbott Alinity cortisol immunoassay compared to liquid chromatography mass spectrometry (n = 22). In A the grey line depicts the identity, and the dark line depicts the Passing-Bablok fit, which was y = −11.33 + 0.8761x. In B the solid line depicts the mean bias of the Abbott immunoassay, which was −18.8 nmol/L, while the broken lines depict the 95% confidence intervals, which were −21.5 to −16.1 nmol/L.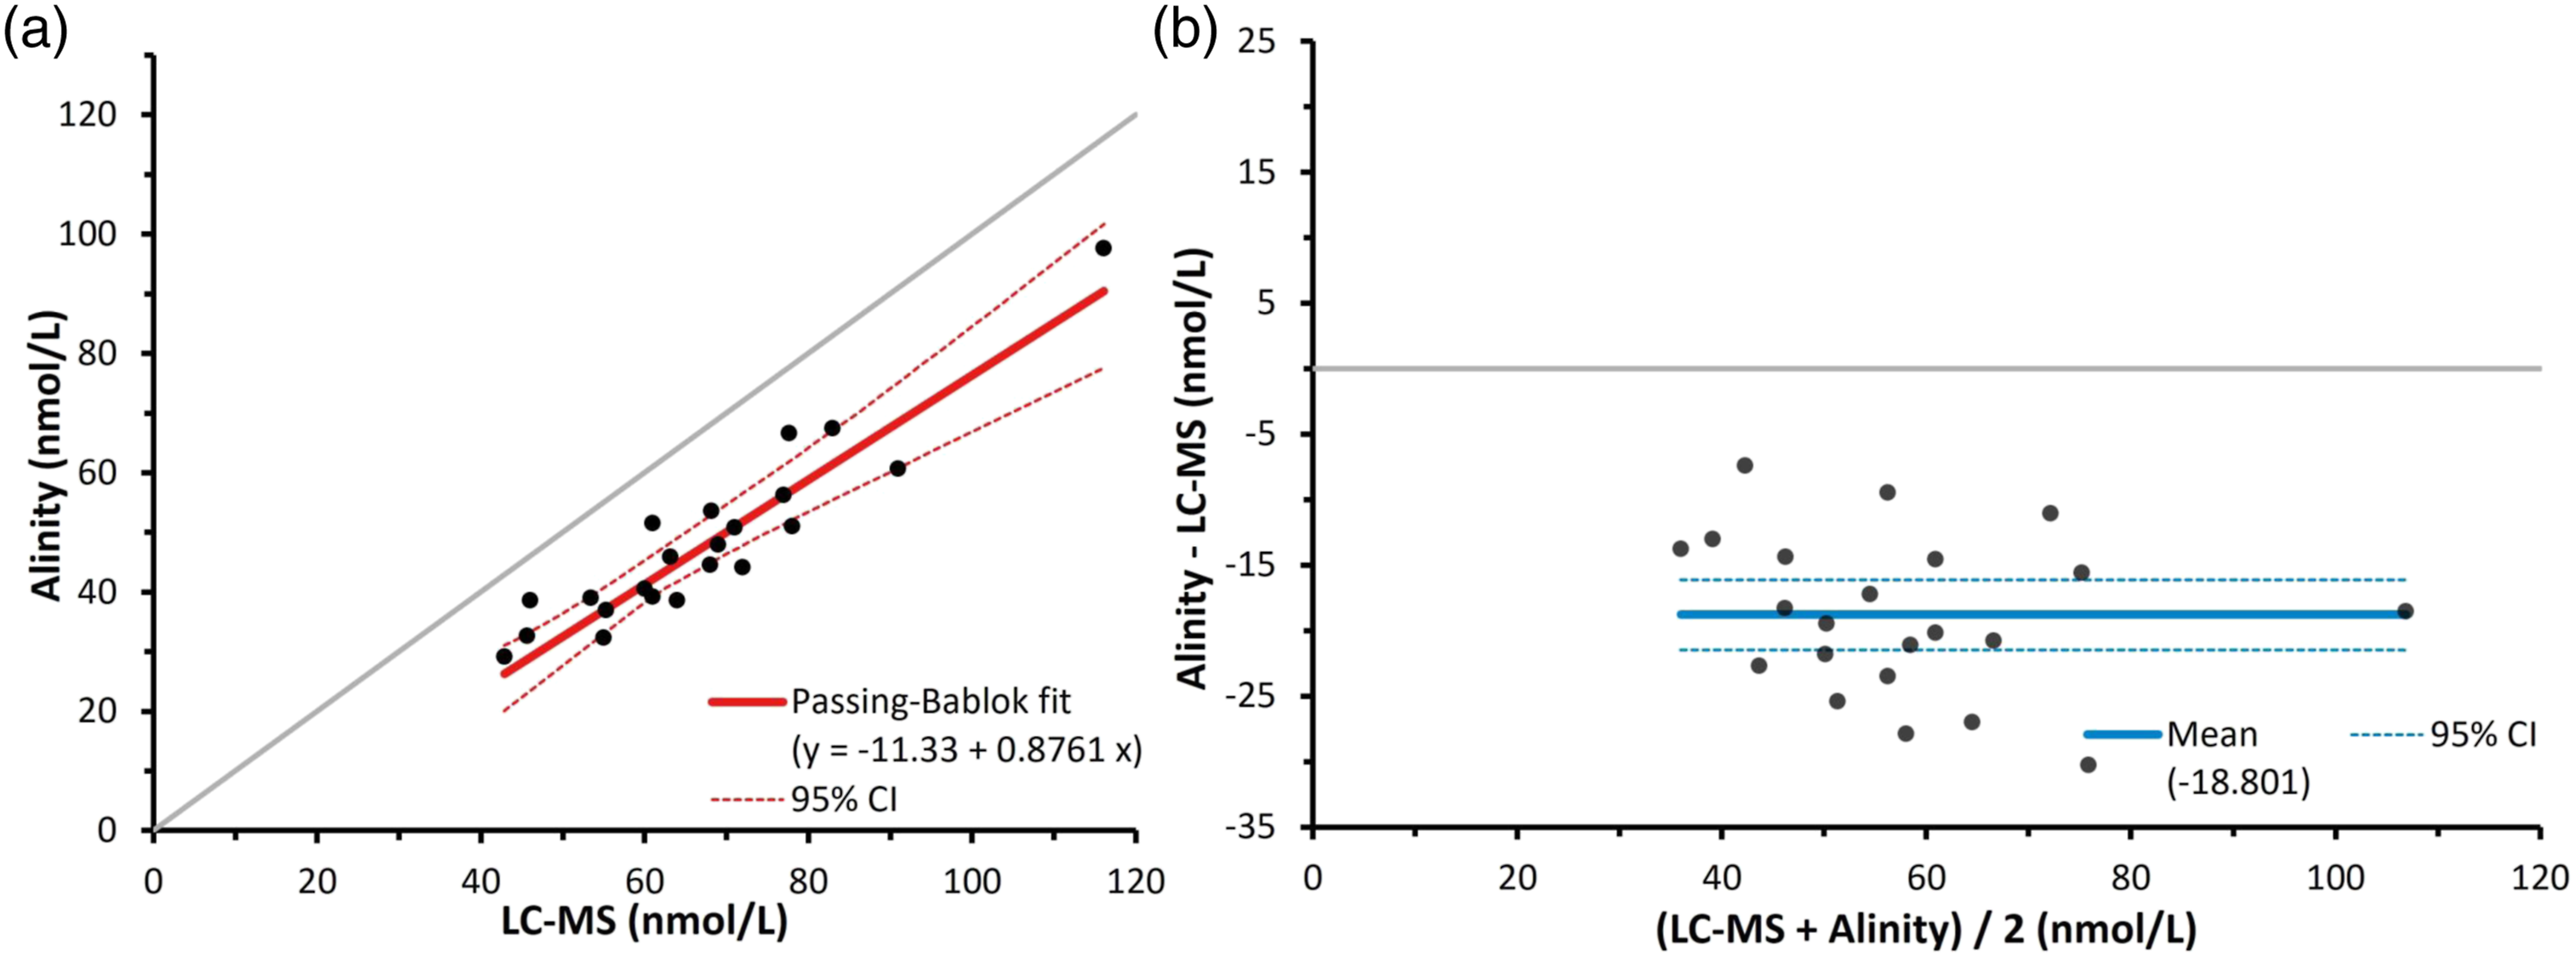
The performance of the Siemens AVIDA Centaur cortisol immunoassay relative to an LC-MS/MS assay in post-ONDST samples is shown in Figure 3. Figure 3(a) shows Passing–Bablok regression analysis and Figure 3(b) shows the Bland–Altman plot of the two methods. The intercept was −1.4 nmol/L (95% CI -6.2 to 3.5 nmol/L), and the slope of the fit was 1.07 (95% CI 0.95–1.22). Similarly, the Bland–Altman plot gave a mean bias of 2.3 nmol/L (4.4%) (95% CI 0.3–4.4 nmol/L). Passing–Bablok regression analysis (a) and Bland–Altman plot (b) of serum cortisol during ONDSTs when measured by a Siemens AVIDA Centaur Cortisol immunoassay compared to liquid chromatography mass spectrometry (n = 52). In A the grey line depicts the identity, and the dark line depicts the Passing–Bablok fit, which was y = −1.359 + 1.073x. In B the solid line depicts the mean bias of the Siemens immunoassay, which was 2.3 nmol/L, while the broken lines depict the 95% confidence intervals, which were 0.3–4.4 nmol/L.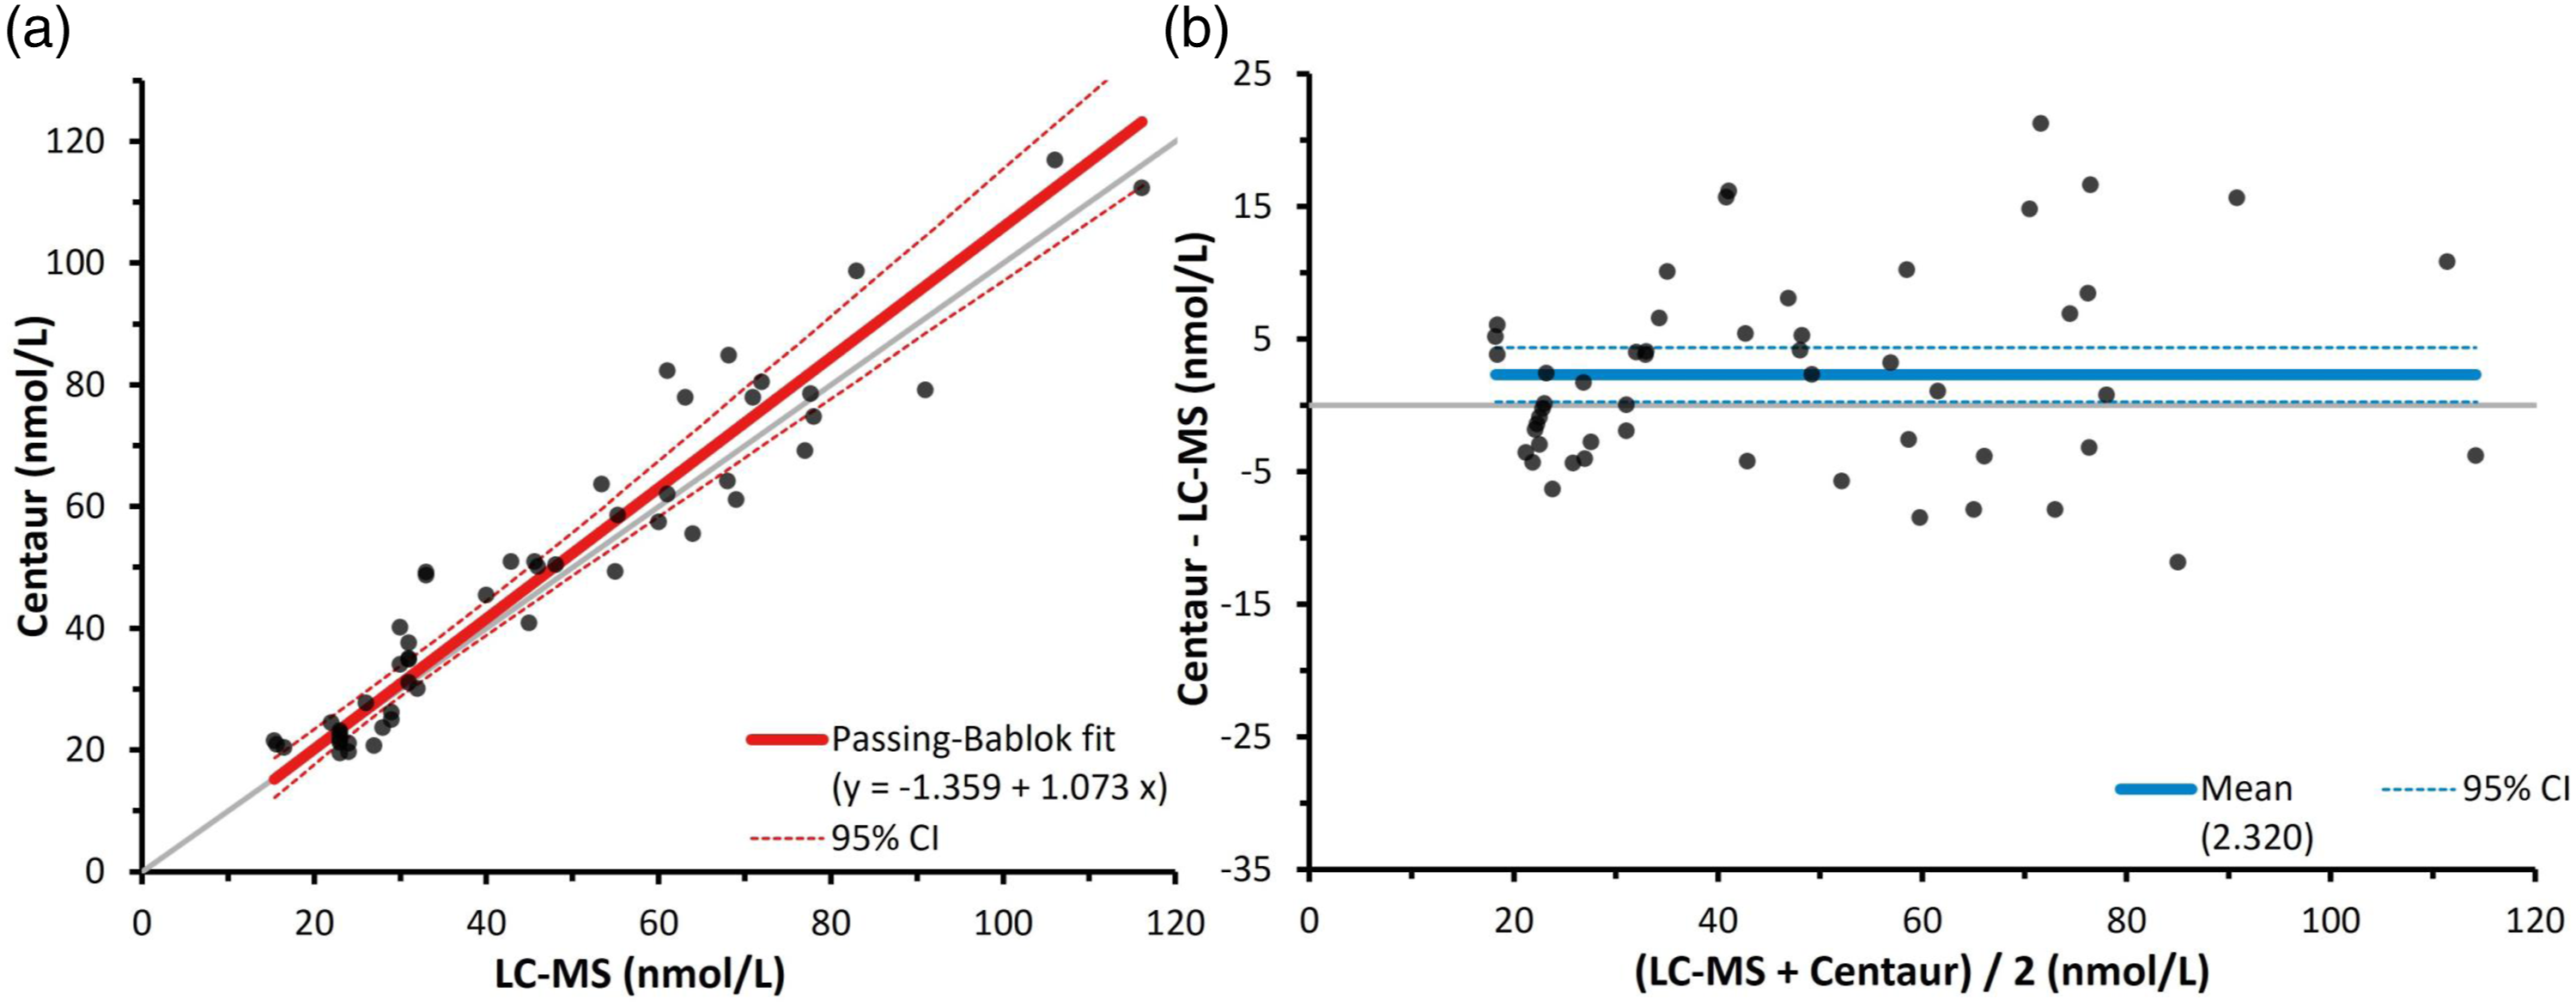
The performance of the Roche Elecsys Cortisol II relative to the LC-MS/MS assay in post-ONDST samples when split by sex is shown in Figure 4, as shown through Bland–Altman analysis. The good comparability shown by the Roche generation 2 in Figure 1 was not notably affected by sex, as both male and female results compared well to LC-MS/MS. Bland–Altman plots for male and female serum cortisol results during ONDSTs when measured by a Roche Elecsys Cortisol II immunoassay compared to liquid chromatography mass spectrometry (n = 52, M = 26, F = 26). The solid lines depict the mean biases of the Roche immunoassay, which were −2.6 nmol/L for the males (M) and −2.2 nmol/L for the females (F). The broken lines depict the 95% confidence intervals of these biases, which were −3.9 to −1.4 nmol/L for the males and −3.5 to −0.9 nmol/L for the females.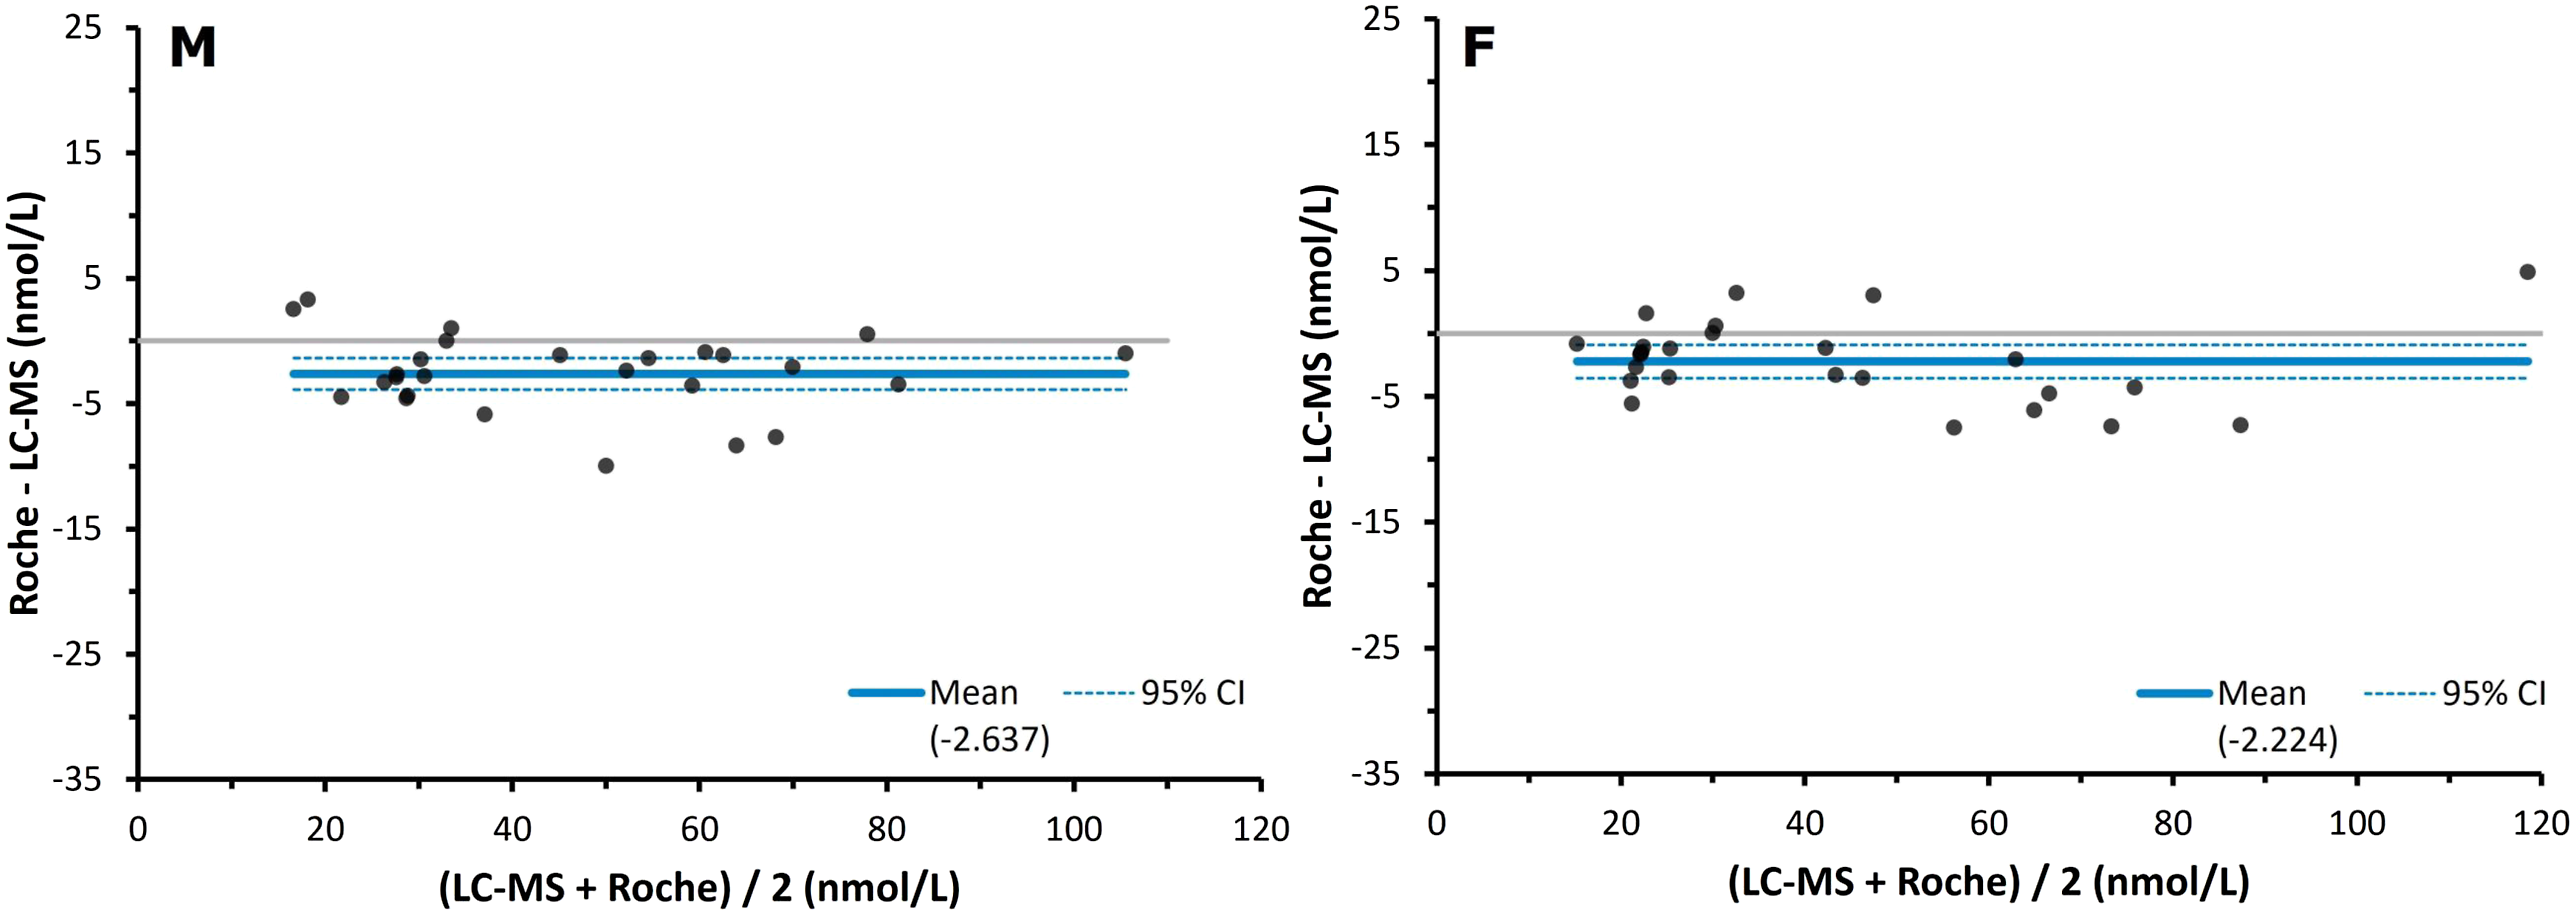
For males, the Passing–Bablok regression intercept was −2.4 nmol/L (95% CI -4.6 to 3.1 nmol/L), and the slope of the fit was 0.97 (95% CI 0.92–1.02). For females, the intercept was marginally better at −1.0 nmol/L (95% CI -4.7 to 1.0 nmol/L) and the slope was also 0.97 (95% CI 0.91–1.10). Male and female Bland–Altman plots showed similar mean biases of −2.6 nmol/L (−5.8%) (95% CI -3.9 to −1.4 nmol/L) and −2.2 nmol/L (−5.9%) (95% CI -3.5 to −0.9 nmol/L), respectively.
The performance of the Abbott Alinity relative to the LC-MS/MS assay in post-ONDST samples when split by sex is shown in Figure 5, as shown through Bland–Altman analysis. Bland–Altman plots for male and female serum cortisol results during ONDSTs when measured by a Abbott Alinity immunoassay compared to liquid chromatography mass spectrometry (n = 22, M = 12, F = 10). The solid lines depict the mean biases of the Abbott immunoassay, which were −17.2 nmol/L for the males (M) and −20.7 nmol/L for the females (F). The broken light blue line depicts the 95% confidence intervals of these biases, which were −20.6 to −13.8 nmol/L for the males and −25.5 to −16.0 nmol/L for the females.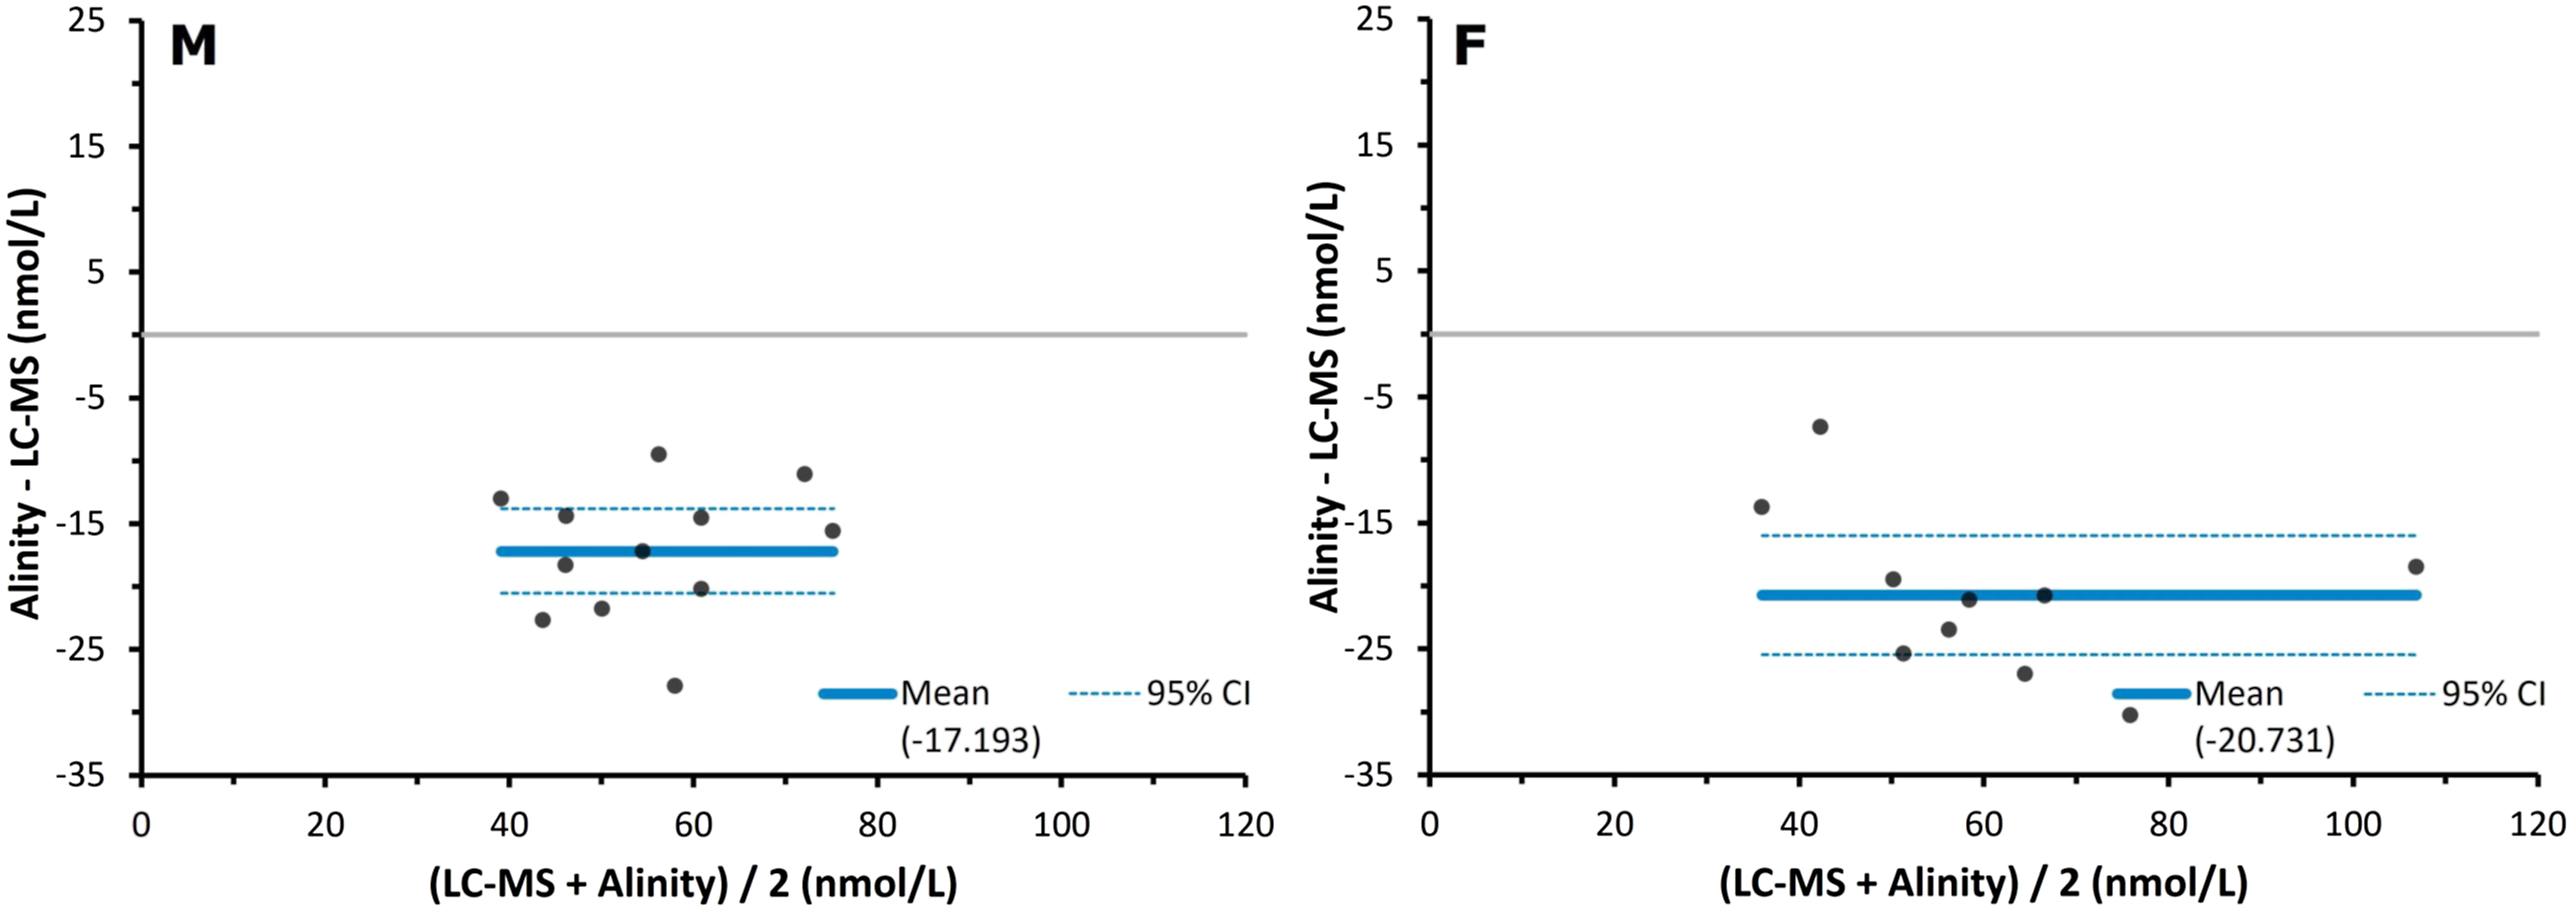
Passing-Bablok analysis showed a mixed bias in the male samples for the Abbott, with a slope of 1.12 (95% CI 0.71–1.51) with an intercept of −24.6 nmol/L (95% CI -50.6 to −0.4 nmol/L). This suggests a proportional positive bias, alongside with a large constant negative bias. In female samples the Abbott showed both proportional and constant negative bias, with a slope of 0.75 (95% CI 0.49–1.06) and an intercept of −3.9 nmol/L (95% CI -26.1 to 15.2 nmol/L). In Figure 5, a mean bias of −17.2 nmol/L (−32.5%) (95% CI -20.6 to −13.8 nmol/L) was observed in the male cohort. In the female cohort, a mean bias of −20.7 nmol/L (−35%) (95% CI -25.5 to −16.0 nmol/L) was observed.
The slight positive bias shown by the Siemens AVIDA Centaur immunoassay in Figure 3 was exacerbated in the male cohort and absent in the female cohort, as shown by the Bland–Altman analyses in Figure 6. For males, the Passing–Bablok regression plot showed an intercept of −5.8 nmol/L (95% CI -13.3 to 2.2 nmol/L) and a slope of 1.22 (95% CI 1.07–1.41). This is consistent with a negative constant bias alongside a proportional positive bias that was statistically significant in this cohort. In females the intercept was 1.2 nmol/L (95% CI -3.8 to 1.1 nmol/L), and the slope 0.94 (95% CI 0.85–1.13). This suggests the opposite to the males, with a slight constant positive bias mixed with a proportional negative bias. In Figure 5, the male cohort had a significant positive mean bias of 5.7 nmol/L (9.5%) (95% CI 2.6–8.7 nmol/L), while the females showed a slightly negative mean bias of −1.0 nmol/L (−0.7%) (95% CI -3.2 to 1.2 nmol/L). Bland–Altman plots for male and female serum cortisol results during ONDSTs when measured by a Siemens AVIDA Centaur immunoassay compared to liquid chromatography mass spectrometry (n = 52, M = 26, F = 26). The solid lines depict the mean biases of the Siemens immunoassay, which were 5.7 nmol/L for the males (M) and −1.0 nmol/L for the females (F). The broken lines depict the 95% confidence intervals of these biases, which were 2.6–8.7 nmol/L for the males and −3.2 to −1.2 nmol/L for the females.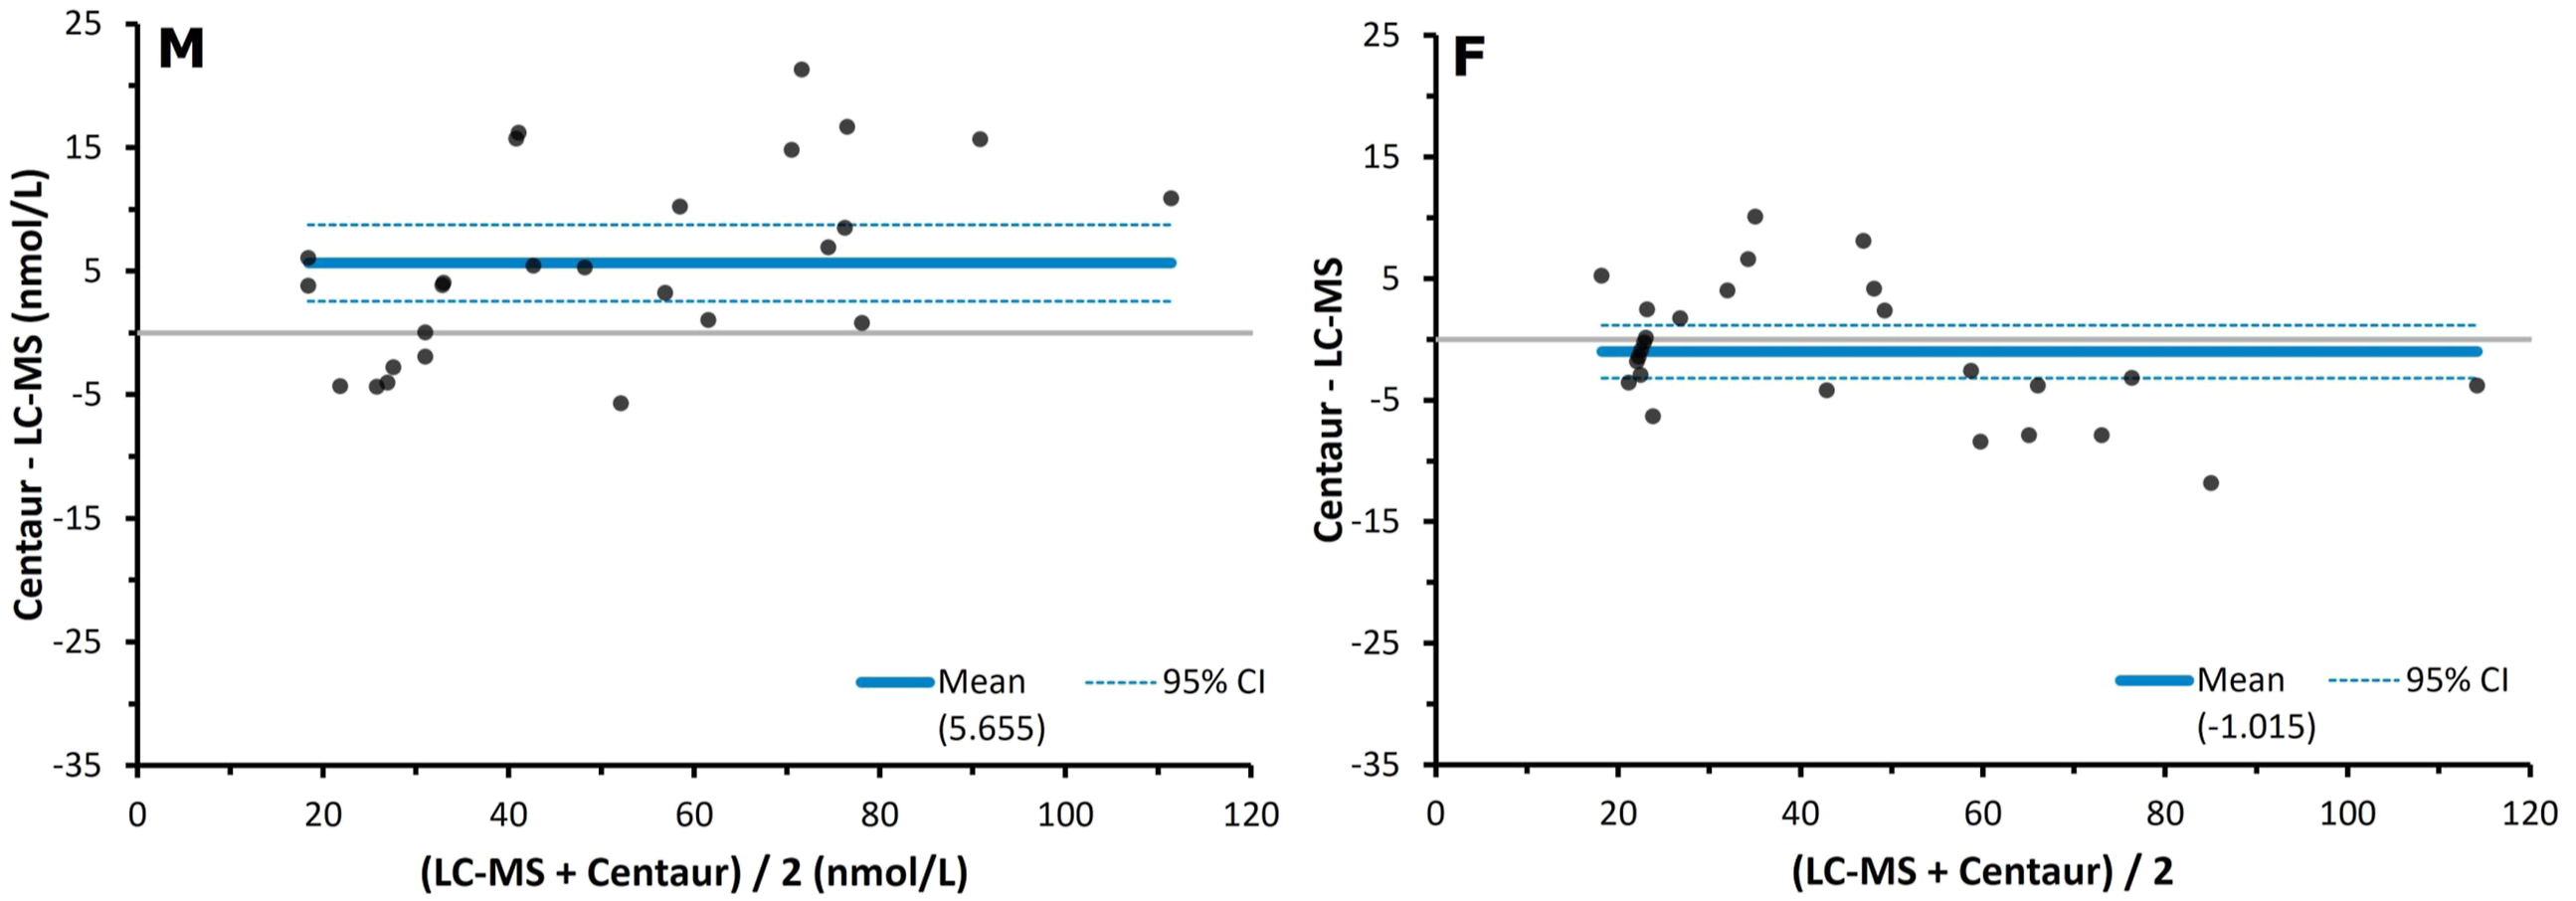
The frequency of incorrect patient investigation that would be caused by immunoassay application in the study cohort compared to mass spectrometry. Calculation of the percentage of patients that would be incorrectly classified during the ONDST by each immunoassay compared to results generated using mass spectrometry. Samples with results below the limit of quantitation were included (Roche n = 53, Siemens n = 53, Abbott n = 52).
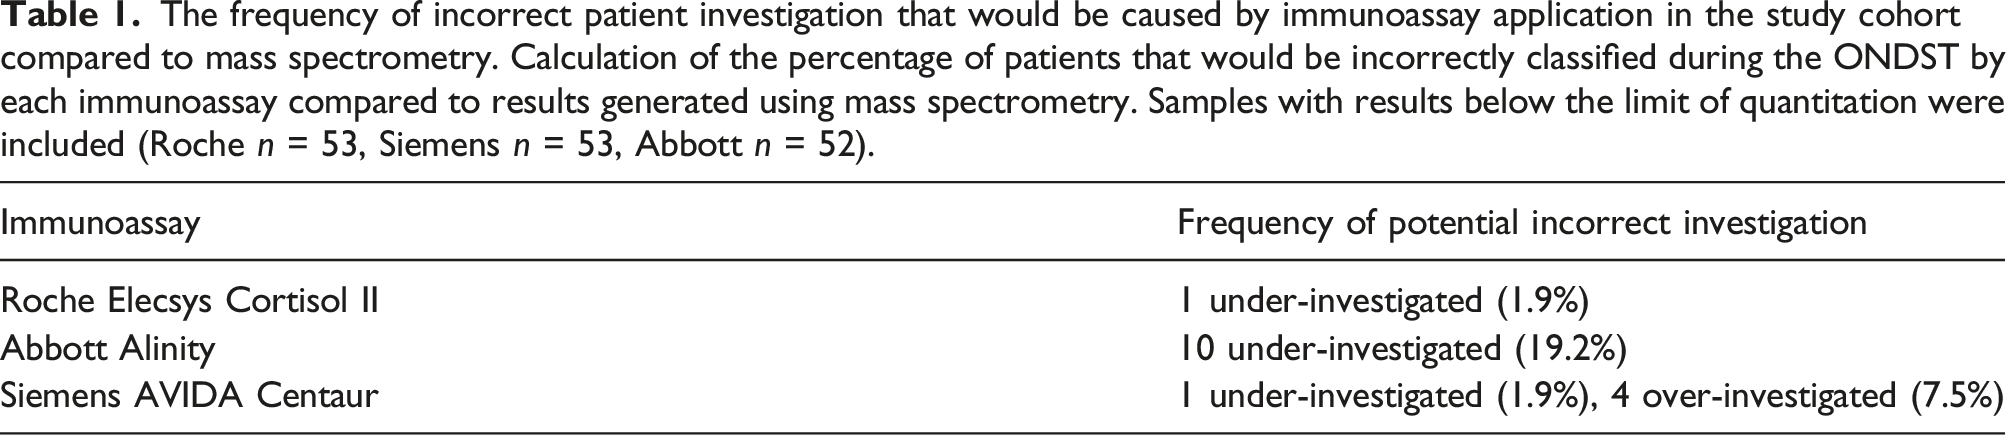
In total, the generation 2 Roche would have falsely identified 1 patient as having an appropriate post-ONDST cortisol, where our LC-MS/MS method identified them as having incomplete suppression. This represents 1.9% of the cohort. The Abbott Alinity would have falsely identified 10 patients as having appropriate adrenal suppression. This represents 19.2% of the cohort. The Siemens AVIDA Centaur falsely identified 1 patient as having an appropriate post-ONDST cortisol, representing 1.9% of the cohort. It also falsely identified 4 patients as having incomplete post-ONDST cortisol suppression in 4 patients, representing 7.5% of the cohort.
Discussion
The introduction of the generation 2 Roche Elecsys Cortisol II assay has improved upon the analytical specificity of the first generation.12,20 In the previous iteration, positive bias was observed in studies comparing the performance of the assay to GC-MS 14 and LC-MS/MS.15,21 This assay used polyclonal antibodies targeted at cortisol, which resulted in cross-reactivity with structurally analogous steroids.22,23 The use of a more specific monoclonal antibody in the generation 2 assay, in addition to employment of calibration standards traceable to an isotope dilution gas chromatography mass spectrometry (ID-GC/MS) reference method, 24 has significantly reduced this positive bias.12,20,25 These findings are corroborated in the current study. While the second-generation Roche assay was observed to have a significant negative bias relative to our LC-MS/MS method following the ONDST, this was only slight and was not affected by sex. Further, employment of this assay on our cohort would have only resulted in the under-investigation of 1 patient. Laboratories using the Roche Elecsys Cortisol II assay should be aware that post-ONDST cortisol results of ≥47.6 nmol/L (95% CI: ±1.7 nmol/L (3.6%)) may indicate inadequate adrenal suppression and could warrant further investigation for hypercortisolism.
Of the three immunoassays assessed, the Abbott immunoassay performed the worst relative to the LC-MS/MS method. Clinicians accessing ONDST results from laboratories employing an Abbott Alinity assay should consider that post-dose results of ≥31.2 nmol/L (95% CI: ±5.4 nmol/L (17.3%)) may be indicative of an inappropriate adrenal suppression and could warrant further investigation for hypercortisolism. Further, the finding that 19.2% of the patients in this cohort would have been incorrectly investigated, calls into question the sensitivity and clinical utility of this platform for the ONDST.
The Abbott is known to suffer difficulties liberating cortisol from CBG.12,13 Previous work done by this laboratory also found that the Abbott Architect assay produced negative biases in non-pregnant females and (to a lesser extent) males. 12 While the difference in bias between the male and female cohorts previously were comparable, these biases did not exceed −4.9% (−33.7% in the current study). The Alinity and Architect systems has previously shown good agreement, so this difference was surprising. 26 It is likely that this is due to the current focus on low cortisol concentrations during the ONDST. Prior to dexamethasone consumption, approximately 80% of cortisol is bound to CBG, 10% to albumin and a further 10% is free, providing biological activity. 27 Overnight, dexamethasone dramatically drops the production of adrenal steroids likely without affecting the amount of circulating CBG. This may lead to a greater percentage of cortisol in the bound fraction, exacerbating the issues the Alinity suffers and worsening the negative bias relative to other studies. The only other work on the effect of immunoassay variability on ONDST performance corroborates this, with a mean bias of 19.5 nmol/L in post-ONDST samples. 21
The Siemens AVIDA Centaur immunoassay showed a slight, but significant, positive bias in post-ONDST samples. Clinicians accessing ONDST results from laboratories employing the Siemens Centaur assay should be aware that results of ≤52.3 nmol/L (95% CI: ±4.1 nmol/L (7.8%)) may indicate appropriate adrenal suppression. It is also notable that the use of this assay may have resulted in 7.5% of the cohort being over-investigated and 1.9% being under-investigated. This may have implications on the clinical specificity of the ONDST when being performed using the Siemens immunoassay.
Clinicians may also consider that cortisol is more likely to be overestimated in their male patients relative to female patients. This should also be considered by clinicians accessing results analysed by the Abbott assay. The negative bias shown by the Abbott was exacerbated in female patients, and the positive bias produced by the Siemens was negated in the female patients. While both are likely due to matrix-dependent difficulty liberating cortisol from its binding proteins, the latter may also be influenced by non-specific cross-reactivity.
In healthy individuals, the ONDST causes the suppression of cortisol production, in addition to a host of structurally related steroids. 28 Metabolome studies implicate 11β-hydroxylase suppression in the significant reduction of corticosterone, 11-hydroxyandrostenedione, 11β-hydroxyetiocholanolone, 11β-hydroxyepiandrosterone, and 17-hydroxypregenolone levels. 28 However, individuals with syndromes of cortisol excess would experience a build-up of such metabolites that is resistant to suppression and proportional to cortisol concentration.29,30 The inability of the Siemens antibodies to discern between these steroids may explain the positive bias seen in the male cohort and when both cohorts are combined. This has particular relevance when differentiating Cushing’s from clinically similar conditions such as polycystic ovary syndrome (PCOS). Previous work demonstrates increased glucocorticoids and glucocorticoid metabolites present in PCOS patients, which may have a detrimental effect on the diagnostic specificity of the Siemens assay in this cohort. 31 This will potentially limit the ONDSTs power to decern the two conditions from one another.
The absence of this effect in the female cohort suggests a concurrent negative bias due to differences between the male and female serum matrices. It is well understood that oestrogenic states increase the circulating concentration of cortisol binding globulin (CBG). 32 This includes in pregnancy33,34 and in women taking the oral contraceptive pills (OCP),35,36 but would also be expected in non-pregnant females not taking contraception. The result of this physiological difference is an under recovery of cortisol due to a reduced ability to liberate it from CBG. 37 This may explain this pattern of negation of the positive bias seen in the Siemens assay, and the worsened negative bias seen in the Abbott assay, in female serum. Previous work done by this laboratory showed a similar pattern. 12 In the Siemens assay, Hawley et al. observed an 18.5% and 14.6% bias in the male and non-pregnant female cohorts respectively. Similarly, Hawley et al. noticed a worsened negative bias in their non-pregnant female cohort with the Abbott immunoassay. The corroboration of this study with the present adds confidence to these findings.
Little is known regarding the methods used by immunoassays to strip cortisol from CBG. The few published immunoassay methods that exist are from pre-commercial iterations, however, these mention using changes in temperature and pH or protein binding agents, such as 8-anilino-1-napthalene sulfonic acid (ANS) or salicylate38,39,40. Immunoassays relying on ANS may struggle with complete cortisol recovery in patients with raised CBG, since its efficiency is inversely proportional to binding globulin concentration. 40 Further, these immunoassays must be stringent in their use of ANS, since it is known to inactivate antibodies. 41 This necessitates conservative use and makes under recovery hard to avoid.
There are certain limitations to the current study that must be acknowledged. The main is that since it is retrospective, all factors affecting the outcome of the ONDST and the analytical performance of the immunoassays could not be fully accounted for. Positive bias may be introduced by exogenous glucocorticoids, patients taking metyrapone, 12 previously diagnosed Cushing’s syndrome and definite MACS.19,29,42 Negative bias may be introduced by pregnancy and oral contraceptive pill use.34,35 While we have mitigated this by checking the clinical details that were readily available on the laboratory’s digital requesting system, this cannot be excluded with absolute certainty. However, since there are no outliers observed in the comparison analyses, we suggest that these factors are either not present in this cohort or are not having a significant effect.
Further, many samples were stored for extended periods prior to analysis. While cortisol is a stable analyte when frozen in serum, this is another potential source of inaccuracy. Finally, the relatively low number of samples included in the Abbott Alinity comparison, due to the high assay’s high LoQ, is also a potential source of inaccuracy. This is the likely cause of the relatively large 95% CIs observed for these comparison results. Again, we have ensured true comparison by excluding samples that might spuriously affect results. Good comparison to previous work in this area, as previously mentioned, suggests this does not have a significant effect on the current study.
Prospective, case-controlled studies would be necessary to propose alternative ONDST reference intervals for each analytical platform. This would be welcomed, particularly since the well-established reference interval of 50 nmol/L was developed using radioimmunoassay’s 43 and may need updating using more reliable methods.
Conclusions
The results presented here evidence the continuing variability in performance between differing immunoassay platforms. While the introduction of the generation 2 Roche assay seems to have improved the previous iterations issues with cross-reactivity, this influence remains in the Siemens assay. Both the Siemens and the Abbott struggle with completely recovering cortisol from its binding proteins. These analytical factors have clinical implications for the investigation of syndromes of hypercortisolism. Clinicians should be aware of the performance of the method employed by their hospital laboratory. The information presented here supports the notion of method-specific reference intervals for the overnight dexamethasone suppression test.
Supplemental Material
Supplemental Material - Serum cortisol assay performance following the 1 mg overnight dexamethasone suppression test
Supplemental Material for Serum cortisol assay performance following the 1 mg overnight dexamethasone suppression test by Jonathan S Atkins, James M Hawley, Laura J Owen, Jonathan Clayton, Jonathan Scargill and Brian G Keevil in Annals of Clinical Biochemistry
Footnotes
Declaration of conflicting interests
The author(s) declared no potential conflicts of interest with respect to the research, authorship, and/or publication of this article.
Funding
The author(s) received no financial support for the research, authorship, and/or publication of this article.
Ethical approval
Not needed.
Guarantor
BGK.
Contributorship
BGK and JMH conceived of the study. JSA, LJO, JS, and JC performed the analyses. JSA processed the data and prepared the first draft of the manuscript. All authors reviewed and edited the manuscript and approved the final version.
Supplemental material
Supplemental material for this article is available online.
Appendix
References
Supplementary Material
Please find the following supplemental material available below.
For Open Access articles published under a Creative Commons License, all supplemental material carries the same license as the article it is associated with.
For non-Open Access articles published, all supplemental material carries a non-exclusive license, and permission requests for re-use of supplemental material or any part of supplemental material shall be sent directly to the copyright owner as specified in the copyright notice associated with the article.