
Abstract
Background
Laboratories should be aware of the stability of the analytes they are testing in order to avoid incorrect reporting and patient management. Stability studies are difficult to interpret and reproduce, with little guidance on how to determine appropriate clinical cut off values. Here we describe a standardised approach to determining stability for routine haematinics tests using published EFLM guidelines.
Methods
The haematinics panel at UHNM contains vitamin B12, folate, ferritin, iron and transferrin. Blood tubes included were serum separator tubes, gel-free serum and lithium-heparin plasma. Conditions tested were room temperature, 2–8°C and −20°C. For each condition and tube, three samples were analysed in duplicate at 0, 24, 48, 72, 96 and 120 h using the Siemens Atellica platform.
Results
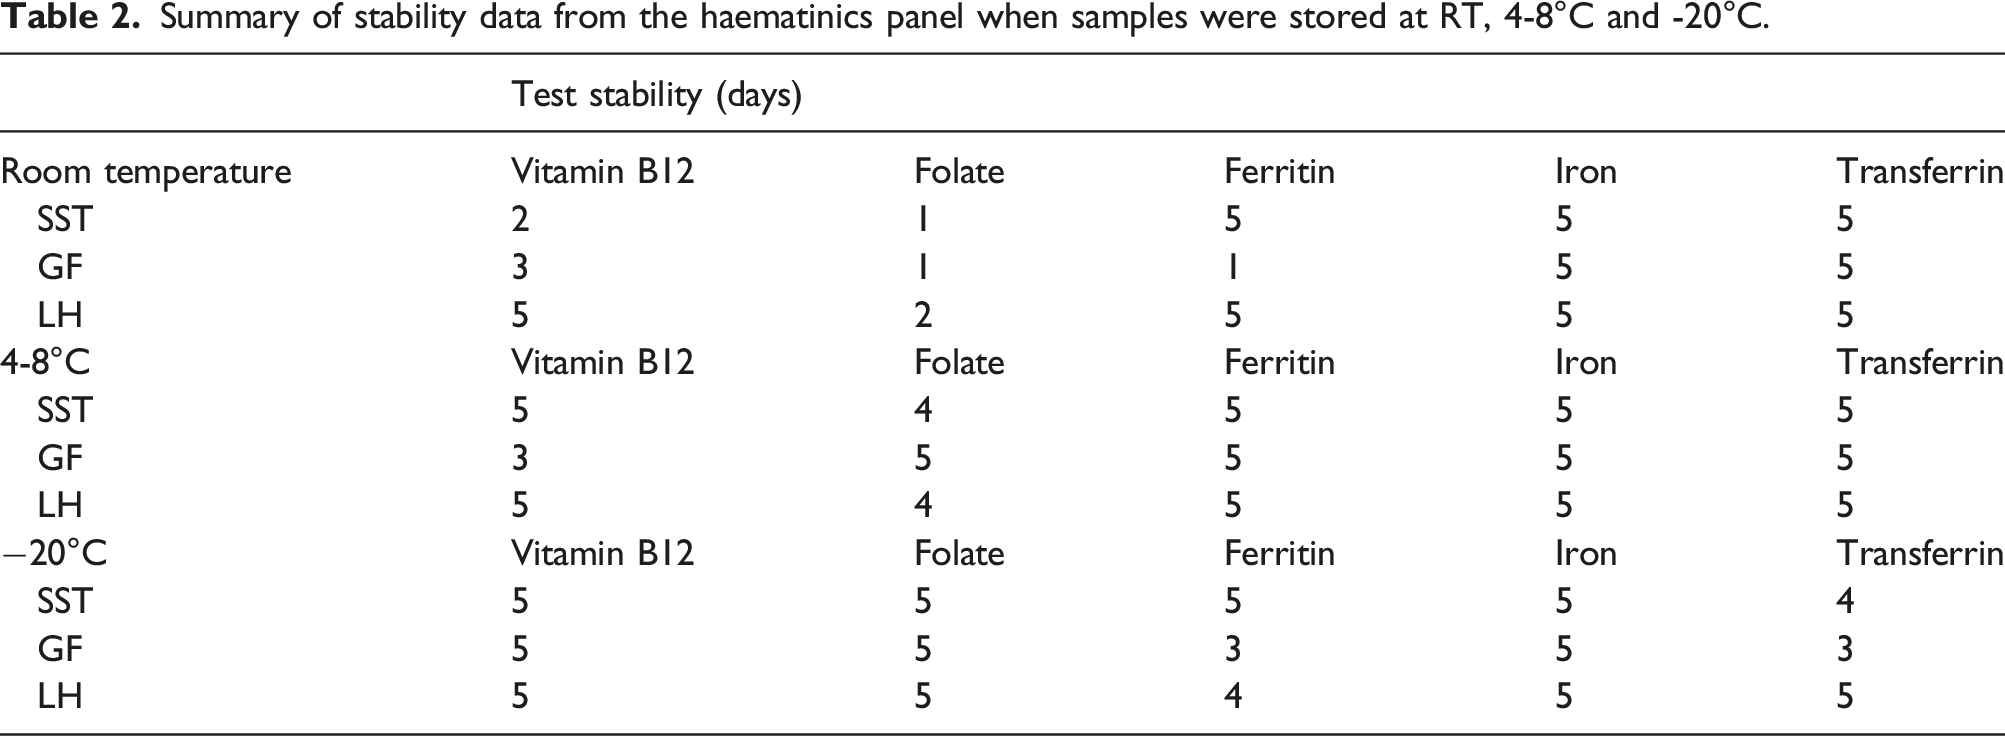
The percentage difference was calculated for each respective blood tube and storage condition, in addition to individual analyte maximum permissible instability scores. The majority of analytes for all blood tubes were stable for 5 days or more when stored at 4–8°C and −20°C. Ferritin (excluding gel-free), iron and transferrin further showed stability >5 days when stored at room temperature. However, vitamin B12 and folate demonstrated poor stability data for all tube types tested.
Conclusions
Here we describe a stability study for the haematinics panel on the Siemens Atellica platform using the standardised EFLM Checklist for Reporting Stability Studies (CRESS). The checklist was used in order to promote a standardised and transferable scientific approach to what has previously been lacking in the literature when performing stability experiments.
Introduction
A sound understanding of the pre-analytical phase is crucial for a modern pathology service to function properly. Up to 69% of errors occurring during sample processing have been reported to occur in the pre-analytical phase, most of which can be avoided.1–4 The most common variable thought to affect sample integrity is stability; with factors of light exposure, temperature, blood tube type, aliquoting samples and its contact with the air and/or cells should all be considered.1–6 Laboratories will often use their manufactures claims when reporting analyte stability. Users should be cautious of this approach, as these are often not based on the manufactures own original in-house studies, and often use out-dated data from older methods with little references to support their claims.1–8
Despite publications calling for the need of a standardised approach, up until recently there have been no guidelines on how to assess and report the stability of routinely measured analytes within a biochemistry laboratory.8,9 Studies and databases on the stability of analytes do exist; however, they all differ in both planning, execution and data interpretation, and often lacking in essential information in order for others to use their findings or reproduce similar results.8–13 The European Federation of Clinical Chemistry and Laboratory Medicine (EFLM) have recently published a Checklist for Reporting Stability Studies (CRESS) which consists of over 20 items to consider when performing a stability study (see supplementary information for checklist). 14
The haematinics panel at UHNM contains vitamin B12, folate, ferritin, iron and transferrin. Tests from this panel are commonly reflexed on as additional requests based on a patient’s initial blood results. In order to facilitate procedures to limit unnecessary re-bleeding, and to ensure samples can be stored for the appropriate period of time, here we describe a standardised approach to a stability study based on the abovementioned EFLM guidelines.
Aims of the study
The aim of this study is to determine the stability of the abovementioned analytes in gel-free clotted serum, serum separator tubes and lithium-heparin plasma, using a standardised method outlined in the CRESS published by the EFLM.
Materials and methods
The study was conducted in-line with EFLM guidelines and utilised the CRESS checklist.
Analytes included in the study
A haematinics request constitutes the following tests: vitamin B12, folate, ferritin, iron and transferrin.
Samples
Surplus serum/plasma samples taken for routine clinical care were identified in the laboratory. Three sample types were included in the study: serum separator tubes (SST), gel-free clotted serum tubes (GF) and lithium-heparin plasma (LH) tubes (all Becton Dickinson (BD) Vacutainer, Plymouth). Where possible, samples were collected to cover the entire analytical range for each assay. All patient identifiable data were removed. Samples older than 2 days were excluded from this study. Sample source included a combination of inpatient, outpatient and GP requests. For each test and tube type, three different patient samples were used.
Pre-analytical conditions
Samples were collected by trained phlebotomists using standard venepuncture technique in accordance with BD vacutainer guidelines. 15 Samples were transported to the laboratory either via the internal pneumatic tube system, porter or verified temperature controlled/monitored sample couriers. Samples were centrifuged at 3500 r/min for 7 min and only included in the study if this had taken place within 8 h of venepuncture. Samples which had been initially reported with a haemolysis index of ≥+1 (>0.45 g/L haemoglobin) were not included.
Stability for each tube type was assessed at different time points (0, 24, 48, 72, 96, 120 h) and under various storage conditions (room temperature (RT), 4–8°C and −20°C). RT was defined as an air conditioned room with a controlled temperature range between 20–25°C. Samples for RT, 4–8°C and −20°C were not pooled as recommended by the EFLM guidelines. 14 Samples for RT and 4–8°C were kept in their primary tube throughout. To avoid freezing the primary tube, as recommended by the manufacturer, samples stored at −20°C were aliquoted into multiple tubes and individually defrosted 1 h prior to analysis.
Analytical procedure
Laboratory tests included in the study were vitamin B12, folate, ferritin, iron and transferrin. Ferritin, iron and transferrin were run on the Siemens Atellica Chemistry platform and B12 and folate were run on the Immunoassay platform. IQC was run and accepted before any stability samples were analysed. Where possible assays were not re-calibrated during the course of the study to avoid introducing further variability in the sample analysis.
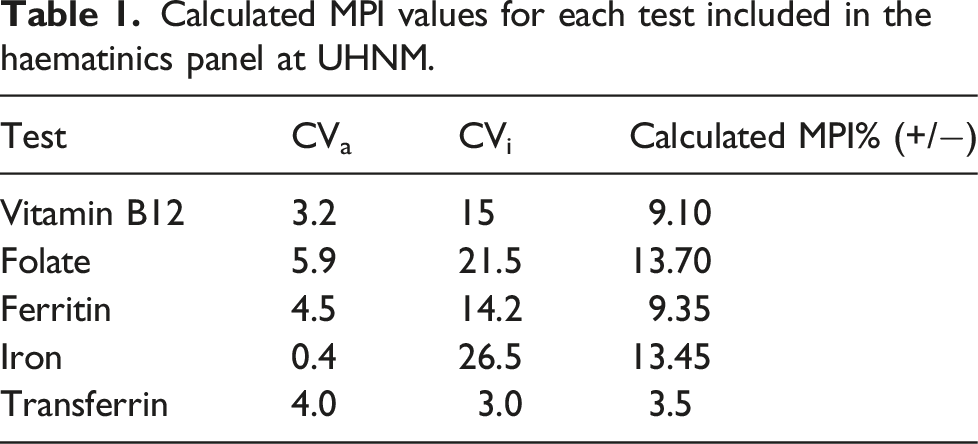
Acceptability criteria

Calculated MPI values for each test included in the haematinics panel at UHNM.
Statistical analysis
For each analyte, three patient samples across the analytical range were run in duplicate, with the total average from all patient samples per condition used to determine the percentage deviation (PD%).
14
This was calculated through the following equation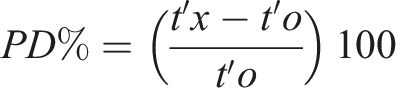
The PD% is defined as the difference between the measurand concentrations in optimal conditions (t’o), and its concentrations when stored for the stated storage time (t’x). The PD% was then plotted against time in hours, with the MPI highlighted on each graph to demonstrate when an analyte has exceeded its stability. Confidence intervals (95%) for each point were calculated using Microsoft Excel. A sample size calculation was not used in this study.
The expected instability equation was calculated using the following first-order equation
where expected PD (%) is the calculated percentage difference, ‘a’ is the slope of the equation and ‘t’ is the time point in days.
Results
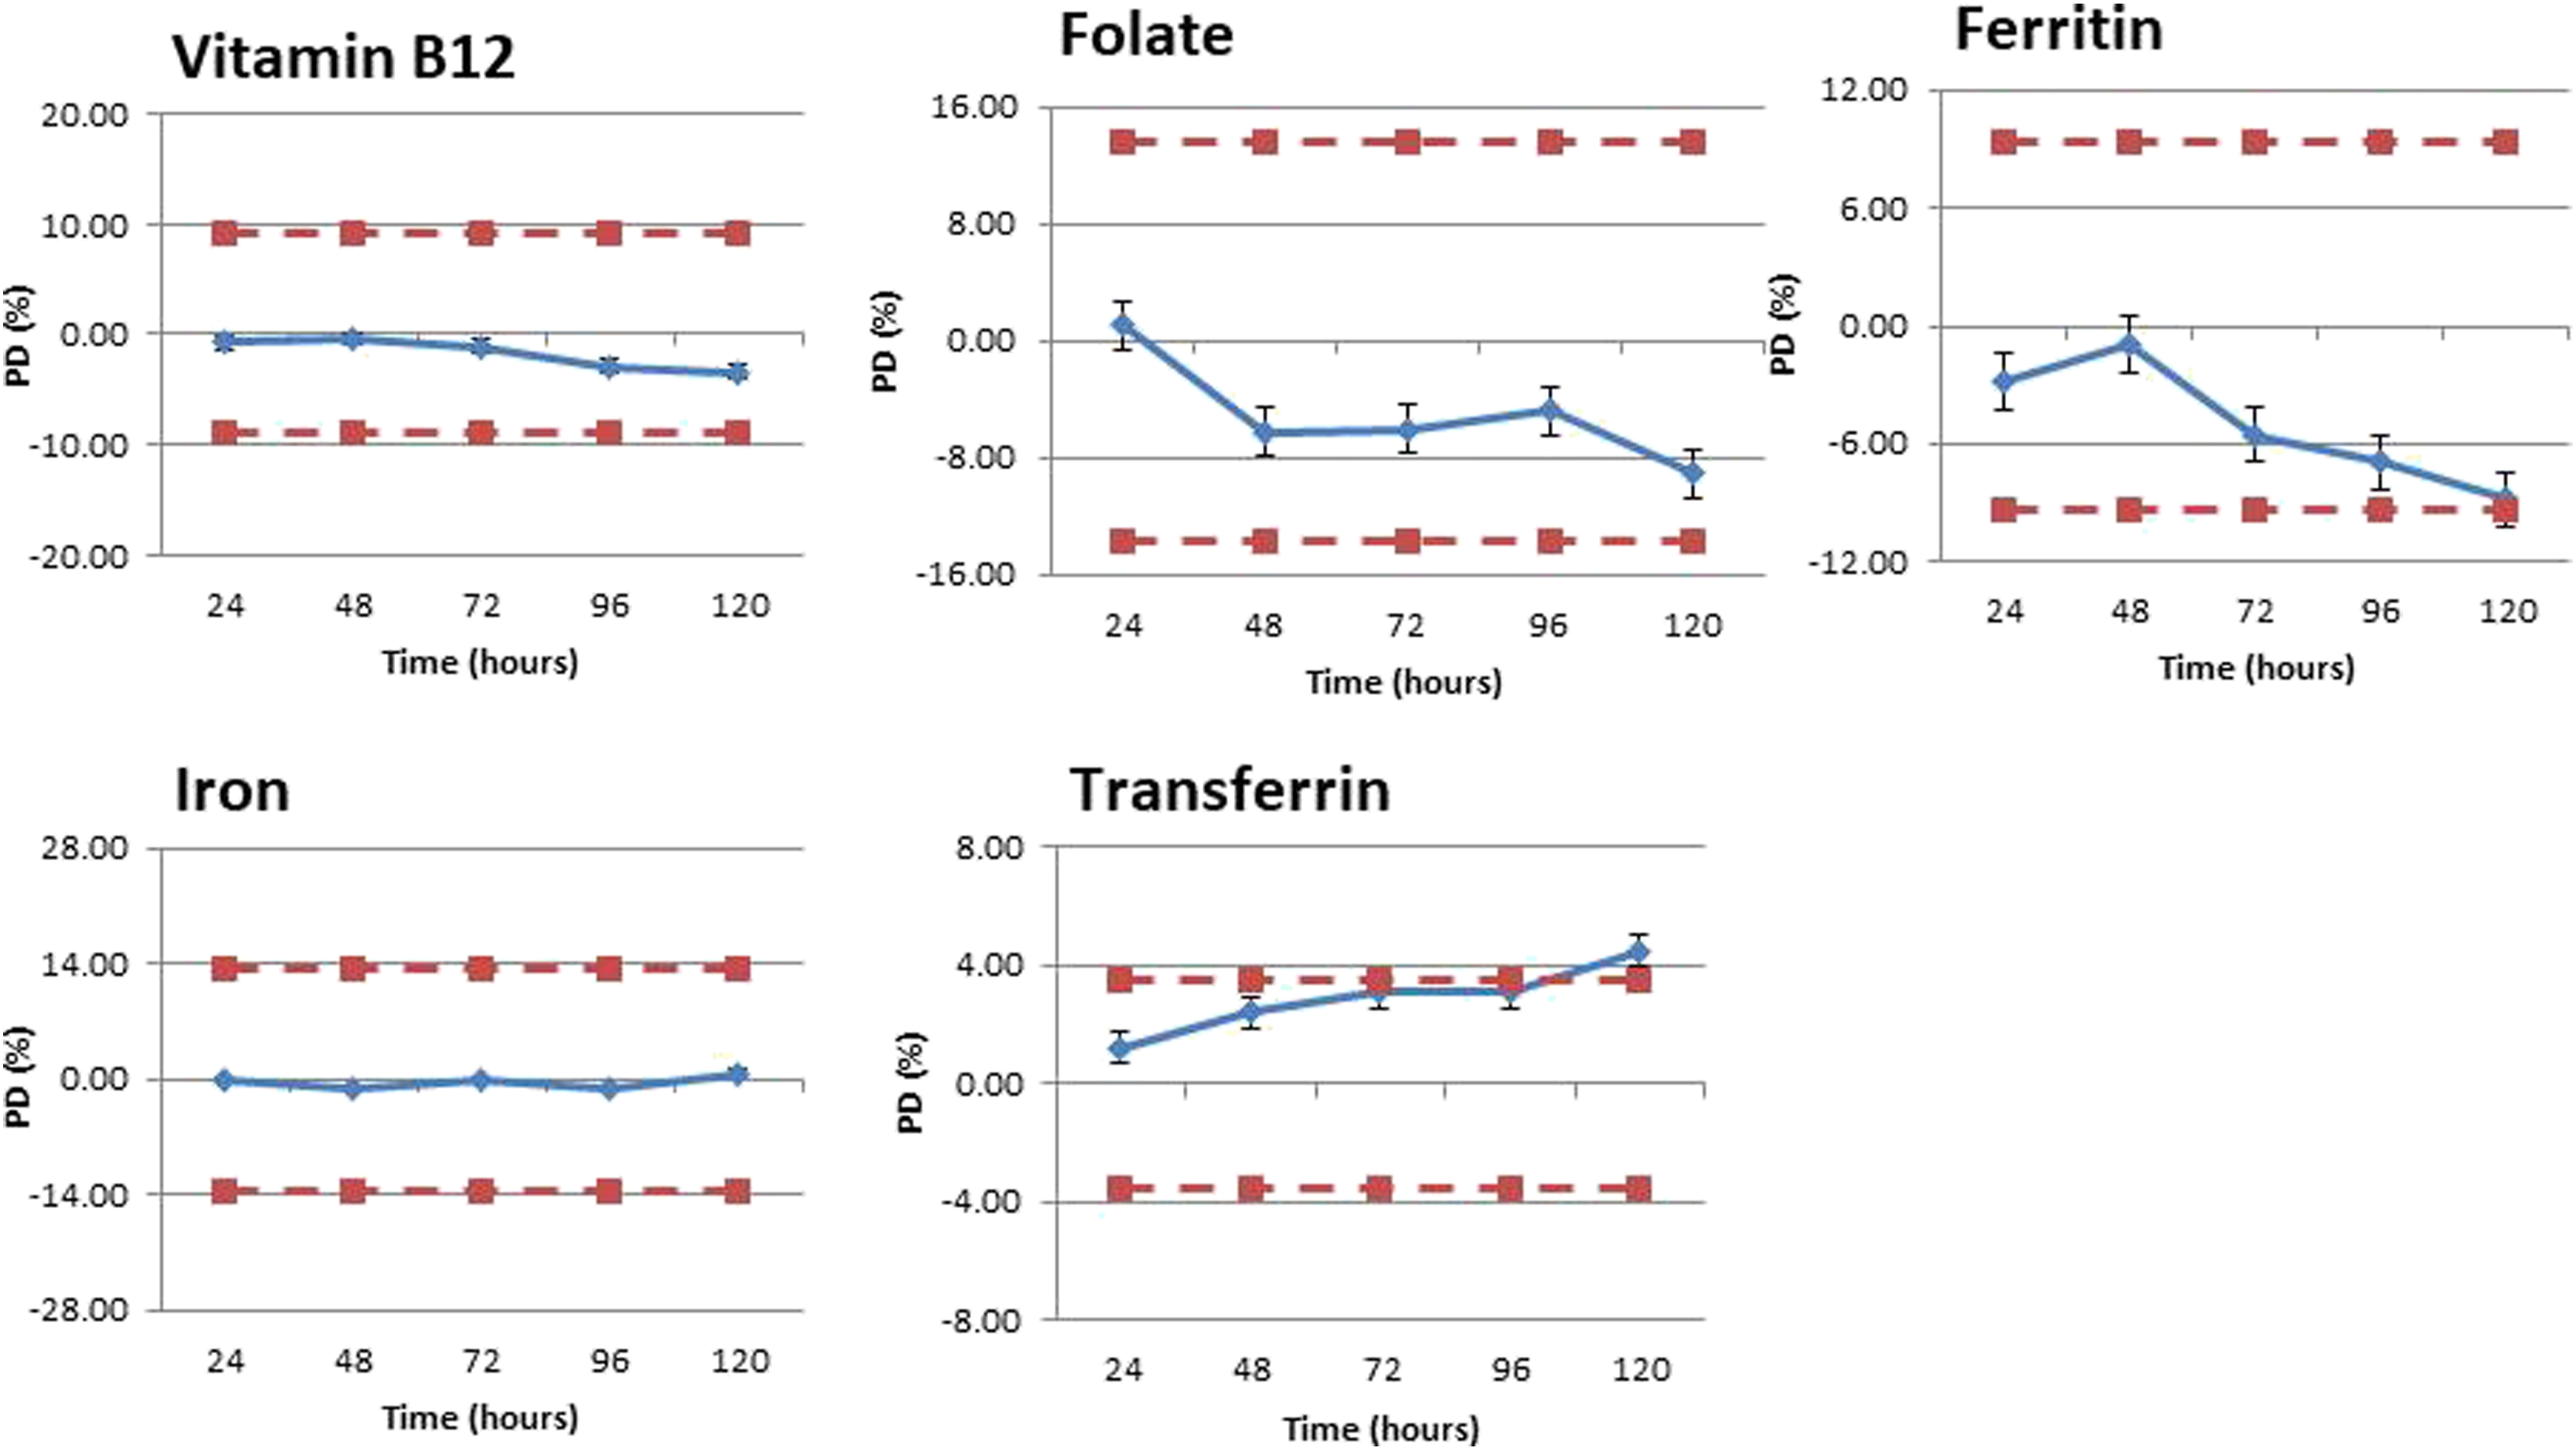
Stability data for vitamin B12, folate, ferritin, iron and transferrin in SST is shown in Figures 1–3 for the following conditions: RT, 4–8°C and −20°C. The respective raw data, and further stability data for gel-free serum and lithium-heparin plasma can be found in the supplementary information. Stability charts for SST at room temperature with percentage difference (%) plotted on the Y axis and time (hours) plotted on the X axis. Charts A–E represents B12, folate, ferritin, iron and transferrin, respectively. The positive/negative MPI for each individual analyte is also shown by the dotted line. Error bars represent calculated standard error for each analyte. Stability charts for SST at 4–8°C with percentage difference (%) plotted on the Y axis and time (hours) plotted on the X axis. Charts A–E represents B12, folate, ferritin, iron and transferrin, respectively. The positive/negative MPI for each individual analyte is also shown by the dotted line. Error bars represent calculated standard error for each analyte. Stability charts for SST at -20°C with percentage difference (%) plotted on the Y axis and time (hours) plotted on the X axis. Charts A–E represents B12, folate, ferritin, iron and transferrin, respectively. The positive/negative MPI for each individual analyte is also shown by the dotted line. Error bars represent calculated standard error for each analyte.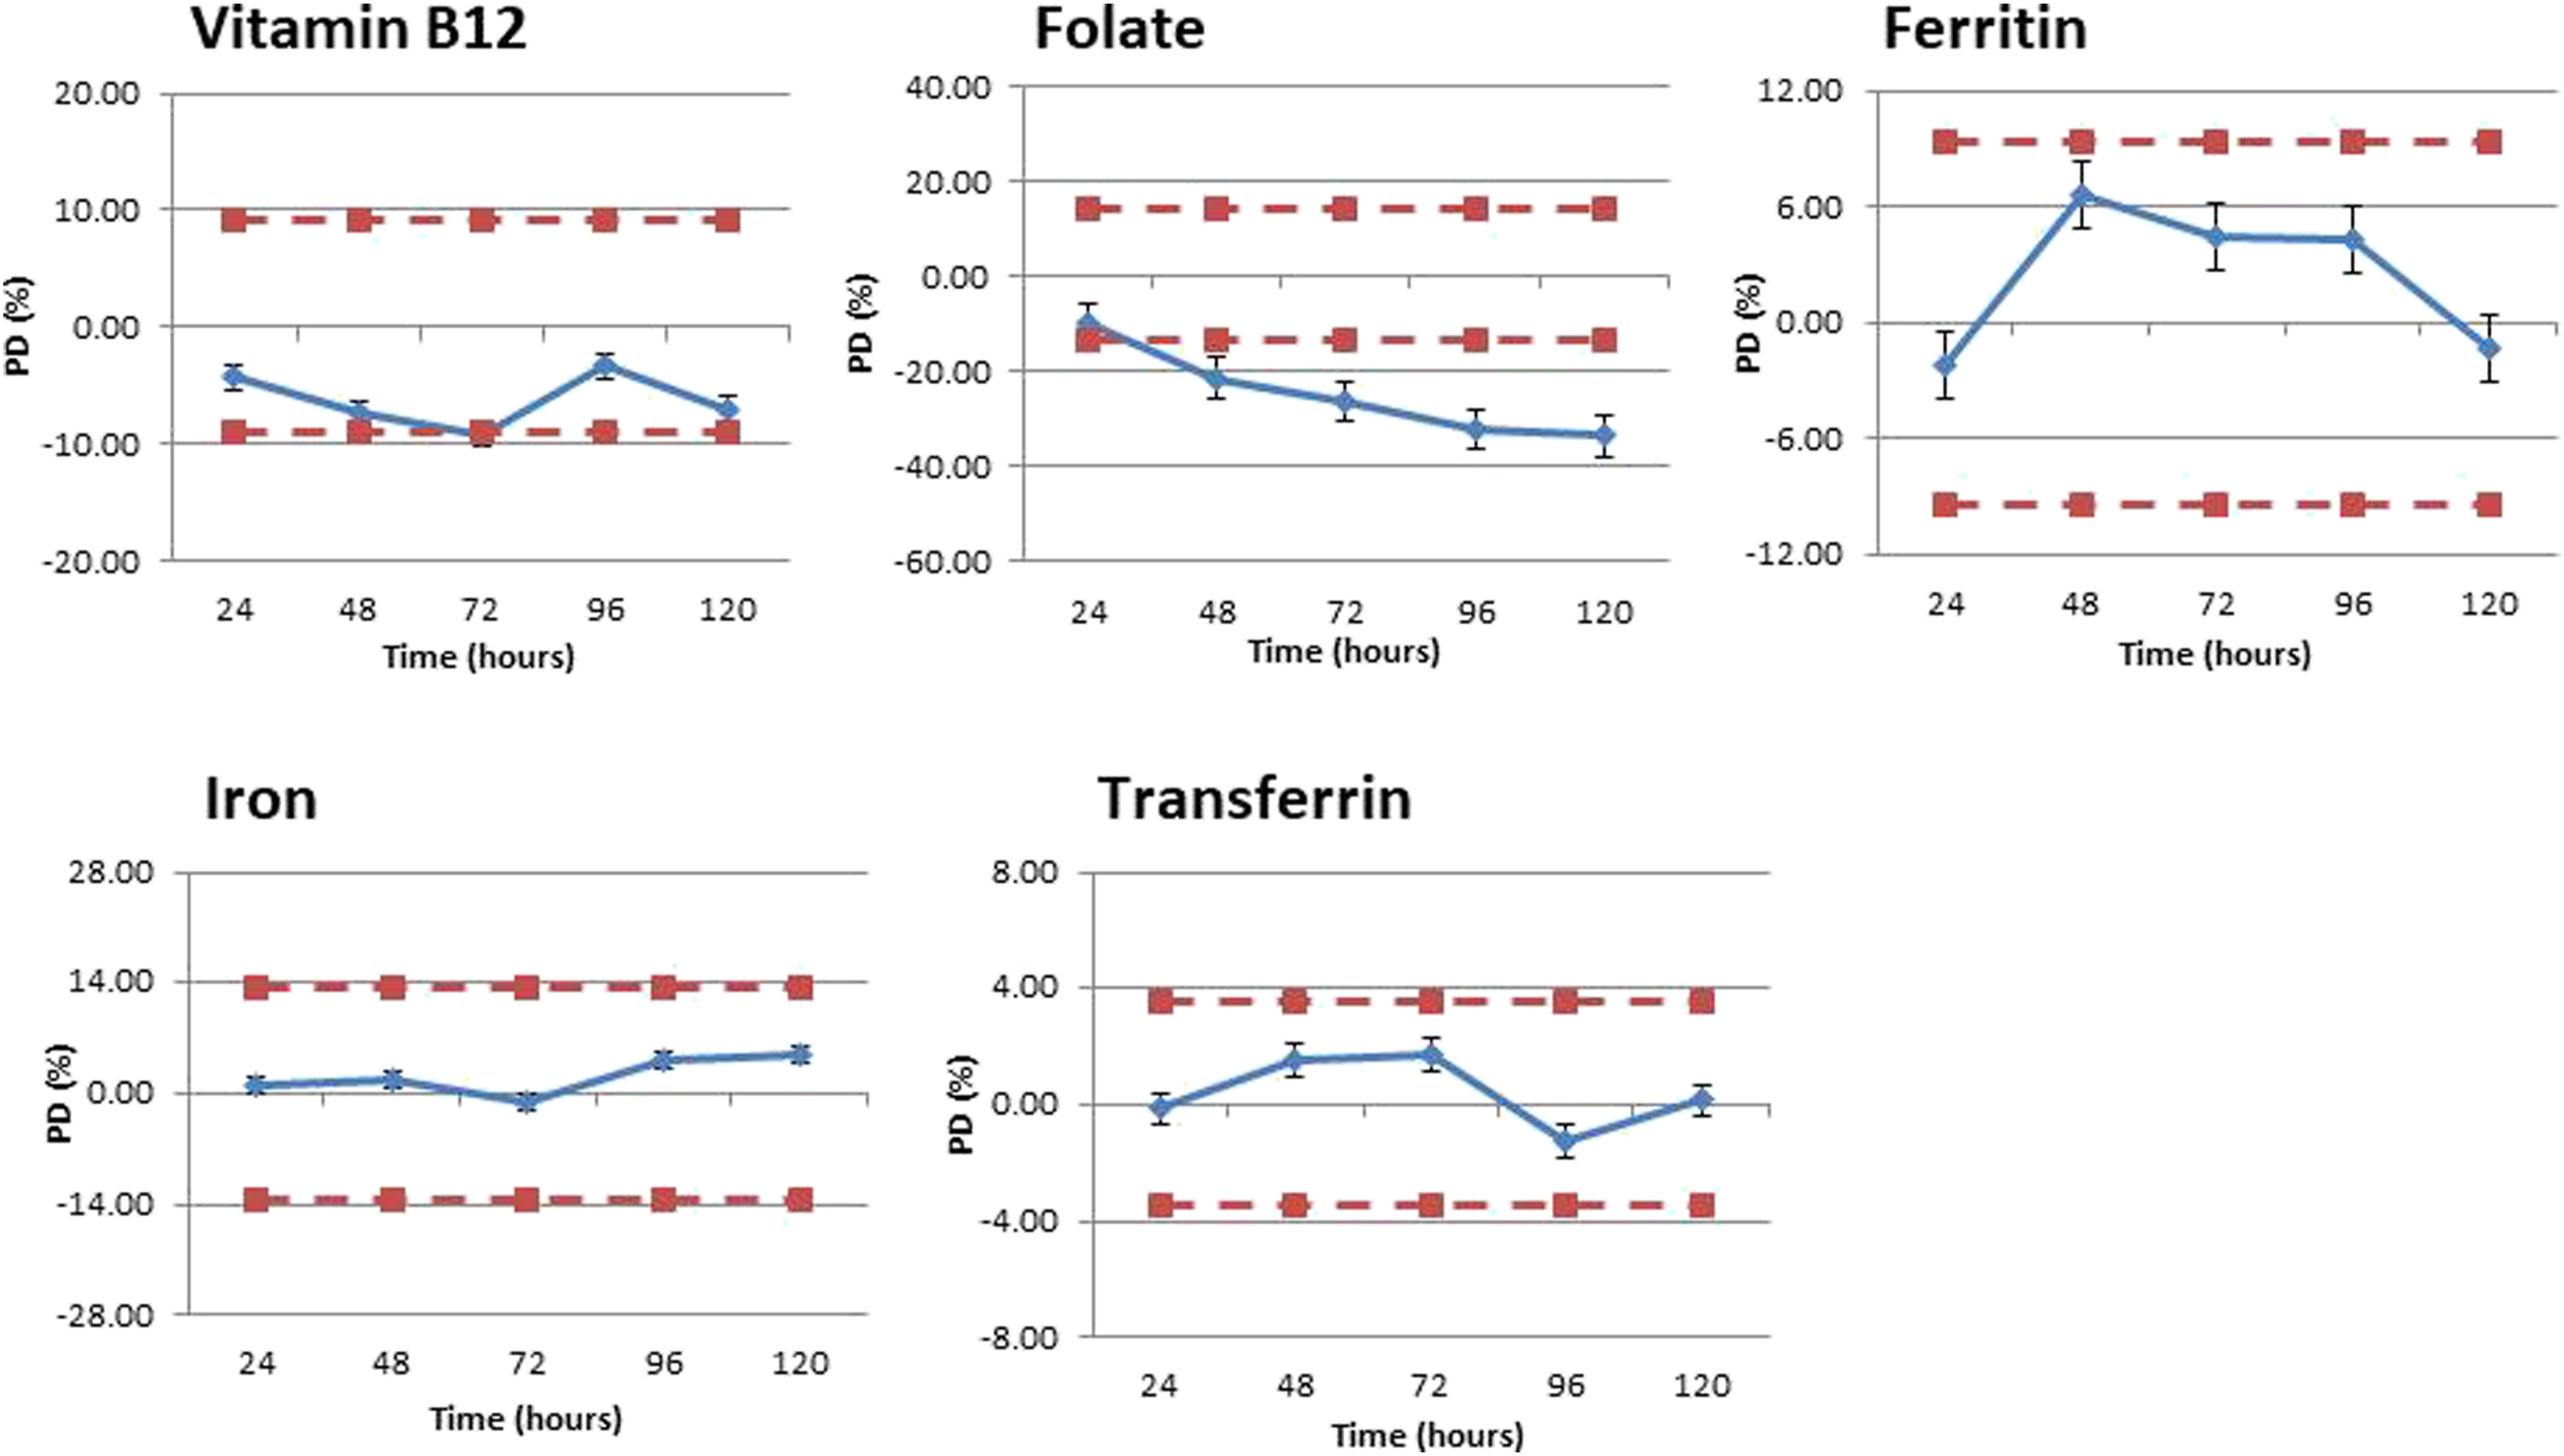

At RT, the stability of iron, ferritin and transferrin did not exceed their calculated MPI throughout all 5 days tested. Vitamin B12 demonstrated an average decrease of -9.22% by day three, exceeding the calculated MPI. However, results for day four and five generated acceptable results. Folate was deemed unstable by day one at RT with a -10.22% decrease from the baseline value, with values continuing to decrease for all 5 days tested.
At 4-8°C iron, ferritin and transferrin did not exceed their calculated MPI. In addition, vitamin B12 further displayed acceptable stability with an average decrease of 4.56% by day five when compared to the baseline. Folate was stable up until day five with an average decrease in -15.14%, thus exceeding the MPI of +/− 13.7%. It was noted, however, that the results from day three and four were also extremely close to the abovementioned cut off (−13.5% and −13.04%, respectively).
At -20°C vitamin B12, folate, iron and ferritin were all stable for all of the 5 days that were tested. Transferrin, however, was only stable for up to 4 days, with an average increase of 4.49% by day five.
Summary of stability data from the haematinics panel when samples were stored at RT, 4-8°C and -20°C.
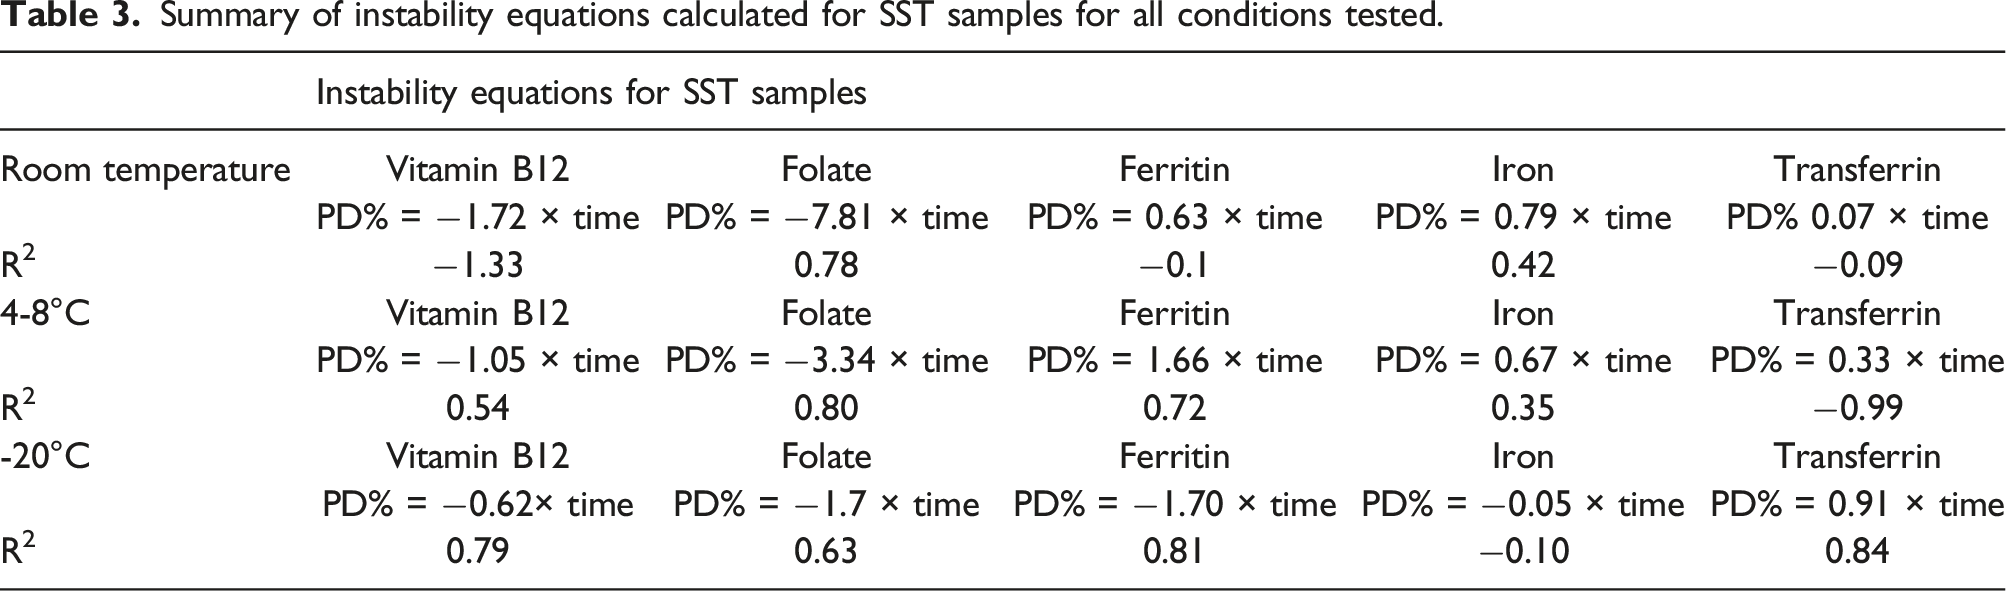
Summary of instability equations calculated for SST samples for all conditions tested.
Discussion
The results demonstrated here are to our knowledge, the first published account of a stability study for a haematinics panel on the Siemens Atellica platform using the checklist from the recently published EFLM guidelines. 14 The analyte stability was deemed acceptable should the results not exceed the calculated MPI, as shown in Tables 1 and 2.
The stability data generated for ferritin in all tube types was acceptable and in-line with published evidence, excluding GF serum at room temperature (+23.2% at day 5).19,20 The reason for this was unclear; however, it was postulated that analytical interference from being left on cells and sample degradation may have been a contributing factor, with previous publications supporting our findings.19,20 Studies have further shown that sample clotting time and centrifugation can play a significant role in analyte stability, including ferritin. However, this should be negligible here with all samples following a well-defined pre-analytical processing pathway.19–21
Iron was found to be stable in all sample types and conditions tested. This is consistent with current procedures and those quoted by the manufacturer. Although there are conflicting reports within the literature, the main body of evidence supports our findings, with iron commonly considered as one of the most stable biochemical analytes measured.10–22 Similar results were observed with transferrin; all sample types were stable for greater than 5 days for both room temperature and 4–8°C; however, this was not reflected in samples stored at -20°C. We were unable to determine a cause for this discrepancy in analyte stability, although it was suggested that the freeze-thaw process may have disrupted the sample’s integrity.
Vitamin B12 and folate are well known to be unstable under conditions including heat & exposure to light, with folate also sensitive to high levels of haemolysis.23,24 This is reflected in the results generated for analyte stability at room temperature. Folate, commonly analysed on a SST, was only stable for up to 1 day, whereas vitamin B12 was stable for 2 days. Both vitamin B12 and folate demonstrated a significant drop in concentration throughout the stability study (-7.02% and -33.64, respectively, at day 5), probably due to sample degradation.19–24 As these tests are routinely ordered as a pair, it would be impractical to have alternative stability ranges for both tests. Stability of both analytes was significantly greater at 4–8°C, mainly due to lower temperatures, although the significantly reduced exposure to light cannot be excluded. There have been reports in the literature of B12 levels increasing, rather than decreasing with time as reported here. This is thought to be due vitamin B12 being slowly released from binding proteins causing an artificial rise in serum concentration.23–25 The stability for both vitamin B12 and folate at -20°C was greater than 5 days for all blood tubes tested. Although not unexpected, this is extremely encouraging should laboratories wish to store samples longer-term. Several studies have also investigated the effects of long-term storage (>6 months) for the analytes discussed here; however, temperatures below -70°C are required in order to maintain appropriate stability and is neither feasible for some laboratories or included in the scope of this study.19–25
Instability equations were calculated for each condition and tube type tested for all analytes in the study, as shown in Table 3. The calculation and reporting of these instability equations, along with graphical information allows users to calculate the expected analyte stability at any given time point. 14 Further to this, it promotes the inter-changeability of information between laboratories should they wish to use published stability data. It is, however, unknown how transferable these equations are for users calculating analyte stability on alternative platforms to that of Siemens.
It is important to note that although stability data is a prerequisite for allowing analyte add-on requests in a pathology lab, factors such as laboratory space, storage facilities, staffing resources and an efficient and streamlined add-on process all need be considered. Automated laboratories with tracked systems may be limited by the refrigerated storage module units which dispose of samples when they are either full or a sample has exceeded its programmed storage time. However, this should not discourage laboratories from having a sound understanding of the pre-analytical factors which may affect the results that they are reporting.
The results generated from this stability study have allowed us to extend the period to which we can store samples and add-on tests from our haematinics panel, which poses benefits not only to the laboratory but also prevents unnecessary re-bleeding of patients. Looking forward, it may be useful to also consider the stability of common analytes for a longer time period than 5 days, include a wider range of biochemical analytes and test pre-analytical factors including light, centrifugation time and temperature. 21 Furthermore, it would be extremely interesting to expand this study to compare results across analytical platforms, especially considering Siemens Atellica platforms can display significantly different results in the haematinics UKNEQAS scheme when compared to other users such as Roche and Abbott.
This study was carried out with the aim that it will highlight the advantages of standardising pre-analytical procedures, especially when performing stability studies. As previously discussed, there are numerous stability publications and databases available; however, the main advantage of this approach ensures the consistent production of high quality data, transparent practices and the publication of reproducible results which is transferable to other laboratories.
Supplemental Material
Supplemental Material - Determination of in vitro stability of routine haematinics tests using EFLM standards and the CRESS checklist
Supplemental Material for Determination of in vitro stability of routine haematinics tests using EFLM standards and the CRESS checklist by Robert D Williams, Christopher J Duff and Alexandra Yates in Annals of Clinical Biochemistry
Footnotes
Acknowledgements
We would like to thank the Biochemistry team and all laboratory staff at UHNM for their help in running all stability samples for this study.
Declaration of conflicting interests
The author(s) declared no potential conflicts of interest with respect to the research, authorship, and/or publication of this article.
Funding
The author(s) received no financial support for the research, authorship, and/or publication of this article.
Ethical approval
This study was defined as a service improvement experiment therefore ethics was not required.
Guarantor
RDW.
Contributorship
RDW, AY, CJD all provided the concept for the research article. RDW wrote all drafts with approval from AY and CJD.
Supplemental material
Supplemental material for this article is available online.
References
Supplementary Material
Please find the following supplemental material available below.
For Open Access articles published under a Creative Commons License, all supplemental material carries the same license as the article it is associated with.
For non-Open Access articles published, all supplemental material carries a non-exclusive license, and permission requests for re-use of supplemental material or any part of supplemental material shall be sent directly to the copyright owner as specified in the copyright notice associated with the article.