
Abstract
Background
Cardiac toxicity resulting in long-term complications are recognised side effect of anthracycline-based chemotherapy used in the treatment of breast cancer. Current management modality involves measurement of left ventricular ejection fraction which has inherent limitations due to its dependence on haemodynamic conditions, and inability to detect subclinical changes in left ventricular systolic function. This study aimed to evaluate changes in the concentration of cardiac biomarkers present in serum as indicators of cardiac toxicity in breast cancer patients undergoing Epirubicin-based chemotherapy.
Methods
Eighty-one breast cancer patients elected to undergo Epirubicin chemotherapy were recruited. Blood samples taken at baseline, mid-cycle and final cycle of chemotherapy were analysed for hs-cTnT, NT-proBNP and sST2. Longitudinal changes in biomarkers were compared to pre-treatment baseline values and between treatment groups.
Results
At mid-cycle, mean cumulative dose of 265 mg/m2 of FEC elicited a 270% change in hs-cTnT but with no significant change in NT-proBNP and sST2. At the final cycle, mean cumulative dose of 340 mg/m2 of FEC elicited a 565% change in hs-cTnT with no significant change in NT-proBNP and sST2. There was progressive increase in hs-cTnT from baseline with increasing cumulative dose of Epirubicin. At mid-cycle, median hs-cTnT was 7.4 ng/L (IQR: 5.6–9.3) vs. baseline of 2.0 ng/L (IQR: 2.0–4.7) p < 0.001. Final cycle median hs-cTnT versus baseline was 13.3 ng/L (IQR: 8.2–22.1) vs. 2.0 ng/L (IQR: 2.0–4.7) p < 0.001.
Conclusion
Serial measurement of hs-cTnT but not NT-proBNP or sST2 during Epirubicin chemotherapy has important value in the early determination cardiomyocytes damage.
Introduction
Breast cancer is the commonest cancer in the UK, and predominantly affects women who have a one in eight lifetime risk of developing the disease. 1 The incidence of breast cancer increases with advancing age and the majority of cases are diagnosed in women over the age of 50 years. 1 Anthracycline compounds, including Epirubicin (EPI), Doxorubicin (DOX) and Daunorubicin (DNR) are frequently used chemotherapeutic agents as adjuvant or neoadjuvant therapy in the treatment of a variety of cancers including breast cancer. 2 Epirubicin is a newer derivative of Doxorubicin and differs in the spatial orientation of the 4ʹ-hydroxyl (OH) group within the carbon backbone of the molecule. Similar to other anthracyclines, Epirubicin exert its anti-tumour effect via DNA intercalation and inhibition of topoisomerase II.3,4 However, structural modification of Epirubicin confers a diminished cardiac and systemic toxicity while still retaining an equivalent anti-tumour spectrum of activity. 5
Long-term CVD complications arising from cancer treatment are now well recognised and are associated with increased morbidity and mortality amongst survisors. 6 CVD complications can become a limiting factor in the delivery of optimum chemotherapy and is a major culprit in premature termination of potentially life-saving treatemnt.6,7 Presently, determination of cardiac dysfunction relies on measurement of left ventricular ejection fraction (LVEF). Left ventricular ejection fraction is highly dependent on haemodynamic conditions and is insensitive at detecting subclinical changes in left ventricular systolic function. 8
Cardiac biomarkers such as high-sensitivity cardiac troponin T (hs-cTnT), N-terminal pro B-type natriuretic peptide (NT-proBNP) and soluble suppression of tumorigenicity-2 (sST2) are released into blood following cardiac damage, including chemo-related necrosis of cardiomyocytes. The 2016 ESC position paper on cancer treatment and cardiovascular mortality recognised the lack of a proven strategy for the recognition of early cardiac toxicity associated with cancer treatment and alluded to the potential of using serum cardiac biomarkers for the detection of cardiac toxicity. 2 Recently, meta-analysis of data from different trial has shown that cancer therapy was associated with an increase in troponin T and NT-proBNP. Furthermore, the highest rate of increase in these biomarkers was seen in the category of patients that were treated with anthracycline. 9 The current ESC position statement published in 2020 reflects this changing landscape in our understanding of the role of cardiac biomarkers and their application in the management of patients undergoing anthracycline chemotherapy. The ESC now advocates for cardiac biomarker surveillance during and after anthracycline therapy. 10 Baseline CVD risk assessment is now recommended to stratify patient into low, medium or high risk category and this in turn informs the interval between measurement of these biomarkers during the course of chemotherapy.10,11
Soluble ST2 (sST2) is a novel marker of cardiovascular stress, 12 and a member of the interleukin-1 receptor family. sST2 acts as a decoy receptor of interleukin-33 (IL-33), and plasma concentration increases in response to cardiac strain. Binding of sST2 to IL-33 intercepts the interaction of IL-33 with the transmembrane ligand isoform of ST2 (ST2L), and thus, attenuates the cardioprotective signalling that arises from the formation of ST2L/IL-33 complex. 13 The loss of ST2L/IL-33 signalling is associated with adverse cardiac remodelling of ventricular myocardium leading to fibrosis, myocyte hypertrophy and loss of left ventricular function.13,14 Increased plasma concentration of sST2 is thus an excellent prognostic indicator of poor adverse outcome in patients with heart failure. There is evidence suggesting that sST2 is superior in long-term prognostication of adverse cardiac outcomes including cardiovascular mortality and HF hospitalisation in chronic heart failure patients compared to NT-proBNP. 15 To date, studies in heart failure prognostication post-cancer therapy involving sST2 measurement have largely been limited to sST2 measurement in the months and years post-treatment when clinical decline in LVEF is evident on echocardiogram.
The objectives of this study were to investigate the potential for serial measurement of cardiac biomarkers in blood for the early detection of cardiac toxicity in Epirubicin-treated breast cancer patients, and to establish if any of the biomarkers individually or combined suggest that patients on Epirubicin might have developed cardiac toxicity as a consequence of chemotherapy. This outcome was defined by finding of significant and progressive elevation in serum levels of hs-cTnT, NT-proBNP and sST2 with increasing cumulative dose of Epirubicin over subsequent cycles of chemotherapy compared to pre-chemo baseline values.
Materials and methods
Patients with a confirmed diagnosis of breast cancer and elected to undergo treatment with Epirubicin-based chemotherapy were identified in consultation with the clinical oncology team at Torbay District General Hospital. Samples taken as part of routine patient care were intercepted in the biochemistry laboratory after initial biochemical tests relevant to the patients’ ongoing care had been completed. There was no further inconvenience or burden on patients beyond blood sampling for their routine clinical care. Samples were stored in the biochemistry laboratory at −20°C for batch analysis of the three biomarkers. Ethical approval for this study was granted by Health Research Authority (HRA) (IRAS ID: 244529), and Torbay and South Devon NHS Foundation Trust department for Research and Development. The study was conducted in accordance with the declaration of Helsinki.
Programme of Epirubicin-based chemotherapy
Study participants underwent Epirubicin-based chemotherapy as adjuvant treatment for breast cancer and received one of the following therapeutic regimens:
FEC75: 5-fluorouracil, Epirubicin and cyclophosphamide in the following dosages; 5-fluorouracil 500 mg/m2, Epirubicin 75 mg/m2 and cyclophosphamide 500 mg/m2. This was administered at every cycle for six cycles.
FEC100: 5-fluorouracil, Epirubicin and cyclophosphamide in the following dosages; 5-fluorouracil 500 mg/m2, Epirubicin 100 mg/m2 and cyclophosphamide 500 mg/m2. Patients on this regimen were administered FEC100 for cycles 1–3 followed by docetaxel for cycles 4–6.
Inclusion and exclusion criteria
Patients’ recruited into the study met the following predefined criteria: patients aged greater than 16 years, histologically confirmed breast cancer diagnosis, no previous anthracycline drug treatments, no previous planned radiation treatment involving the myocardium, and estimated glomerular filtration rate (eGFR) > 30 mL/min/1.73 m2.
Blood sampling
Blood samples were taken from included subjects during clinic visits as part of their routine clinical care. Samples included in the study were pre-chemotherapy samples taken at baseline prior to commencement of chemotherapy, and two further samples: one taken at midpoint (usually at the start of the third chemo cycle) and a final sample taken toward the end of the cycles (usually during cycles five or six of treatment). Blood samples were collected into 5 mL Greiner Bio-One gel separation tubes (with micronized glass clotting accelerator) by qualified phlebotomists. Labelled samples were sent to the clinical biochemistry laboratory with request forms at room temperature. Samples were centrifuged within 2 h of collection in the laboratory at 1500G for 6 min in accordance with manufacturer’s instructions. Supernatant serum was analysed in the laboratory for biochemical tests relevant to the patients’ routine clinical oncology care. Aliquots of spare serum were then collected into separate test tubes and anonymised before storage at −20oC for batch analysis. The three markers in this study have been validated for use in serum by the manufacturer and hs-cTnT, sST2 and NT-proBNP are stable in freeze storage at −20oC for 12, 18 and 24 months, respectively, as per the manufacturer’s instruction. All samples in this study were analysed within the first 12 months of storage.
Sample analysis
Frozen aliquots were allowed to thaw at room temperature. Samples were vortexed for 5 seconds and inverted 3–5 times before analysis. High-sensitivity troponin T and NT-proBNP were measured using a commercial electrochemiluminescence immunoassay (ECLIA) (Roche Diagnostics Burgess Hill, UK). Serum creatinine measured as part of the participants’ ongoing care and corresponding eGFR values were obtained from LIMS. Performance characteristics of the respective assays were as follows. The hs-cTnT assay had a measuring range 3–10,000 ng/L. The limit of blank (LOB) was 2.5 ng/L, limit of detection (LOD) 3 ng/L and patient results with results ≤ the LOD were assigned a value two third of the LOD. The 99th percentile with a reproducibility CV of ≤10% was 14 ng/L. The imprecision of the hs-cTnT assay at two concentrations tested by the manufacturer were 2.3% and 3.5%, respectively, for repeatability and intermediate precision at 28.3 ng/L, and 1.9% and 2.9%, respectively, at 2136 ng/L.
The NT-proBNP assay had a linear range of 5–35,000 ng/L, an LOB of 3 ng/L, LOD of 5 ng/L and LOQ of 50 ng/L. Imprecision of the NT-proBNP assay at two concentrations levels were 1.5% and 2.9%, respectively, for repeatability and intermediate precision at 140 ng/L, and 1.8% and 2.9%, respectively, at 4846 ng/L. Creatinine was measured by an enzymatic assay (Roche Diagnostics Burgess Hill, UK) and had a linear range of 5–2700 μmol/L with an LOD of 5 μmol/L. Imprecision of the creatinine assay at two concentrations levels were 0.8% and 1.4%, respectively, for repeatability and intermediate precision at 86.2 μmol/L, and 0.6% and 1.1%, respectively, at 353 μmol/L. Estimated glomerular filtration rate was determined by CKD-EPI equation: GFR = 141 * min (Scr/κ,1)α × max (Scr/κ, 1) −1.209 × 0.993Age × 1.018 [if female] × 1.159 [if black]. 16 The criteria by which patients were excluded from the study were as follows: patients less than 16 years of age, previous anthracycline drug treatments, previous planned radiation treatment involving the myocardium and estimated glomerular filtration rate (eGFR) < 30 mL/min/1.73 m2.
Soluble ST2 was measured by an automated ELISA using Dynex DS2 automated ELISA system (Dynex Technologies, Inc. Chantilly, VA, USA) using a Presage® ST2 assay kit obtained from Critical Diagnostics (Critical Diagnostics San Diego, CA). The sST2 assay was a quantitative sandwich monoclonal ELISA in a 96-well microtiter plate that measures sST2 in serum or plasma. In the assay method, a commercial 96-well microtiter plate pre-coated with anti-sST2 antibodies was used as the capture/solid phase to which sST2 the calibrators, controls and patient samples are bound. A commercial standard sST2 reagent was used as calibrator to obtain a standard curve. Standards, low, and high quality controls (QC) materials, and patient samples were analysed in duplicate. A standard curve was generated by carrying out doubling dilutions of a commercial standard material with an sST2 concentration of 400 ng/mL. The concentrations of sST2 in the QC and samples were determined by measuring the respective optical densities at 450 nm. Analyte concentrations corresponding to the absorbance values were deduced from the standard curve automatically by the assay protocol software. The analyser software determined the average standard deviation (SD) and coefficient of variation (CV) for each set of duplicates of standards, QC and participant samples. The assay was accepted if %CV for a set of duplicate measurement was less than 10% and QC within predefined ranges.
A suitable calibration was obtained with a linear fit (R2 = 0.998; y = 0.045 + 0.013) that met the acceptance criteria for a valid sST2 assay as follows: Standard 1 (S1) optical density (OD) = 0.052; (acceptance criteria ≤0.07); S2 OD = 0.089 (acceptance criteria >S1); S8 OD = 2.693 (acceptance criteria >2.0). All subsequent calibrations met the desired calibration parameters for a valid and acceptable assay. S1= blank calibrator; S2 = lowest concentration calibrator; S8 = highest calibrator. The LOB determined as the highest concentration of sST2 obtained from 10 replicate measurements of the sample diluent was 0.67 ng/mL. The intra-assay and inter-assay imprecision was determined from two separate patient serum pools. Pool one had a high concentration of sST2 and pool two had sST2 concentration near the clinical cut-off value. Imprecision data showed a repeatability CV of 1.4% and 1.8% for the low and high serum pools, respectively, and intermediate precision were 4.9% and 3.8%, respectively, for the low and high concentration serum pools.
Statistical analysis
Data analysis was conducted using the statistical software package SPSS (version 25.0) for windows® (SPSS Inc., Chicago IL, USA), and graphical illustration was performed using Excel (Microsoft Corp., Redmond, USA). Normality of data was assessed by the Shapiro–Wilk test for normality. Non-normally distributed data are presented as median and interquartile range. Descriptive statistics was conducted on all data including participants’ age. Changes in cardiac biomarkers (hs-cTnT, NT-proBNP and sST2) at the different time points studied compared to baseline values was determined for each cardiac biomarker separately using Wilcoxon signed rank test for the combined participants data. A Mann–Whitney U test was used to analyse differences between the two treatment groups. A p-values ≤ 0.05 was considered statistically significant.
Results
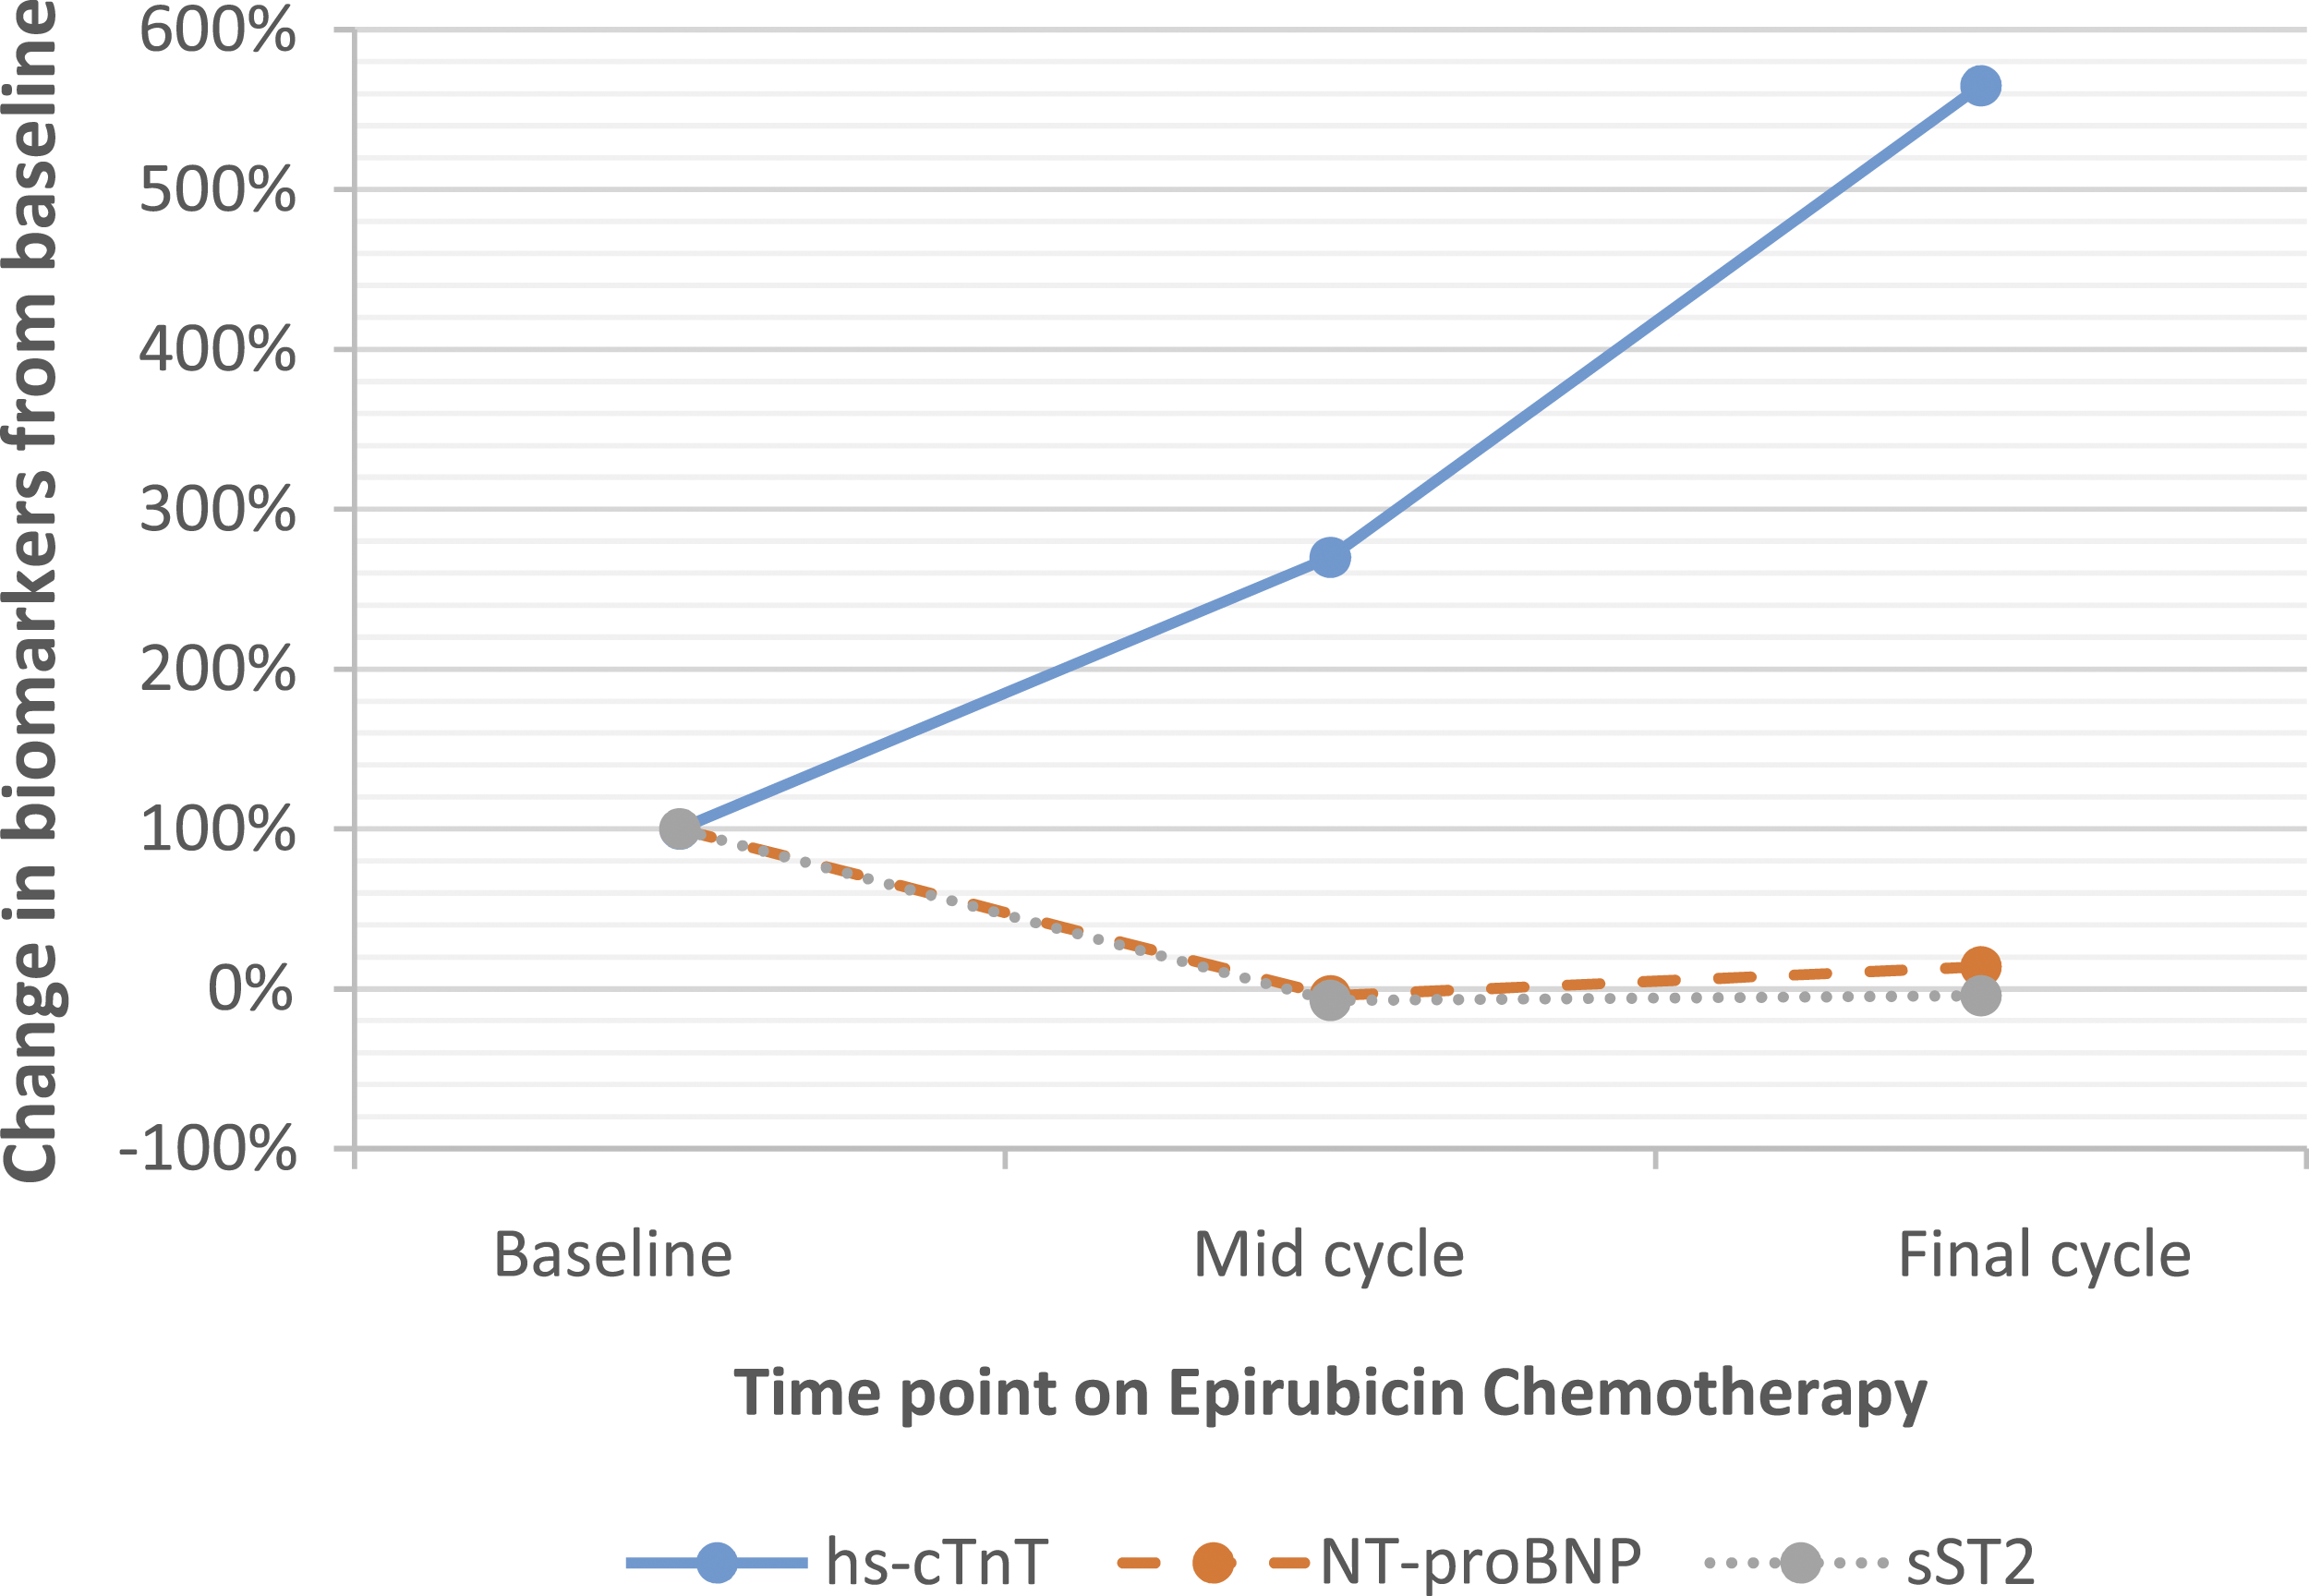
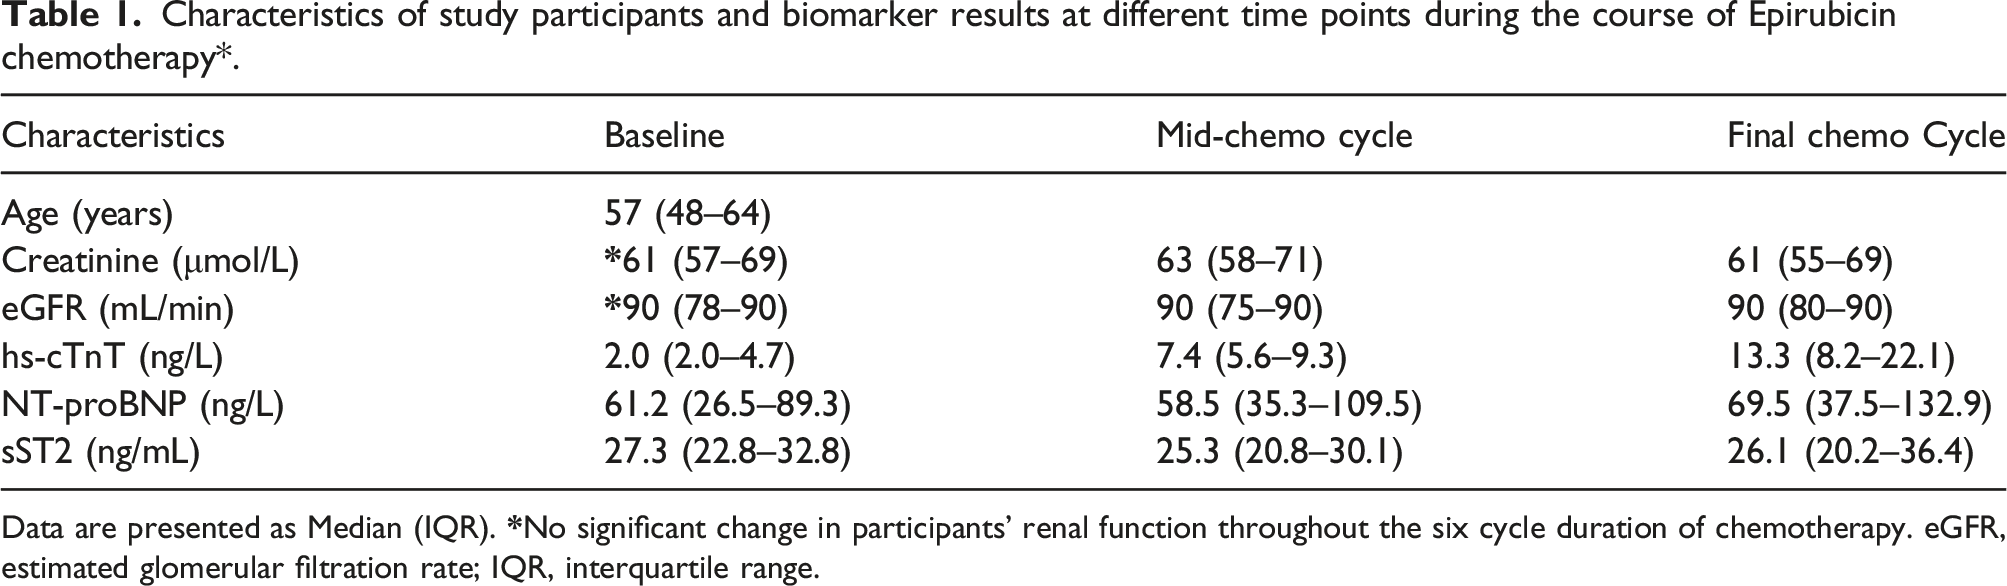
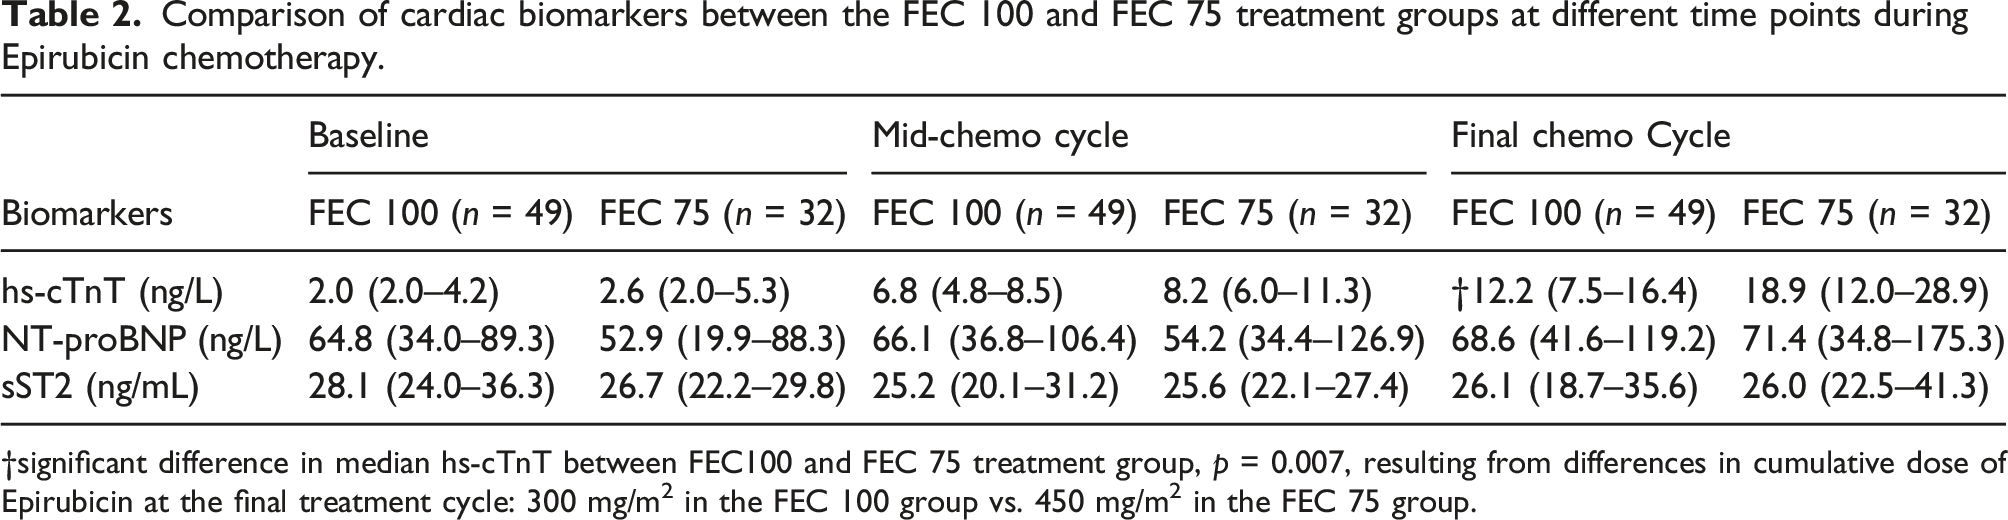
Ninety female patients with a histological diagnosis of breast cancer met the selection criteria and were prospectively enrolled into the study. One patient was excluded due to prior anthracycline treatment abroad before arriving in the UK, and eight patients had incomplete sample collection and were excluded. A total of 81 patients had samples taken at each of the sampling time points and participated in the study. Participants in this study were assigned to different treatment regimen as determined by the oncology team. Thus, 40% (32/81) of participants underwent the FEC 75 regimen for six treatment cycles and 60% (49/81) were assigned the FEC 100 regimen which involved three cycles of FEC 100 (cycles 1–3), followed by three cycles in docetaxel (cycles 4–6). Data from the study was analysed both as combined group (Figures 1 and 2 and Table 1) and as two separate groups to allow group comparison (Table 2). The age of participants included in the study ranged from 20 years to 76 years. Median age was 57 years (IQR: 48–64). Renal function of participants was monitored with creatinine and estimated glomerular filtration rate (eGFR) throughout the study duration. Median creatinine at baseline, mid-cycle and at the final cycle of treatment were 61 μmol/L (IQR: 57–69), 63 μmol/L (IQR: 58–71) and 61 μmol/L (IQR: 55–69), respectively (Table 1). There was no significant difference between the baseline creatinine and the two time points, respectively; p = 0.117 and p = 0.535. Similarly, there was no change in eGFR during the study duration compared to baseline p = 0.114 and p = 0.926, respectively. The lowest eGFR recorded during the course of the study was 45 mL/min/1.73 m2 with the majority of participants having an eGFR of >90 mL/min/1.73 m2. Box and whisker plot of hs-cTnT, NT-proBNP and sST2 for all participants at various time points. Percentage change in biomarkers from pre-chemo baseline values for all participants combined. hs-cTnT: high-sensitivity cardiac troponin T; NT-proBNP: N-terminal pro b-type natriuretic peptide; sST2: soluble suppression of tumorigenicity-2. Baseline = pre-chemo biomarker levels; mid-cycle = cycle 3/4; final cycle = cyle5/6. Characteristics of study participants and biomarker results at different time points during the course of Epirubicin chemotherapy*. Data are presented as Median (IQR). Comparison of cardiac biomarkers between the FEC 100 and FEC 75 treatment groups at different time points during Epirubicin chemotherapy. †significant difference in median hs-cTnT between FEC100 and FEC 75 treatment group, p = 0.007, resulting from differences in cumulative dose of Epirubicin at the final treatment cycle: 300 mg/m2 in the FEC 100 group vs. 450 mg/m2 in the FEC 75 group.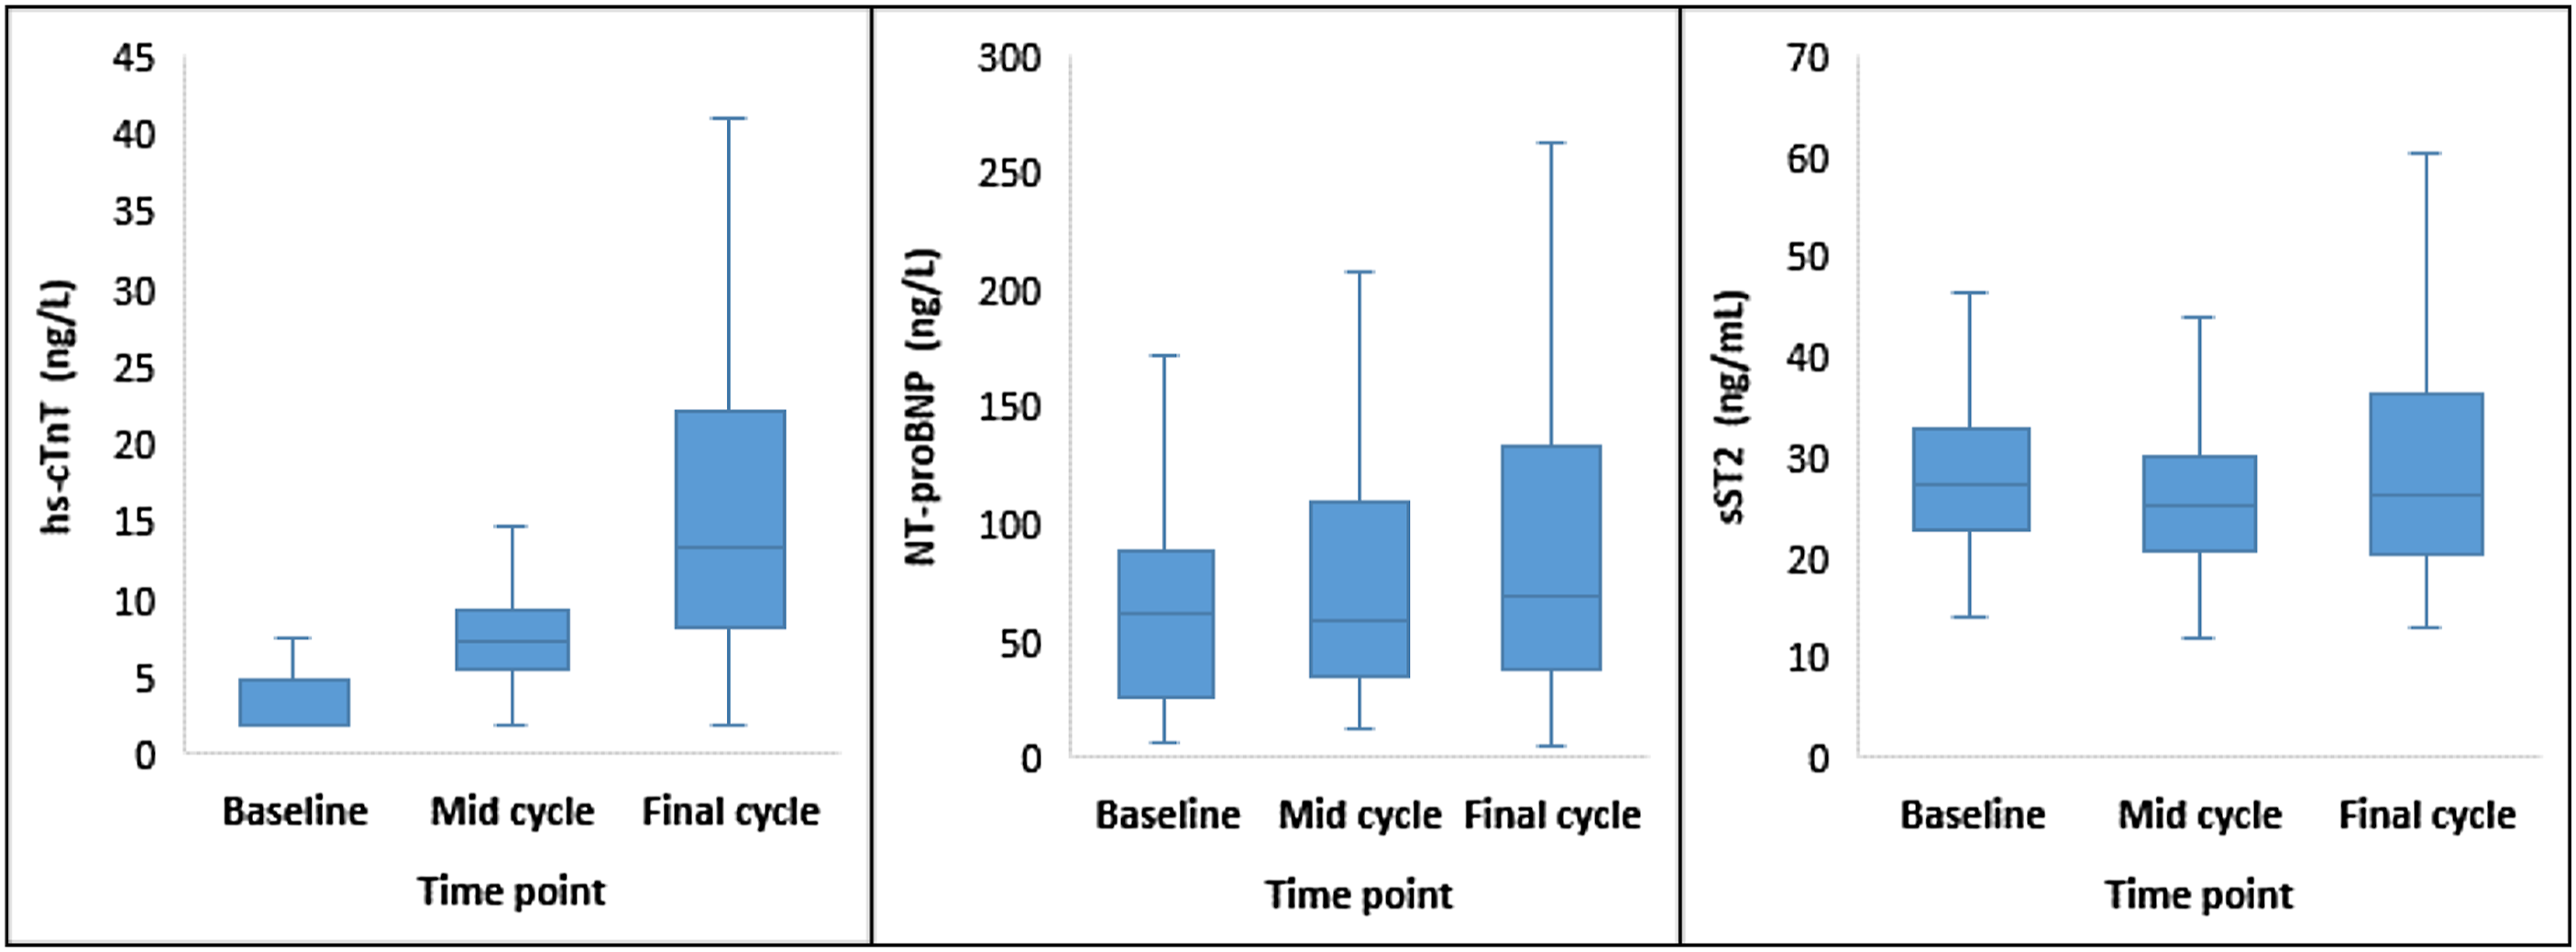
Longitudinal changes in biomarkers in all participants
Change in cardiac Troponin T from baseline
The lower limit of detection of hs-cTnT was 3.0 ng/L, and troponin T results below the detection limit were assigned a value of 2.0 ng/L equal to two third the LOD to enable calculation non-parametric statistics. At baseline, the proportion of participants with hs-cTnT result below the detection limit was 46/81 (56.8%); 33/81 (40.7%) had hs-cTnT values above the detection limit but below the 99th percentile cut-off value of 14 ng/L. Two patients (2.5%) had baseline troponin values greater than the 99th percentile cut-off value. There was successive increase in the proportion of patients with positive hs-cTnT results with increasing cycles of Epirubicin. At mid-cycle, 7/81 (8.6%) had undetectable hs-cTnT values, 66/81 (81.5%) had results greater that the detection limit but below the 99th percentile cut-off value, and 8/81 (9.9%) of patients had results greater than the 99th percentile cut-off value. At the final cycle, the proportion of patients with troponin T results below the detection limit and 99th percentile respectively were 2.5% and 49.4%. 39/81 (48.1%) of patients had troponin T values greater than the 99th percentile cut-off value. Median hs-cTnT increased significantly with increasing cycles of chemotherapy compared to baseline. At mid-cycle, median hs-cTnT was 7.4 ng/L (IQR: 5.6–9.3) compared to median baseline hs-cTnT of 2.0 ng/L (IQR: 2.0–4.7) p < 0.001. This represented a 270% increase in median hs-cTnT at mid-cycle (Figure 2). Similarly, by the final cycle, median hs-cTnT versus baseline was 13.3 ng/L (IQR: 8.2–22.1) vs. 2.0 ng/L (IQR: 2.0–4.7) p < 0.001. This equated to a rise in median hs-cTnT of 565% from pre-chemo level (Figure 2). The magnitude of the observed change from baseline was a greater by cycle six compared to cycle three, and suggests that any associated cardiac damage continued with increasing cumulative dose of Epirubicin.
Change in NT-proBNP from baseline
The values of NT-proBNP observed in this patient cohort were generally low and not in the range normally associated with acute heart failure (Table 1). The changes in NT-proBNP at baseline and the other two time points was compared to published data on intraindividual biological variation seen in stable heart failure patients. NT-proBNP showed a paradoxical fall −4.4% by cycle three. By cycle six, the level rose by 13.6% (Figure 2). The biggest increase was observed between the mid-cycle and final cycle with an increase of 19%. These changes were not clinically significant compared to approximately 50% change required to suggest an altered clinical status. 15
Change in sST2 from baseline
Soluble ST2 measurement has been used previously in the setting acute decompensated heart failure (ADHF) where it serves as a useful and independent prognosticator and predictor of mortality. Inclusion of sST2 measurement in the biomarker panel in this study was considered to investigate a possible role in the early detection of cardiac damage prior to development of fulminant hear failure. Published consensus cut-off value for the Presage sST2 assay used in this study is an sST2 value ≥35 ng/mL. Median sST2 in this study at the various time points studied were 27.3 ng/mL, 25.3 ng/mL and 26.1 ng/mL, respectively, for baseline, mid-cycle and final cycle sST2 levels.
Comparison of the FEC100 and FEC75 treatment groups
A Mann–Whitney U test showed that there were no significant difference in measured biomarkers at baseline: median hs-cTnT in the FEC 100 treatment group was 2.0 ng/L (IQR: 2.0–4.2), n = 46 compared to the FEC 75 group with a median of 2.6 ng/L (IQR: 2.0–5.3), n = 32, U = 645, z = −1.49, p = 0.137, and a small effect size r = 0.17. NT-proBNP level at baseline in the FEC 100 treatment group was 64.8 ng/L (IQR: 34.0–89.3), compared to FEC 75 group with a median of 52.98 ng/L (IQR: 19.9–88.3), U = 647, z = −1.32, p = 0.186, and a small effect size r = 0.15. sST2 level at baseline in the FEC 100 treatment group was 28.1 ng/mL (IQR: 24.0–36.3), compared to FEC 75 group with a median of 26.7 ng/mL (IQR: 22.2–29.8), U = 608, z = −1.70, p = 0.089, and a small effect size r = 0.19. This showed that there was no significant difference is levels of the three biomarkers at the start of chemotherapy. As a result, it was possible to compare the levels of the biomarkers at mid- and final cycles, respectively, to determine the relative effect of differences in cumulative dose of Epirubicin. As shown in Table 2, at mid-cycle, the hs-cTnT, NT-proBNP and sST2 did not differ between the treatment groups. At this stage in the treatment cycles the cumulative dose of Epirubicin was 300 mg/m2 in the FEC 100 treatment group and 225 mg/m2 in the FEC 75 treatment group. At the final treatment cycle, cumulative dose of Epirubicin in FEC 100 treatment group was unchanged with a switch to docetaxel for the last three cycles. In the FEC, 75 group cumulative dose of Epirubicin peaked at 450 mg/m2. Despite the differences in final cumulative doses there was no significant difference in the levels of NT-proBNP and sST2 between the two groups. However, hs-cTnT was significantly upregulated in the FEC seven group with significant difference in hs-cTnT between the two treatment groups 12.2 ng/L (IQR: 7.5–16.4) vs.18.9 ng/L (IQR:12.0–28.9) U = 504, z = −2.71, p = 0.007, and a moderate effect size r = 0.30 (Table 2).
Discussion
Cardiac toxicity associated with anthracycline-based chemotherapy is now a well-recognised complication of cancer treatment that can sometimes become a limiting factor in the delivery of optimum chemotherapy. The role of cardiac biomarkers and their application in the early recognition of cardiac toxicity have also come into focus. The European Society of Cardiology (ESC) recently published position paper on the role of serum cardiac biomarkers measurement in cancer patients receiving cardiotoxic cancer therapies provides recommendations on the incorporation of serum biomarkers measurement into the decision-making process for oncologists and cardiologists caring for these patients. The ESC however also recognised the lack of objective evidence to support the timing and/or interval of cardiac biomarkers measurements, but recommend baseline measurement to enable baseline risk stratification of patients, and identification of potential haemodynamic stress and pre-existing subclinical cardiomyocyte injury prior to the start of chemothoreapy. 10
The purpose of this study was to determine if any of the three biomarkers studied are upregulated during chemotherapy. The timing strategy was an attempt to target the time during chemotherapy at which measured cardiac biomarkers begin to rise from baseline levels and follows observation from previously published data in which cardiac troponin I was measured serially with each successive cycle of anthracycline chemotherapy. 17 In our current study, several important biochemical observations were made: there was an increase in hs-cTnT from baseline with continued increase with increasing cycles and cumulative dose of Epirubicin while NT-proBNP and sST2 levels did not change significantly from pre-treatment levels. Median NT-proBNP and sST2 at mid-cycle and final cycle respectively showed no statistical difference from baseline (Figure 1 and Table 1). This was more evident on the longitudinal data which showed a paradoxical drop in the percentage change in NT-proBNP and sST2, respectively, at mid-cycle compared to pre-treatment levels (Figure 2). It is possible that the reduced cumulative dose of FEC in the FEC 100 group by the final cycle may have been a factor in the observed blunted response of NT-proBNP and sST2 compared to hs-cTnT. However, the cumulative anthracycline dose in the FEC 100 group at mid-cycle was 300 mg/m2 compared to 225 mg/m2 in the FEC 75 treatment group. Therefore, a mean cumulative dose of 263 mg/m2 by mid-cycle elicited a 270% increase from baseline in hs-cTnT but with no apparent rise in NT-proBNP and sST2 levels.
Variation in the response of the various cardiac markers may be related to the underlying pathological mechanism responsible for the release of the respective biomarkers. The anticancer mechanism of anthracycline is the same mechanism by which its cardiac toxicity is elicited. Although the exact mechanism of anthracycline-induced cardiac damage remains to be fully elucidated, common hypothesis relate to (i) generation of free radical within cardiac myocytes, (ii) poisoning of the topoisomerase II nuclear enzyme 18 and (iii) complex formation with cardiolipin. Cardiac tissue is rich in mitochondria, being a metabolically active tissue. Anthracycline are capable of changing the transcriptome and interfering with mitochondrial biogenesis in cardiac tissues. Anthracyclines, particularly Doxorubicin are prone to reversible reduction to a semiquinone – an unstable metabolite that mediates the generation of reactive oxygen species within the mitochondria. 19 The free radicals generated by this process causes peroxidation of the cardiac sarcoplasmic reticulum that leads to calcium–dependent cardiac necrosis. Anthracycline also disrupts the normal catalytic cycle of topoisomerase-2β (Top2β) via intercalation of Top2β, and inhibition of the DNA–topoisomerase II complex that ultimately leads to DNA double-strand breaks. 20 Cardiolipins play an important role in the electron transport chain in regulating proper functioning of electron transport chain proteins. 21 Anthracycline form irreversible bonds with cardiolipin with high affinity and accumulates in the mitochondria via this mechanism where it initiates subcellular damage to the mitochondria in cardiomyocytes. Combination of above mechanisms renders cardiac myocytes becoming susceptible to myofibrillar disorganisation and vacuolisation that precede the onset of functional cardiac damage.
Cardiac troponin T is released from cardiac tissue following chemo-induced necrolysis of cardiomyocytes. The exact mechanism underpinning this process is yet to be fully elucidated, one theory however involves the human epidermal growth factor receptor (HER); a regulator of cell survival and molecular target for the humanised monoclonal antibody transtuzumab, used as adjuvant therapy in the treatment of HER-2 positive breast cancer. HER-2 plays a role in cardiomyocyte survival by forming dimers with HER-4. Dimerisation of HER-2 is influenced by neuregulin-1 and leads to activation of intracellular signalling pathways that results in stabilisation of myofribrillar network within the myocytes, attenuation of ROS generation, and ultimately, inhibition of apoptosis. 22 The anticancer mechanism of action of anthracycline which promotes the generation of ROS is antagonistic to this signalling pathway. Anthracycline-mediated increase in oxidative stress inhibits neurogenin-1 and this in turn inhibits dimerisation of HER-2. This mechanism is believed to promote apoptosis of cardiomyocytes with the release of cardiac troponin T in a fashion that is independent of myocardial ischaemia. 22
NT-proBNP levels rise in response to mechanical distention of the myocardium. This phenomenon occurs as a late complication of anthracycline-mediated cardiac damage and may explain why clinically significant increase in NT-proBNP only becomes evident in the years post chemotherapy with more advanced disease. This time-dependent mechanism of NT-proBNP release has important implication on the timing of sample collection. A recent meta-analysis comprising 61 trials and 5691 adult patients showed that cancer therapy was associated with an increase in troponin T and NT-proBNP level [odds ratio (OR) 14.3, 95% confidence interval (CI) 6.0–34.1; n = 3049] and (OR 9.4, 95% CI 2.9–30.4; n = 628), respectively, when post-treatment biomarker levels were compared to pre-treatment levels. 9 It is worth mentioning that a common discriminator between the various studies to date is the time post chemo at which blood samples were collected for biomarker measurements. This has contributed to the plethora of varied conclusions that have been made in relation to the diagnostic performance of the various biomarkers so far studied, and have hindered their introduction into routine clinical use. Our current study involved prospective measurement of these biomarker during the dosing stages of Epirubicin chemotherapy as was the focus of this study. This may be a limitation as well as a contributing factor to the levels of NT-proBNP seen in our study cohort. A post-treatment follow-up measurement of these biomarkers would be recommended. The ESC position paper has so far only provided guidance on baseline sampling of patients for risk stratification but provides no explicit recommendation on an optimum sampling time for the detection of cardiac toxicity following the initiation of cardiotoxic treatment. An earlier study by Cardinale et al. highlighted the predictive power of cardiac troponin in the stratification of cardiac risk early in the course of treatment before manifestation of clinical symptoms. However, a major limitation of that study was it dependent on daily serial blood sampling immediately post chemotherapy for up to 3 days to enable the detection of peak troponin level. 23 This approach is not practicable in routine clinical care due to the added burden of phlebotomy on these patients.
The National Institute for Health and Care Excellence (NICE) CG 187 recommend the measurement of serum NT-proBNP for the diagnosis of acute heart failure with levels of less than 300 ng/L as a rule-out target. 24 Our study determined that NT-proBNP was not a suitable marker for the early detection of Epirubicin-induced cardiotoxicity. Our longitudinal data showed that NT-proBNP was not elevated during treatment. From baseline sample collection and commencement of chemotherapy until completion of cycle six of treatment was a period of approximately five to six month on an average of three weekly cycle regimen. It is highly likely that a failure to demonstrate clinically significant increase in NT-proBNP was the direct result of the short duration of sampling in our study. The role of NT-proBNP measurement in this patient group as a diagnostic marker may remain limited to long-term follow-up prognostication in the years post chemotherapy. Similarly, other investigation of NT-proBNP as a possible marker to predict early cardiotoxicity in anthracycline-treated breast cancer patients have had similar conclusions. In one study, NT-proBNP was measured serially at 3 monthly interval for up to 12 months, and in combination with myocardial strain imaging; and NT-proBNP and other risk factors including age, smoking status, diabetes mellitus and hypertension were found non-predictors of cardiotoxicity. 25
ST2 exist in different forms that are determined by variable mRNA processing of the gene product. This results in a membrane-anchored form (ST2L) and a soluble fraction (sST2) that is free in plasma. In its natural function, ST2L on cardiac myocytes bind to IL-33 to form an IL-33/ST2L complex that initiates a protective repair mechanism via downstream signalling in damaged cardiac myocytes. sST2 on the other hand binds to IL-33 in the absence of cellular lesion as a control mechanism to regulate the formation of the IL-33/ST2L complex. In this regards, sST2 function as a ‘decoy’ receptor that brings about attenuation of the systemic effect of IL-33. Soluble ST2 has been studied in the context of heart failure prognostication and has been found to be a more sensitive predictor of congestive heart failure. This superiority in heart failure diagnosis may be related to the relatively stable and lower within-subject variation of 13.8%, compared to that of NT-proBNP of 39.0%. 26 However, multiple factors limit the incorporation of sST2 into routine clinical practice: (1) clinically significant elevation in sST2 are only detectable once heart failure is established, limiting its use in the early detection of cardiac dysfunction, (2) there is a lack of consensus cut-off value for the diagnosis of heart failure, (3) there is yet no available effective intervention paradigm established for the management of patients with elevated sST2 and (4) there is a lack of standardisation of assay with significant heterogeneity in results obtained using different assay formats. The Presage® ST2 assay kit used in the current study however is believed to offer better reproducibility by eliminating the differences in operational flow of reagents that can sometimes be observed in ELISA and other immunoassay-based methods. 27 The Presage® ST2 assay also quote a cut-off of 35 ng/mL and this level is widely referenced in the literature. 28 A recent meta-analysis was comprised of 14 different studies which employed six different assay formats and varied cut-off values for sST2 ranging from 0.53 ng/mL to 700 ng/mL in acute heart failure diagnosis. There was further variation between studies utilising similar assay kit from the same manufacturer, further complicating the problem associated with a lack ofstandasisation. 29
Our present study demonstrated that sST2 was not elevated from baseline levels with mid-cycle and final cycle values being marginally lower compared to baseline levels. Furthermore, median sST2 observed in this patient cohort were consistently below the prognostic cut-off value of 35 ng/mL and significantly below the clinical diagnostic threshold 50 ng/mL throughout the duration of Epirubicin therapy. Interestingly, there was a paradoxical small but significant decrease in sST2 at mid-cycle. This was in direct contradiction to the work of Freres et al. which suggested that sST2 expression was upregulated during chemotherapy. 12 A recent study 30 reported significant correlation between sST2 and LVEF. However, levels of sST2 observed were significantly below the diagnostic threshold quoted in the literature. Furthermore, the observed changes in sST2 from baseline after radiotherapy and at the 3 year follow-up reported by Kieler et al. 30 were 1.7% and 4.5%, respectively. This subtle changes can be accounted for by the natural biological variability in sST2 25 and this must be born in mind when interpreting changes in sST2 levels from serial measurements. Although the level of sST2 seen in our study during Epirubicin treatment were consistently below clinically meaningful threshold, plasma concentration of sST2 levels in cancer patients post anthracycline treatment remain important determinant of survival outcome. 31 The diagnostic potential of sST2 and application in risk stratifying patients undergoing adjuvant or neoadjuvant anthracycline chemotherapy may change in the future with the development of ultra-sensitive assays and standardisation against a reference measurement system.
In conclusion, long-term cardiovascular complications associated with life-saving Epirubucin-based chemotherapy may be unavoidable. High-sensitivity cardiac troponin T, but not NT-proBNP nor sST2, lends itself as a suitable biomarker that can be measured in serum prospectively in the course of treatment for the detection of early subclinical changes in cardiomyocyte. This will allow cardioprotective measures to be instituted before irreversible damage sets in. There is however more work required to establish an optimum timing strategy for sample collection to help reduce the burden of serial phlebotomy on these patients. Further work is also required to establish a clinical correlation between the levels of hs-cTnT observed and clinical cardiac changes determined by LVEF.
Footnotes
Declaration of conflicting interests
The author(s) declared no potential conflicts of interest with respect to the research, authorship, and/or publication of this article.
Funding
The author(s) disclosed receipt of the following financial support for the research, authorship, and/or publication of this article: This study was funded by Torbay Medical Research Funds, Project 123.
Ethical approval
Ethical approval for this study was granted by Health Research Authority (IRAS ID: 244,529) and Torbay and South Devon NHS Foundation Trust Research and Development.
Guarantor
AS.
Contributorship
DI was the primary researcher, drafted the research proposal, ethical and local R&D approval, performed sample collection, Presage ST2® assay validation, sample analysis, all statistical work contained in this article, all data analysis, drafted the original article manuscript including literature review. DI reviewed the article and made all corrections post pear review. DI wrote and approved the final submitted version. AS conceived the research idea and reviewed the first draft manuscript, JB reviewed the first draft manuscript.