
Abstract
Background and Aims
There is an ongoing need to recognize early kidney injury and its progression in structural chronic pathologies. The proteins neutrophil-gelatinase-associated lipocalin (NGAL), insulin-like growth factor-binding protein 7 (IGFBP7), tissue inhibitor of metalloproteinases 2 (TIMP2), kidney injury molecule-1 (KIM-1), C-X-C motif chemokine 9 (CXCL9), transforming growth factor-beta 1 (TGF-β1), solute carrier family 22 member 2 (SLC22A2), nephrin, cubilin, and uromodulin (UMOD) have been proposed as early kidney injury biomarkers. To guide clinical interpretation, their urinary concentrations should be accompanied by reference intervals, which we here establish in a representative Dutch middle-aged population.
Materials and Methods
The 24 h urine samples from 1443 Caucasian middle-aged men and women were analyzed for the biomarkers by quantitative LC-MS/MS. Biomarker excretion per 24 h were calculated, and urine creatinine and osmolality were measured for dilution normalization. This population was characterized by demographic and anthropometric parameters, comorbid conditions, and conventional kidney function measures.
Results
NGAL, IGFBP7, TIMP2, KIM-1, and UMOD could be quantified in this population, whereas nephrin, SLC22A2, and CXCL9 were below their detection limits. Urine creatinine and osmolality were correlated to urine volume (r = −0.71; −0.74) and to IGFBP7 (r = 0.73; 0.71) and TIMP2 (r = 0.71; 0.69). Crude and normalized biomarker concentrations were affected by sex, but not by age, body mass index, smoking, kidney function, or common comorbid conditions. The reference intervals (men; women) were 18–108; 21–131 pmol IGFBP7/mmol creatinine, 1–63; 4–224 pmol NGAL/mmol creatinine, 7–48; 7–59 pmol TIMP2/mmol creatinine, <1–9; <1–12 pmol KIM-1/mmol creatinine, and 0.1–1.2; 0.1–1.7 mg UMOD/mmol creatinine.
Conclusion
We present dilution-normalized and sex-stratified urinary reference intervals of kidney injury biomarkers in a middle-aged Caucasian population.
Keywords
Introduction
There is an ongoing and unmet clinical need for the early and specific detection of kidney injury in hospitalized patients. To address this need, we previously proposed a protein panel including early urinary kidney injury biomarkers neutrophil-gelatinase-associated lipocalin (NGAL), insulin-like growth factor-binding protein 7 (IGFBP7), tissue inhibitor of metalloproteinases 2 (TIMP2) and kidney injury molecule-1 (KIM-1) supplemented with inflammation marker C-X-C motif chemokine 9 (CXCL9), fibrosis marker transforming growth factor-beta 1 (TGF-β1) and the more specific kidney-tissue enriched proteins nephrin (glomerulus), uromodulin (UMOD) (distal tubules and loop-of-Henle), solute carrier family 22 member 2 (SLC22A2) (proximal tubules), and cubilin (proximal tubules). 1 Recently, we developed an in-house and multiplex mass spectrometry (MS)-based test to quantitate these kidney injury biomarkers in urinary samples. 2 Reference intervals are a key element of the post-analytical phase of test development and essential for evaluation of the clinical value of kidney injury biomarkers in future studies. 3
The early kidney injury biomarkers TIMP2, IGFBP7, NGAL, and KIM-1 have promising clinical performance in the prediction of AKI events.4–6 Medical in-vitro tests determining NGAL or the product of TIMP2 and IGFBP7 are available for AKI prediction after cardiothoracic surgery and in critically ill patients. 7 Nevertheless, the translation of these biomarkers towards daily clinical practice has been limited, most likely explained by poor understanding of the biomarker kinetics in urine samples either in health or disease. 8 To guide the clinical interpretation of kidney injury biomarkers laboratory results should be accompanied by reference intervals. For instance, a unisex reference interval of <398–2187 pmol/L (<9.0–49.4 ng/mL) has been reported based on NGAL concentrations in urinary samples of healthy individuals, 9 whereas others proposed intervals for urinary NGAL and KIM-1 stratified by age and sex. 10 For the product of urinary TIMP2 and IGFBP7 a central 95% reference interval of 0.04–2.22 (ng/mL) 2 has been determined for the NephroCheck Test® (Astute Medical), although the contribution of the individual proteins remains unexplained. 11 To the best of our knowledge, there are no reference intervals available in the scientific literature for urinary concentrations of UMOD, CXCL9, nephrin, TGF-β1, SLC22A2, and cubilin.
For the interpretation of biomarker levels in urine, analytes are commonly reported as the total excreted amount per 24 h or normalized for hydration-driven dilution. Variability in water volume intake affects urine volume and osmolality, and contributes to within-subject biological variability of urinary biomarkers.12,13 An ideal parameter for hydration-driven urine dilution normalization is related to the urine volume and is independent from inter-individual variations in the internal blood concentrations. 14 Within the field of clinical chemistry, urine creatinine, a small metabolite of muscle creatine phosphate, is used as default dilution-normalization parameter that relies on the assumption of a linear relation between urine production and renal excretion of creatinine. 14 Urine osmolality, which represents the total solute content in the sample, and specific gravity, which is an estimate of osmolality but affected by the weight of molecules, have been proposed as alternative dilution-correction parameters.10,15–17
The objective of this study was to establish reference intervals of urinary kidney injury biomarkers in urine samples obtained from a population-based cohort of middle-aged men and women. To enable multiplex quantitation of kidney injury biomarkers from picomolar to nanomolar levels in urine, we used an analytical method that combines immunocapture combined with liquid-chromatography (LC) coupled to tandem MS. 2 First, we evaluated the eligibility of creatinine and osmolality for urine dilution normalization, as well as 24 h excretion rates. Second, we assessed the possible linear association between emerging kidney injury biomarkers and conventional laboratory tests urine creatinine, osmolality, β-2-microglobulin (B2M), and total protein (TP). Third, we examined whether urinary kidney injury biomarker concentrations are affected by age, sex, ethnicity, body mass index (BMI), smoking, kidney function, and common comorbid conditions in the general population. Finally, we propose reference intervals for the kidney injury biomarkers in urine in Caucasian middle-aged adults.
Materials and methods
Study design and population
For this study, we used data from a subpopulation of The Netherlands Epidemiology of Obesity Study (NEO), a population-based cohort study. For this subpopulation study, all inhabitants between 45 and 65 years of one municipality (Leiderdorp, The Netherlands) were invited to participate, irrespective of their BMI between 2008 and 2012 (n = 1671). All participants from whom a 24 h urine sample (defined as a urine collection between 20 and 25 h) was available, were included in this biomarker evaluation study (n = 1449, 86.7%). The Medical Ethical Committee of the Leiden University Medical Center approved the design of the NEO study. All participants gave their written informed consent. The study design and data collection of the NEO study have been described in detail previously. 18 In brief, participants completed a general questionnaire at home to report demographic, lifestyle, and clinical information. Participants reported their medical history of diabetes, cardiovascular disease (CVD), and kidney disease on the questionnaire. Pre-existing CVD was defined as myocardial infarction, angina, congestive heart failure, stroke, or peripheral vascular disease. History of hypercholesteremia was self-reported. Participants collected urine for 24 h and came to the NEO research site after an overnight fast. At the study center, participants underwent an extensive physical examination including anthropometry and blood sampling. Hypertension was defined as a measured blood pressure systolic blood pressure ≥140 mm Hg or diastolic ≥90 mm Hg. Diabetes mellitus type I or II was defined by medication, a fasting plasma glucose of ≥7.0 mmol/L or self-reported diabetes. Kidney function was described by serum creatinine and estimated glomerular filtration rate (eGFR) by the CKD-EPI equation.
Urine pre-analysis and sample storage
After 24 h urine sample collection (2011–2012), the urine samples were aliquoted and stored at −80°C. To determine reference intervals, urine samples were thawed, centrifuged at 3000 g for 8 min and restored at −80°C for 2–3 months until biomarker analysis (2020). Urine samples underwent two freeze-thaw cycles prior to all analyses.
Laboratory analyses
Urinary TIMP2, IGFBP7, NGAL, KIM-1, cubilin, CXCL9, SLC22A2, nephrin, TGF-β1, and UMOD were determined with an in-house developed and validated multiplex LC-MS/MS. 2 Briefly, target proteins were immunocaptured from urinary samples, denatured, reduced, alkylated, and digested into peptides prior to LC-MS/MS analysis. For absolute protein quantitation, stable isotope-labelled peptides for each measurand were added as internal standards and the relative responses obtained were interpolated for our external calibration curve. Neutrophil-gelatinase-associated lipocalin, KIM-1, IGFBP7, TIMP-2, CXCL9, SLC22A2, and nephrin concentrations were reported in pmol/L as previously detailed. 2 A native-urine based calibrator was value-assigned by ELISA for UMOD to report concentrations in mg/L (Cat. nr. RD191163200 R, BioVendor, Brno, Czech Republic). The LC-MS/MS analyses were performed on a 1290 UPLC system coupled to a triple-quadrupole mass spectrometer (Agilent Technologies, Santa Clara, CA) operating in multiple-reaction monitoring mode (MRM). Ten μL sample was injected on a Zorbax SB-C18 with 1.8 μm particle guard column (2.1×5 mm) and analytical column (2.1×50 mm) (Agilent Technologies, Santa Clara, CA) and peptides were separated using a nonlinear gradient with 1% (v/v) MeOH/0.05% formic acid in MQ water as mobile phase A and 95% (v/v) MeOH/0.05% formic acid in MQ as mobile phase B, at a flow rate of 0.3 mL/min. The LC-MS/MS instrument performance was assessed by a system suitability test performed prior to and after each batch run of study samples and all batches passed the acceptance criteria for retention time drift (≤0.2 min) and imprecision on relative response (coefficient of variation, CV <10%) and ion ratio (CV <20%). LC-MRM-MS analyses of urine samples from the reference population were performed in 18-batches in 96-well format and two urine-based internal quality control (IQC) samples were monitored per batch in Levey–Jennings charts for quality assurance. The mean values (%CV) of IQC-2 and IQC-5 were 3587 (8.6%) and 2483 pmol/L (12.5%) for NGAL, 540 (13.9%) and 750 pmol/L (12.2%) for IGFBP7, 2249 (13.4%) and 2210 pmol/L (14.3%) for TIMP2, 95 (24.8%) and 1722 pmol/L (12.5%) for KIM-1, 9 (24.2%) and 1500 pmol/L (19.5%) for CXCL9, 0.05 mg/L (36.4%) and 0.15 mg/L (25.5%) for UMOD.
Total protein concentration in urine was determined by turbidimetry (Cat. Nr. 05171954190), urinary B2M was determined by immunoturbidimetry (Cat. Nr. 08047430190) and urinary creatinine by an enzymatic method (Cat. Nr. 3263991190), all using a Cobas C8000 c702 (Roche Diagnostics, Mannheim, Germany). Internal quality controls for all analytes were determined each day of analysis. The mean values (%CV) of IQCs were 1.21 mg/L (6.7%) and 2.96 mg/L (4.7%) for beta-2-microglobulin, 7.18 (1.2%) and mmol/L (1.2%) for creatinine and 0.20 g/L (2.2%) and 0.53 (1.5%) for TP. Urinary kidney injury biomarker concentrations are dependent on urine output and therefore were normalized for dilution by creatinine or osmolality. Urine osmolality was determined by freezing point depression using an Osmo-Station (Auto & Stat model OM-6060, Arkray Inc. Kyoto, Japan). The mean IQC values of the osmolality were 311 mOsmol/kg (0.8%CV) and 549 mOsmol/kg (0.9%CV). All laboratory analyses in the 24 h urine samples were completed in the period between November 2020 and January 2021.
Data analysis
Mass Hunter Workstation software, version 10.0 (Agilent Technologies) was used for peak integration of LC-MRM-MS data. The obtained LC-MRM-MS data were examined for validity by (1) signal intensity monitoring of the internal standard with a minimal peak area of 2000 counts, (2) comparison of the peptide results from the same protein with Passing–Bablok regression, and (3) descriptive statistics and principal component analysis (PCA) to identify potential batch effects. Six of 1449 sample (0.4%) were classified invalid due to poor signal intensity of the internal standard in LC-MRM-MS analysis and excluded from the final dataset, leaving n = 1443 (Supplemental Figure 1). The validity of peptide-based protein quantitation was examined by interpeptide comparison and the peptides originating from the same proteins were in agreement (Supplemental Figure 2). No batch effects were identified by robust median difference plots or by PCA (Supplemental Figure 3).
Crude and dilution-normalized urinary levels of the biomarkers were explored. Concentrations were normalized for urinary dilution in two ways: by dividing the biomarker concentration by osmolality (osmol/kg) or creatinine (mmol/L). The distribution of all laboratory variables was examined by visual inspection of histograms and measures of data skewness and kurtosis. Correlations between biomarkers were calculated using Spearman’s rank correlation coefficient. Biomarker data were Box-Cox transformed and grouped by demographic, anthropometric variables and comorbid conditions. Group means with standard deviation (SD) were compared and tested for significance using un-paired t-test or one-way ANOVA. A P-value smaller than 0.05 was considered statistically significant. To examine whether mean concentration values depended on a combination of variables, we performed a multivariate regression analysis with backward elimination (using best AIC as selection criterion). Reference values were calculated nonparametrically because of the large number of observations (n = 1443), the skewness of the urine biomarker variables and the recommendations by the International Federation of Clinical Chemistry (IFCC), European Federation of Laboratory Medicine (EFLM) and the CLSI-28-A3c guideline.19,20 The 2.5th percentile of the biomarker distribution was set as lower reference limit and the 97.5th percentile as upper reference limit. As sensitivity analysis, parametric reference intervals were calculated after applying a Box-Cox transformation on the biomarker variable and calculating the mean ± 2SD on the transformed variable, and then back transformed. Statistical analyses were performed using R (http//www.r-project.org/, R version 4.0.2). The R package MASS was used for backwards variable selection.
Results
Population characteristics
Characteristics of the study population.
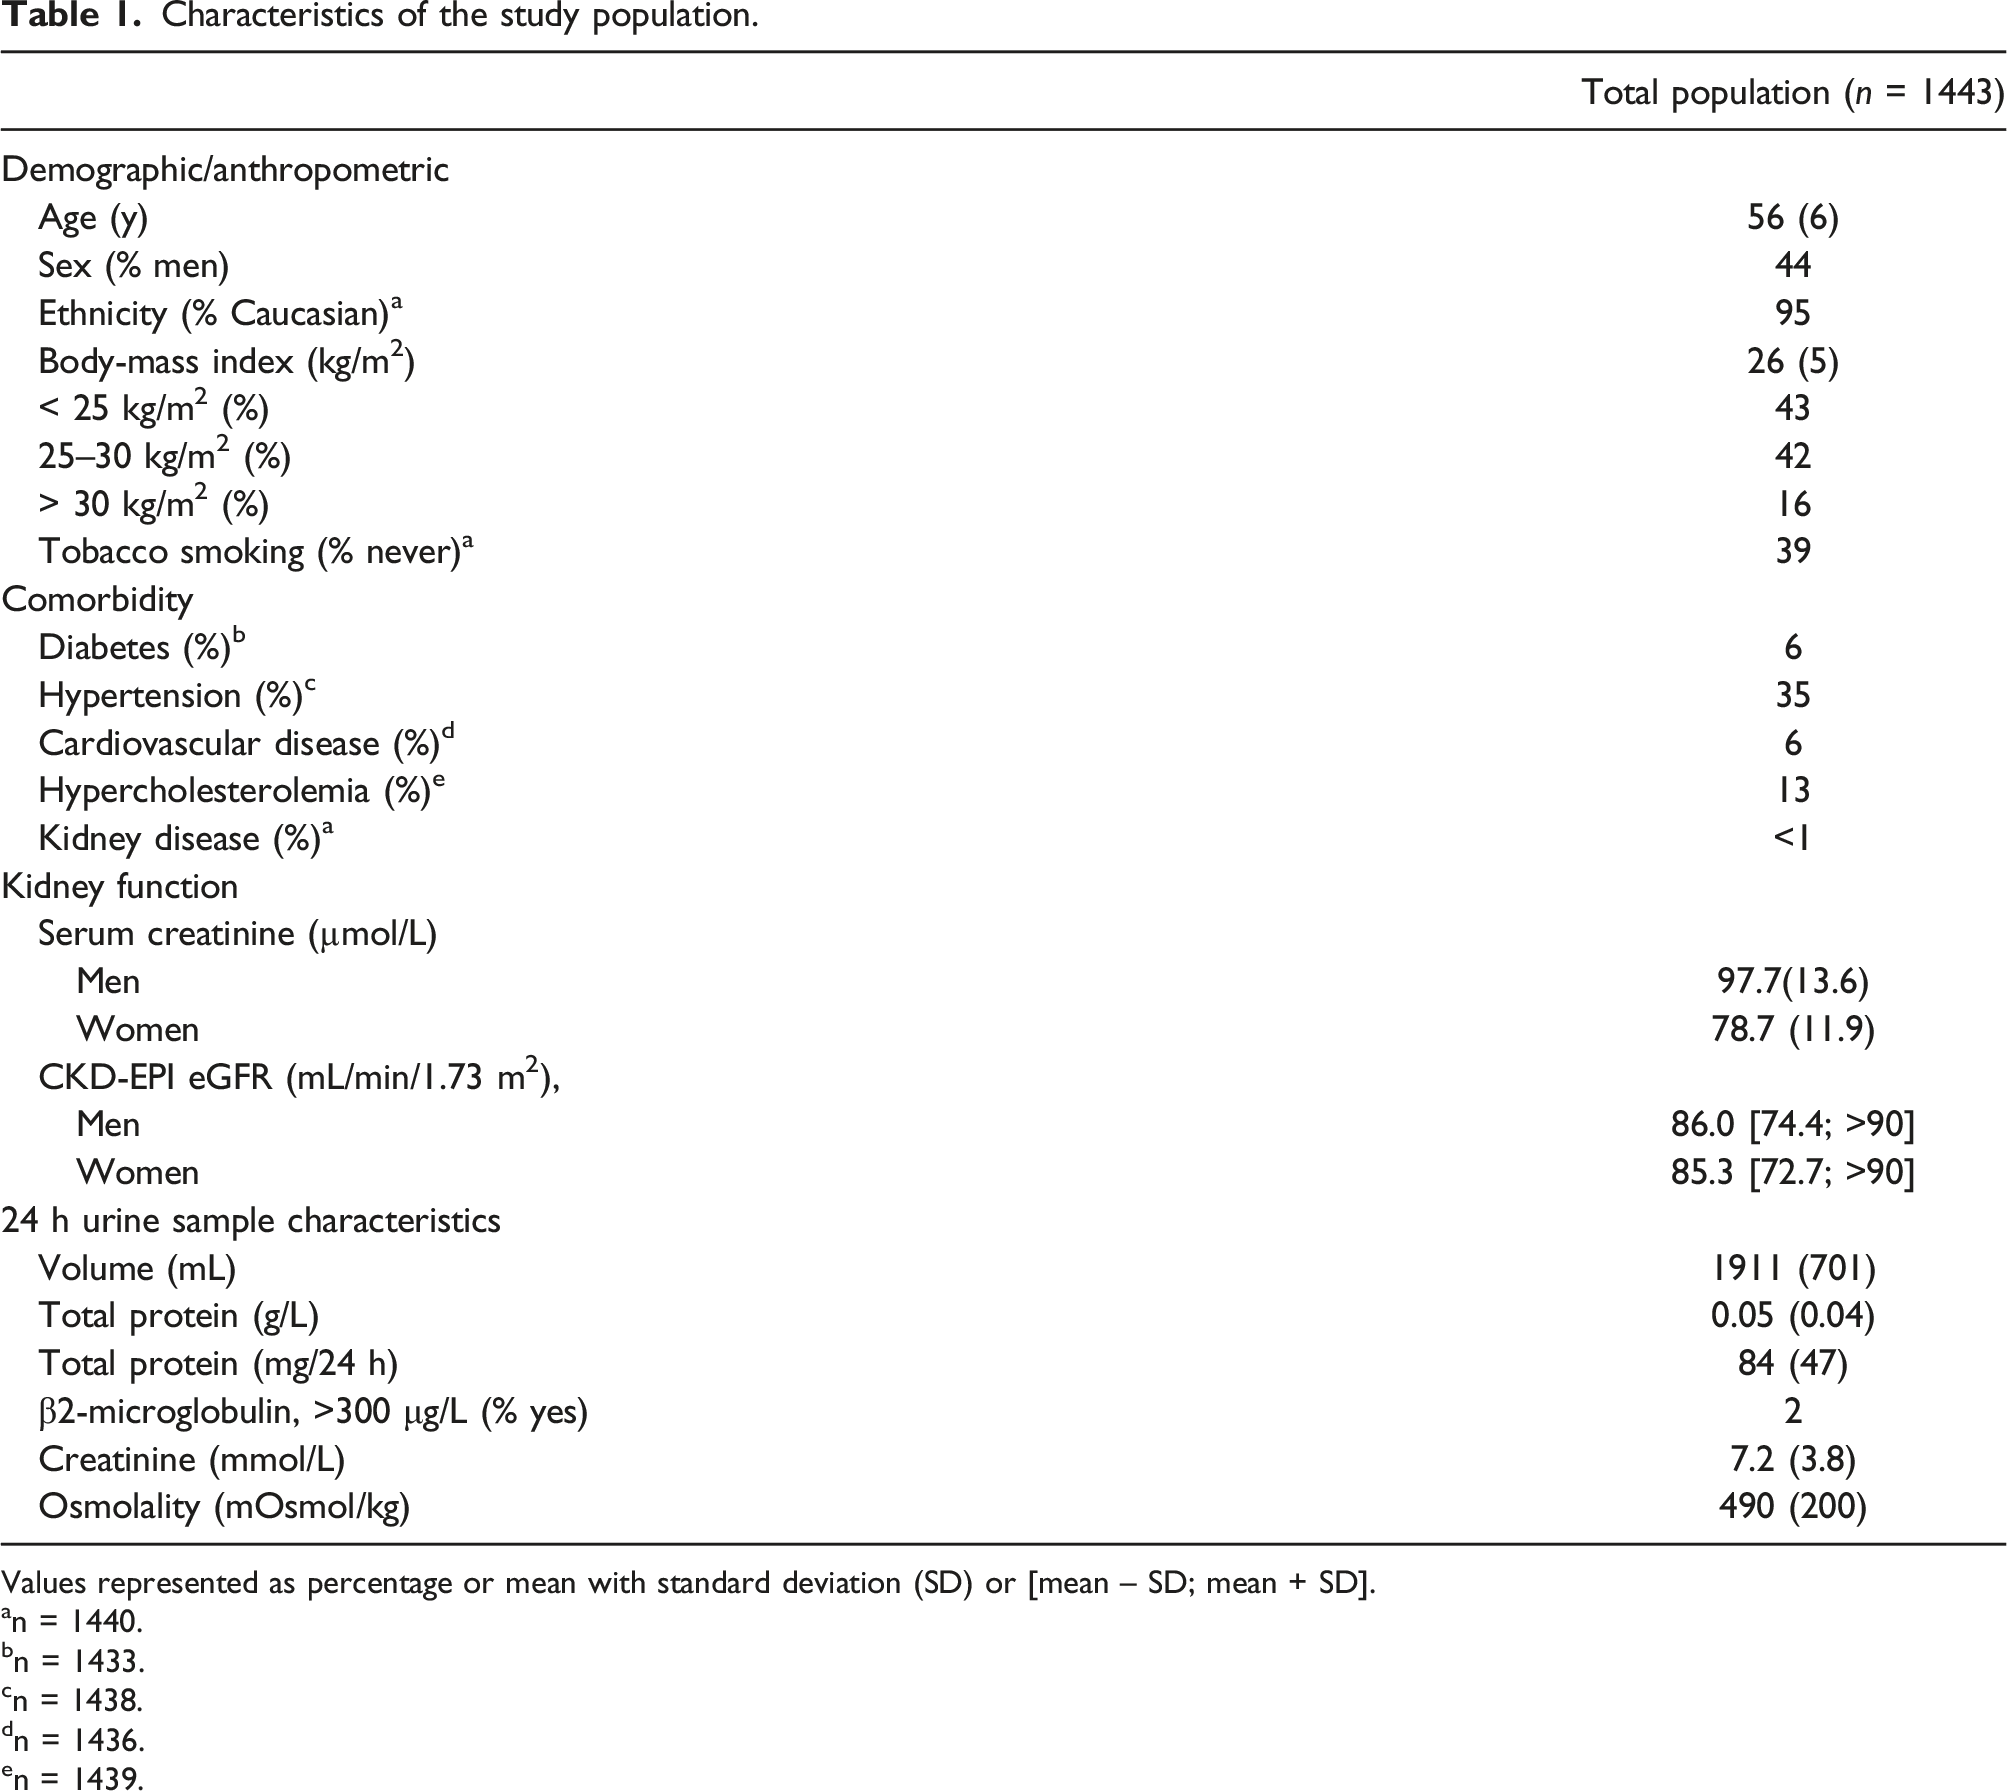
Values represented as percentage or mean with standard deviation (SD) or [mean – SD; mean + SD].
an = 1440.
bn = 1433.
cn = 1438.
dn = 1436.
en = 1439.
Urinary creatinine and osmolality for concentration normalization in 24 h urine specimens
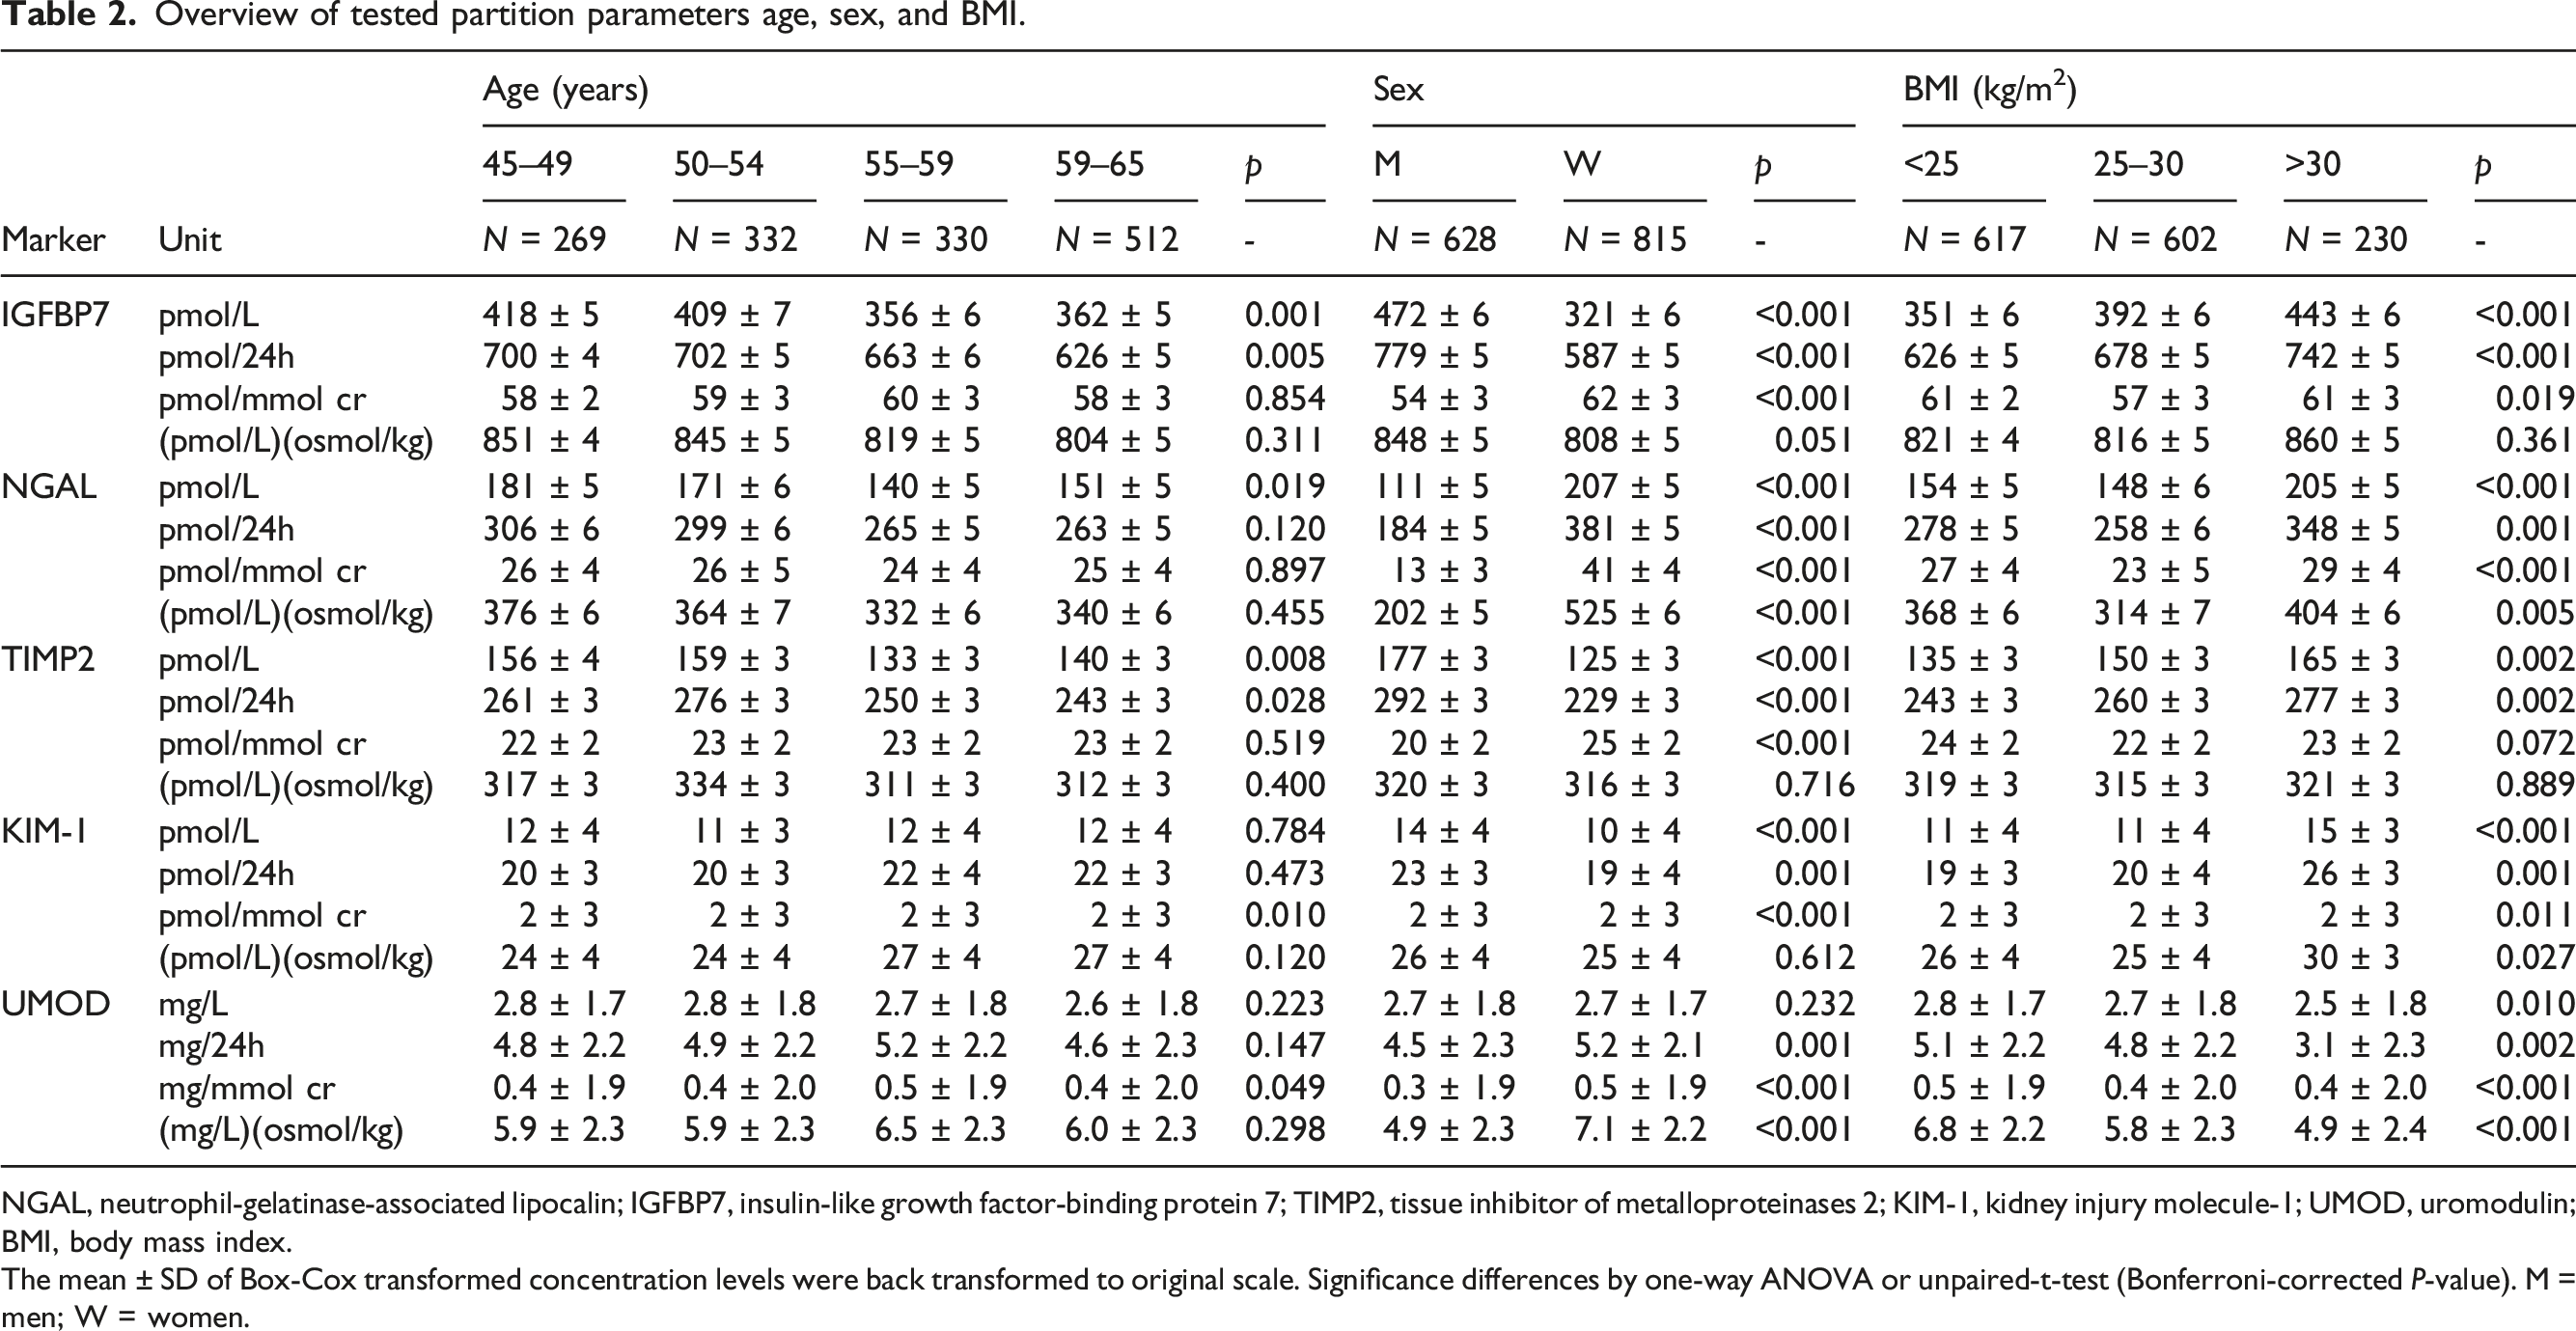
Urinary biomarker results expressed by excretion per 24 h obviates the effect of urine specimen dilution, but requires 24 h urine collection and total volume estimation. To study the eligibility of dilution normalization by urine creatinine or osmolality, we examined their relation with collected 24 h urine volume. Creatinine and osmolality were strongly correlated (r = 0.90) and inversely correlated with 24 h urine volume (r = −0.77 and r = −0.74). (Figure 1(a)–(c)). The relation between urine volume and creatinine or osmolality tended to be exponential, with stagnating creatinine or osmolality values for extreme urine output (e.g., >3 L/24 h). Noteworthy, women produced more urine over 24 h (median = 1950 mL, 95%CI: 1900–2000 mL) than men (median = 1700 mL, 95%CI:1650–1800 mL) (Figure 1). Likewise, urine creatinine concentration and osmolality were higher in men compared to women. The sex differences in urine output will likely affect the crude biomarker concentrations, although the sex-effect may be eliminated by normalization by urine osmolality (Table 2). Interestingly, the excreted biomarker amount also differed between men and women, as IGFBP7 and TIMP2 excretion over 24 h were higher in men and NGAL excretion was significantly higher in women. The relation between 24 h urine volume and parameters for urine dilution normalization osmolality (a), creatinine (b), and the correlation between osmolality, and creatinine (c). Red = women, black = men. The Spearman’s rank correlation coefficient is given. Overview of tested partition parameters age, sex, and BMI. NGAL, neutrophil-gelatinase-associated lipocalin; IGFBP7, insulin-like growth factor-binding protein 7; TIMP2, tissue inhibitor of metalloproteinases 2; KIM-1, kidney injury molecule-1; UMOD, uromodulin; BMI, body mass index. The mean ± SD of Box-Cox transformed concentration levels were back transformed to original scale. Significance differences by one-way ANOVA or unpaired-t-test (Bonferroni-corrected P-value). M = men; W = women.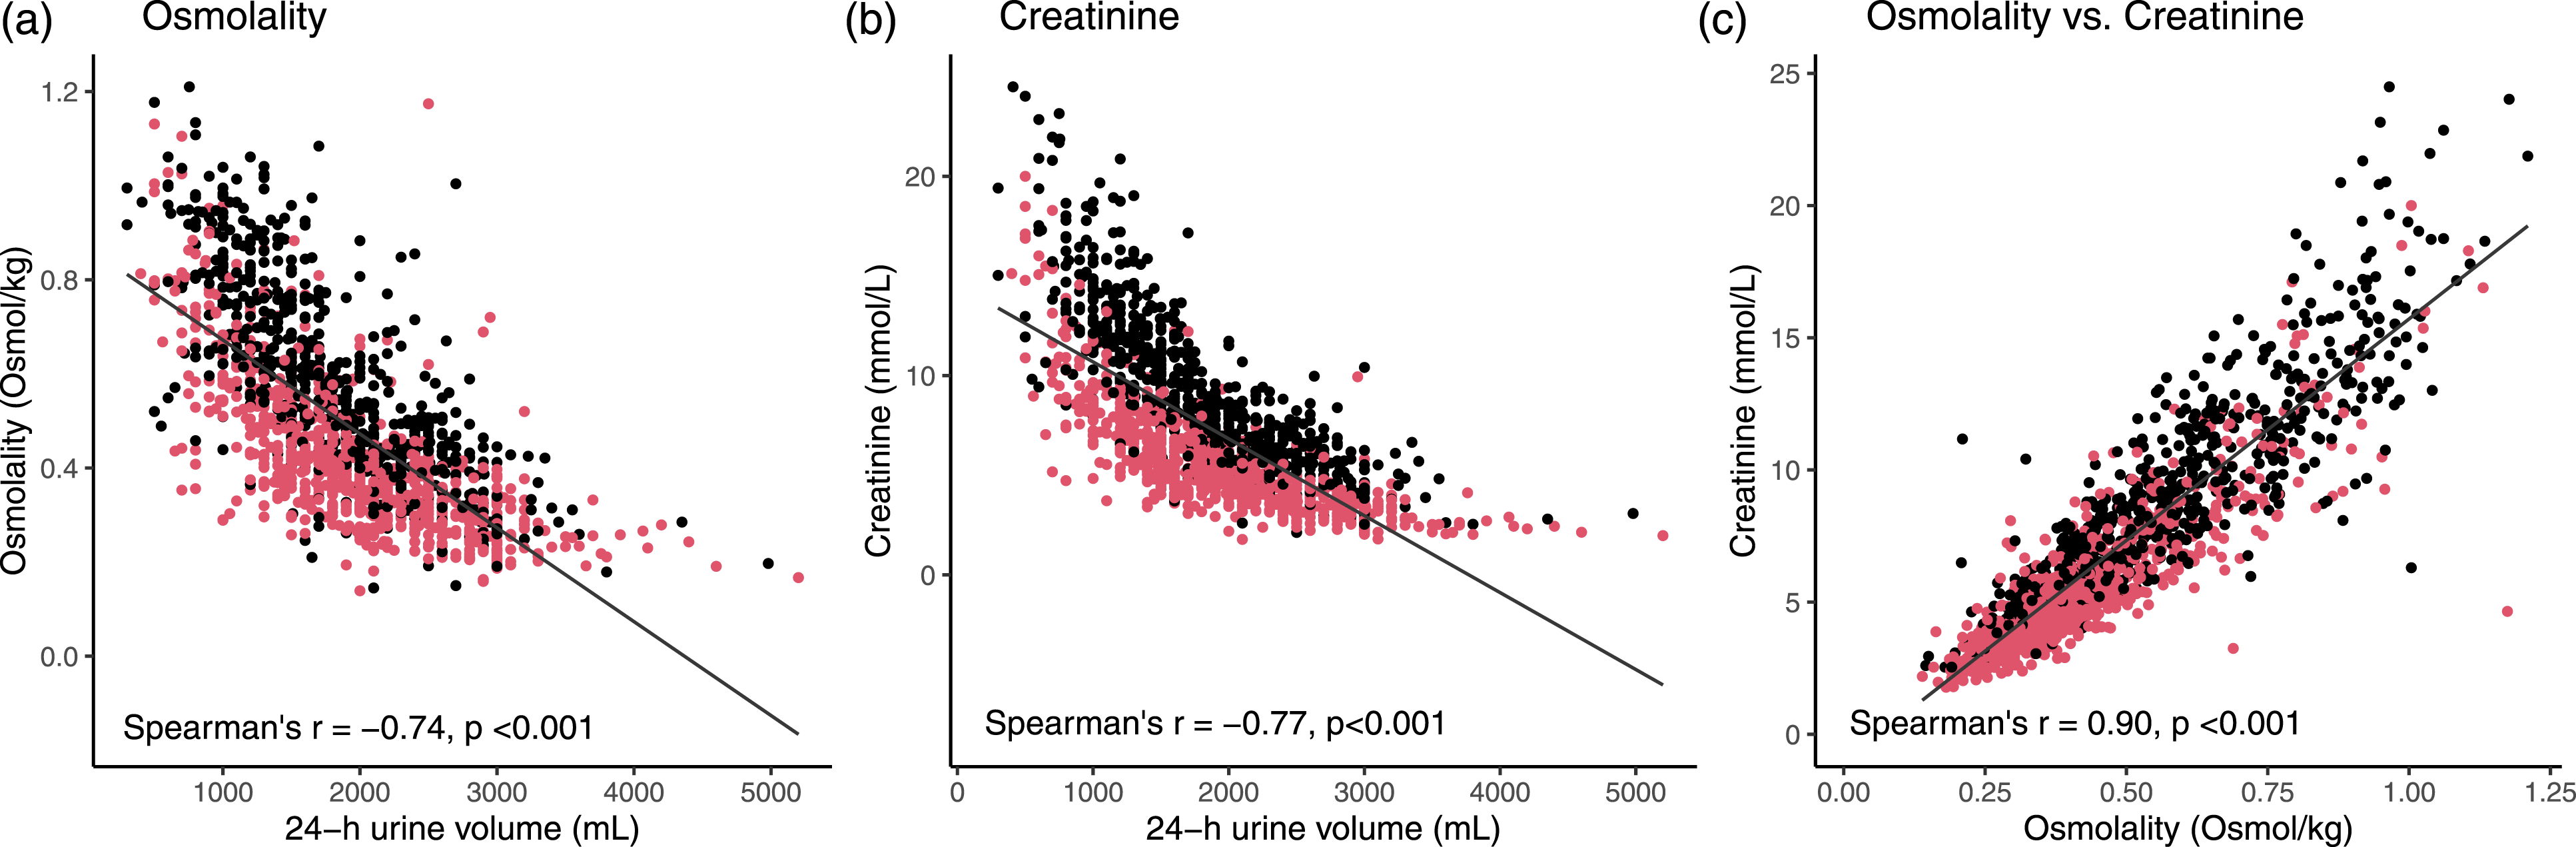
Urinary biomarker levels and distribution
The early injury biomarkers NGAL, IGFBP7, TIMP2, KIM-1, and tubular protein UMOD could be detected in urine samples, whereas kidney tissue-enriched proteins cubilin, SLC22A2, nephrin, calbindin, CXCL9, and TGF-β1 were below the limit of detection using the LC-MS/MS method (overall ±1 pmol/L). Neutrophil-gelatinase-associated lipocalin, IGFBP7, TIMP2, and UMOD were quantified in ≥ 99% of the urinary samples. In 59% of urine samples, KIM-1 concentrations were between the detection limit (LoD) (1 pmol/L) and the lower limit of quantitation (LLoQ) (10 pmol/L), and therefore reported as <10 pmol/L. Distributions of NGAL, IGFBP7, TIMP2, KIM-1, and UMOD concentrations and excreted amounts per 24 h in urine samples were highly skewed with a positive tail (skewness >0, kurtosis >3, for all markers) (Figure 2). After normalization for osmolality or creatinine the distribution of IGFBP7, TIMP2, and KIM-1 concentrations was less skewed, but NGAL and UMOD remained very skewed. Frequency distribution of absolute and dilution-normalized concentrations of IGFBP7, NGAL, TIMP2, KIM-1, and uromodulin in urinary samples of a middle-aged reference population (n = 1443). IGFBP7, NGAL, TIMP2, and KIM-1 concentrations are reported in pmol/L and uromodulin in mg/L. The dashed lines represent the calculated reference upper limit (97.5th percentile) of kidney injury markers IGFBP7, NGAL, TIMP2, and KIM-1 concentrations and the lower limit (2.5th percentile) of uromodulin. All biomarker distributions stratified by sex (dark = women, light = men) for visualization and reference upper or lower limits are only stratified by sex when statistically significant and concentration differences considered clinically relevant. Neutrophil-gelatinase-associated lipocalin; IGFBP7, insulin-like growth factor-binding protein 7; TIMP2, tissue inhibitor of metalloproteinases 2; and KIM-1, kidney injury molecule-1.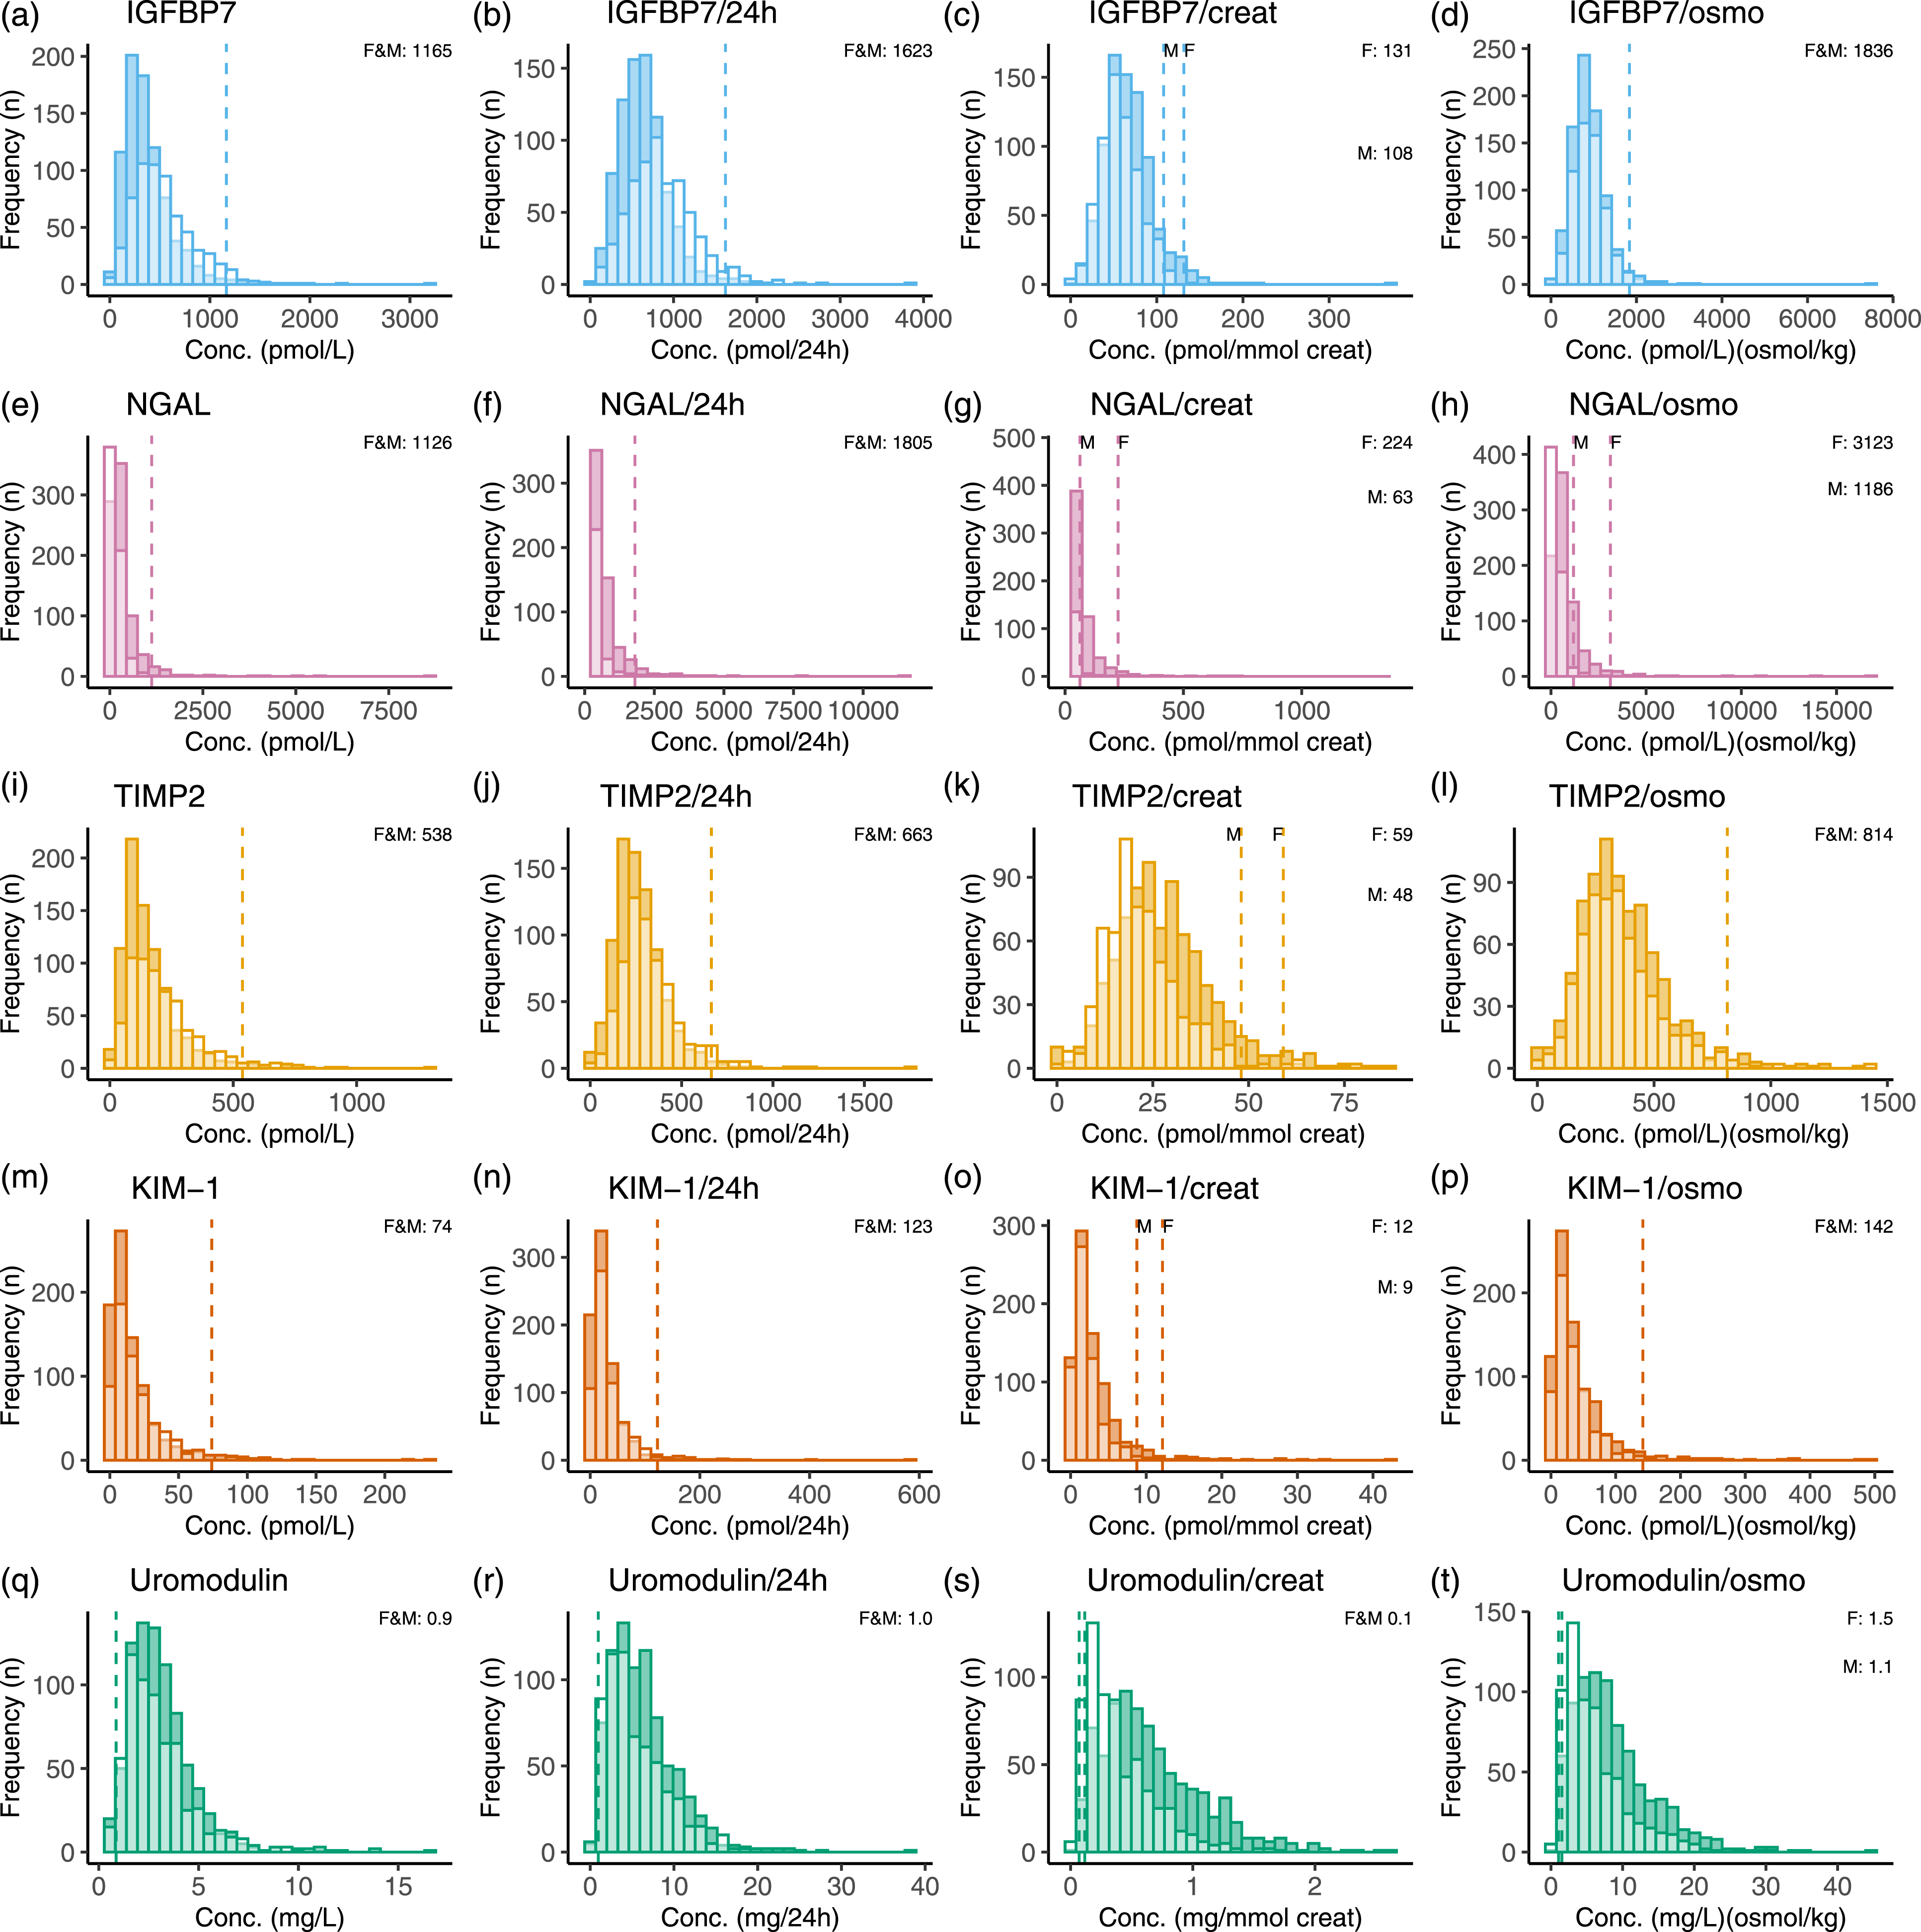
Biomarker correlations
The linear relationship between the five detectable biomarkers of the kidney injury test panel and conventional urine parameters—urinary creatinine, osmolality, B2M, and TP—are provided in Figure 3. The early kidney injury biomarkers TIMP2 and IGFBP7 were highly correlated and associated with urinary TP concentration creatinine and osmolality. After creatinine normalization, IGFBP7 and TIMP2 correlated weakly and TIMP2 became stronger correlated to KIM-1 and NGAL. Interestingly, UMOD, total urinary protein and B2M were correlated only after creatinine normalization. The kidney injury biomarkers were not correlated with CKD-EPI eGFR (All Spearman’s ρ ≤ 0.09) or serum creatinine (All Spearman’s ρ ≤ 0.15) (Supplemental Figure 4). Correlation matrix with crude (a) or creatinine-normalized and (b) urinary kidney injury biomarker concentrations and conventional urinary tests total urinary protein (uTP), urine creatinine (uCreat), and β-2-microglobulin (uB2M). The Spearman’s rank-order correlation coefficient ρ is given.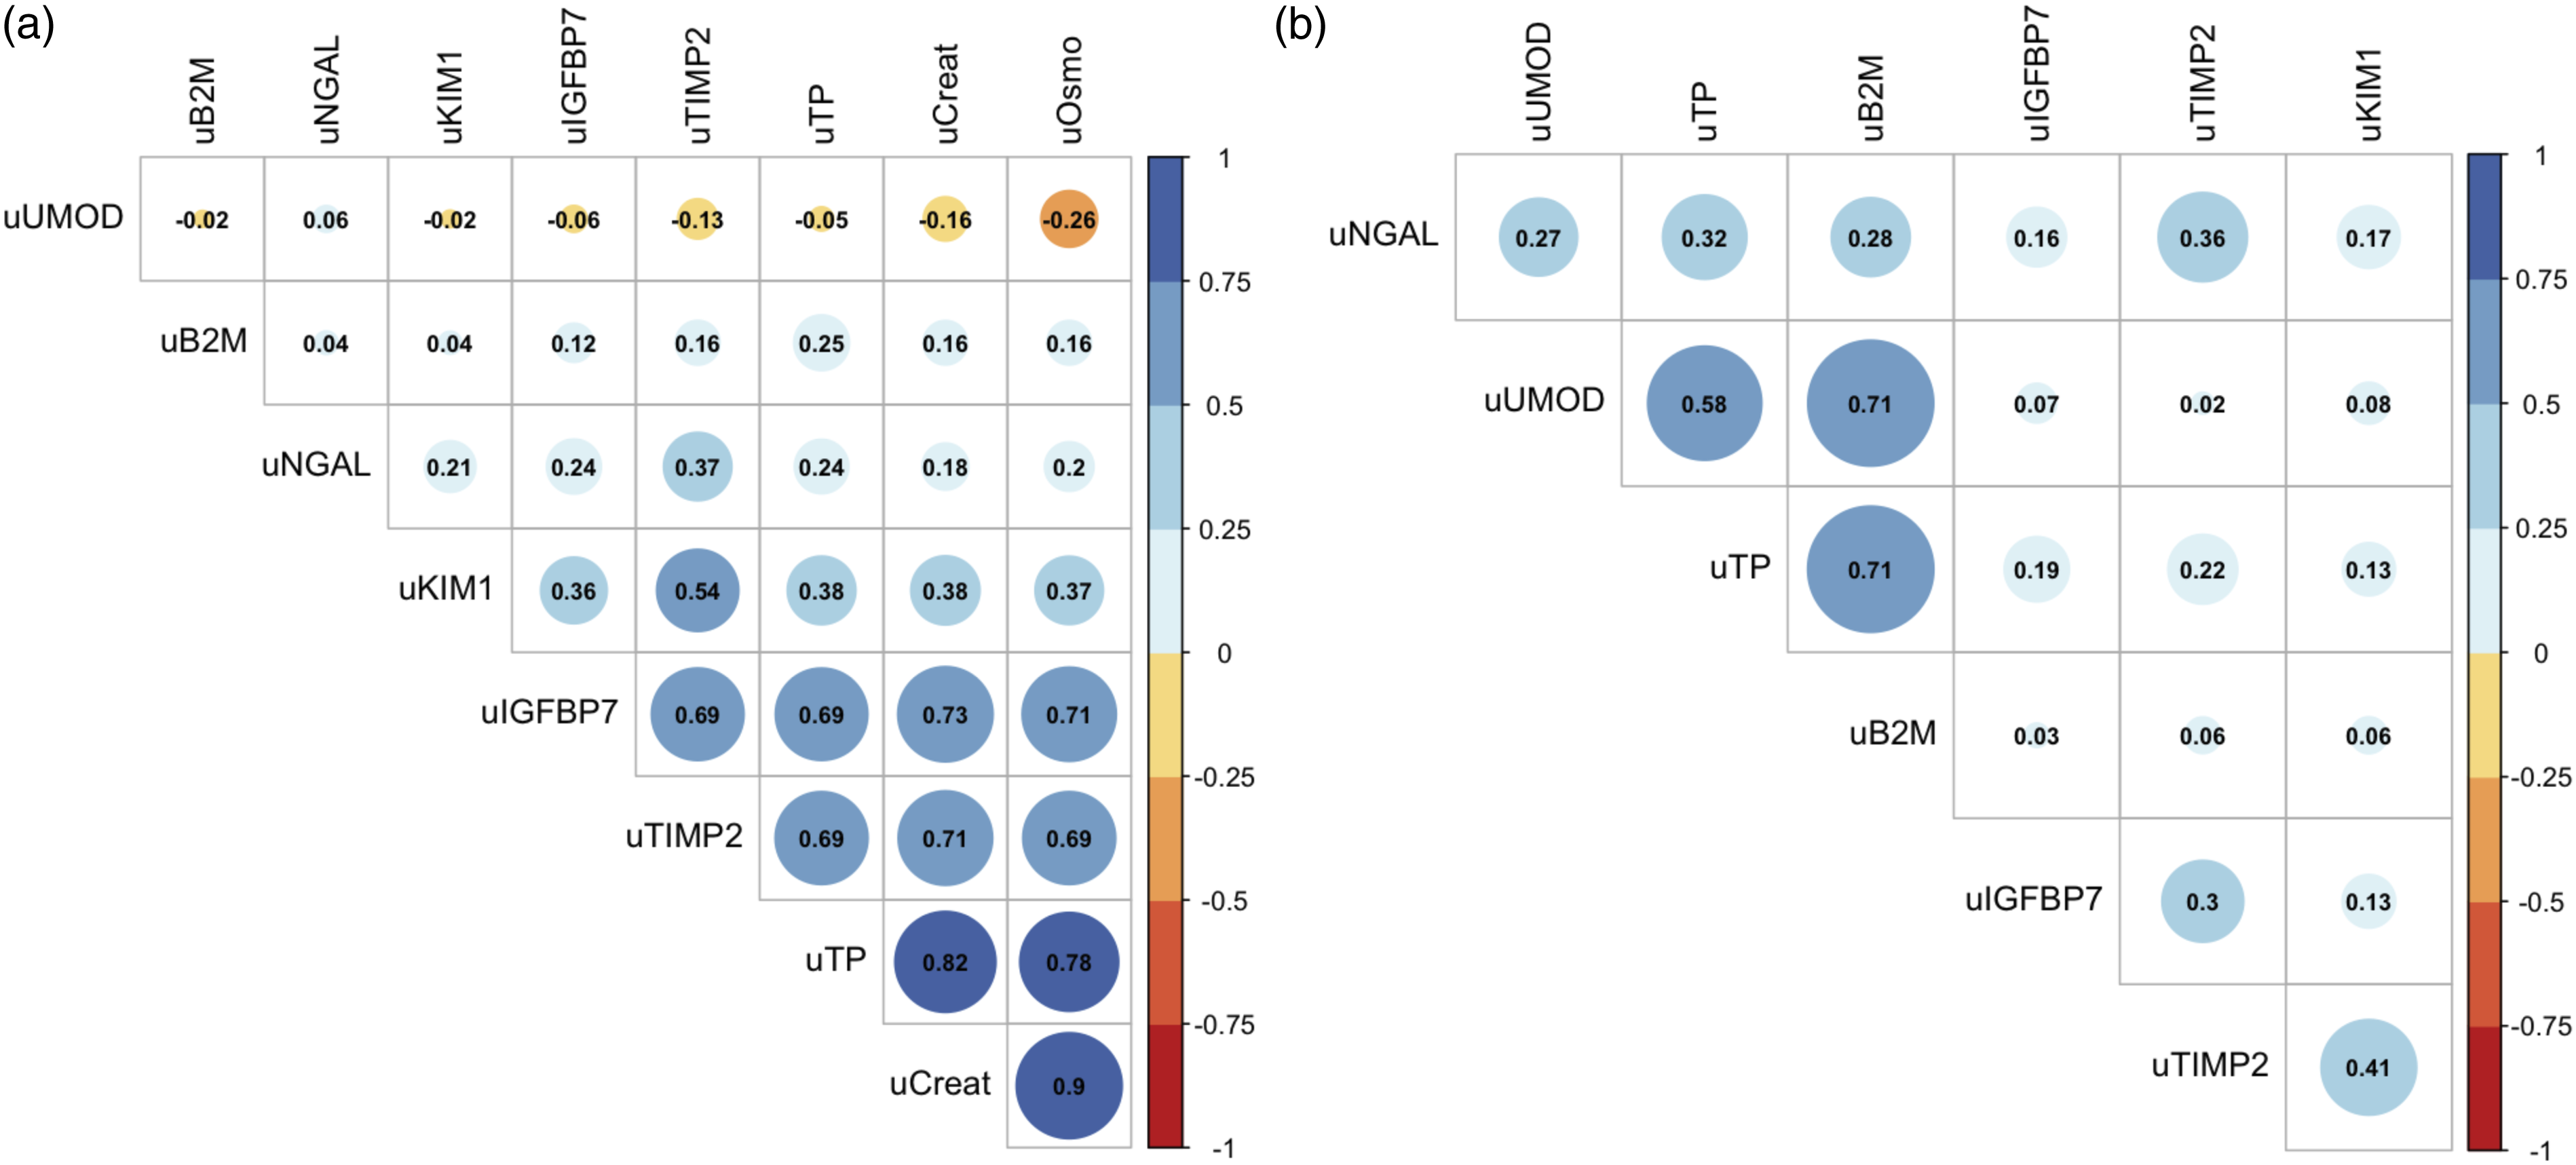
Reference intervals of kidney injury biomarkers in urine
Overview of tested partition parameters smoking, hypertension, and hypercholestrolemia.
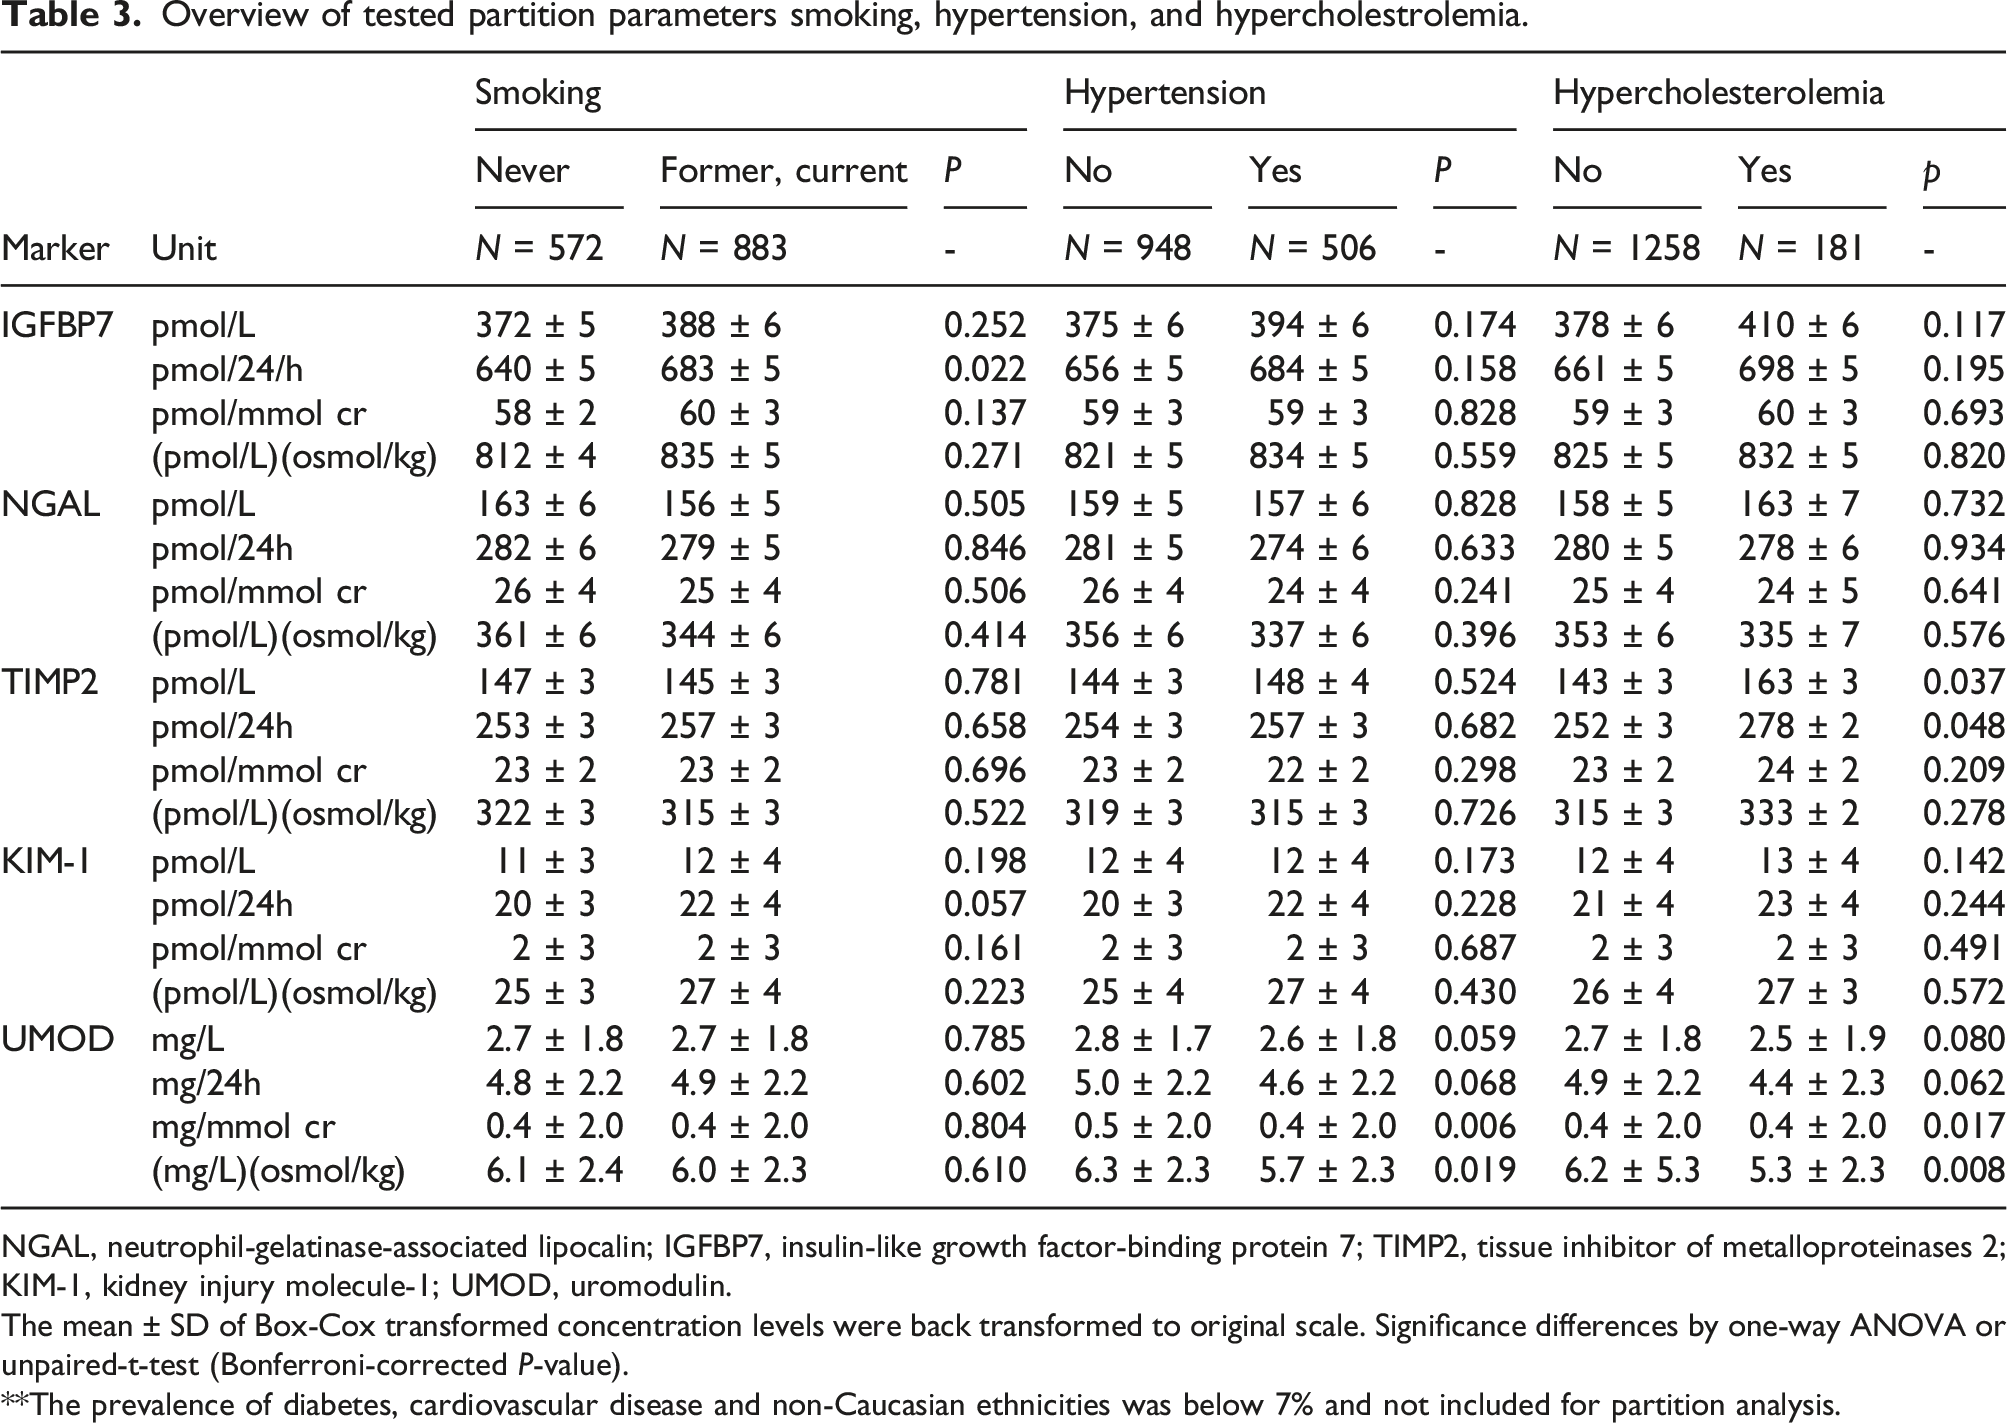
NGAL, neutrophil-gelatinase-associated lipocalin; IGFBP7, insulin-like growth factor-binding protein 7; TIMP2, tissue inhibitor of metalloproteinases 2; KIM-1, kidney injury molecule-1; UMOD, uromodulin.
The mean ± SD of Box-Cox transformed concentration levels were back transformed to original scale. Significance differences by one-way ANOVA or unpaired-t-test (Bonferroni-corrected P-value).
**The prevalence of diabetes, cardiovascular disease and non-Caucasian ethnicities was below 7% and not included for partition analysis.
Crude and dilution-normalized reference intervals of urine kidney injury biomarkers for middle-aged men and women (n = 1443).
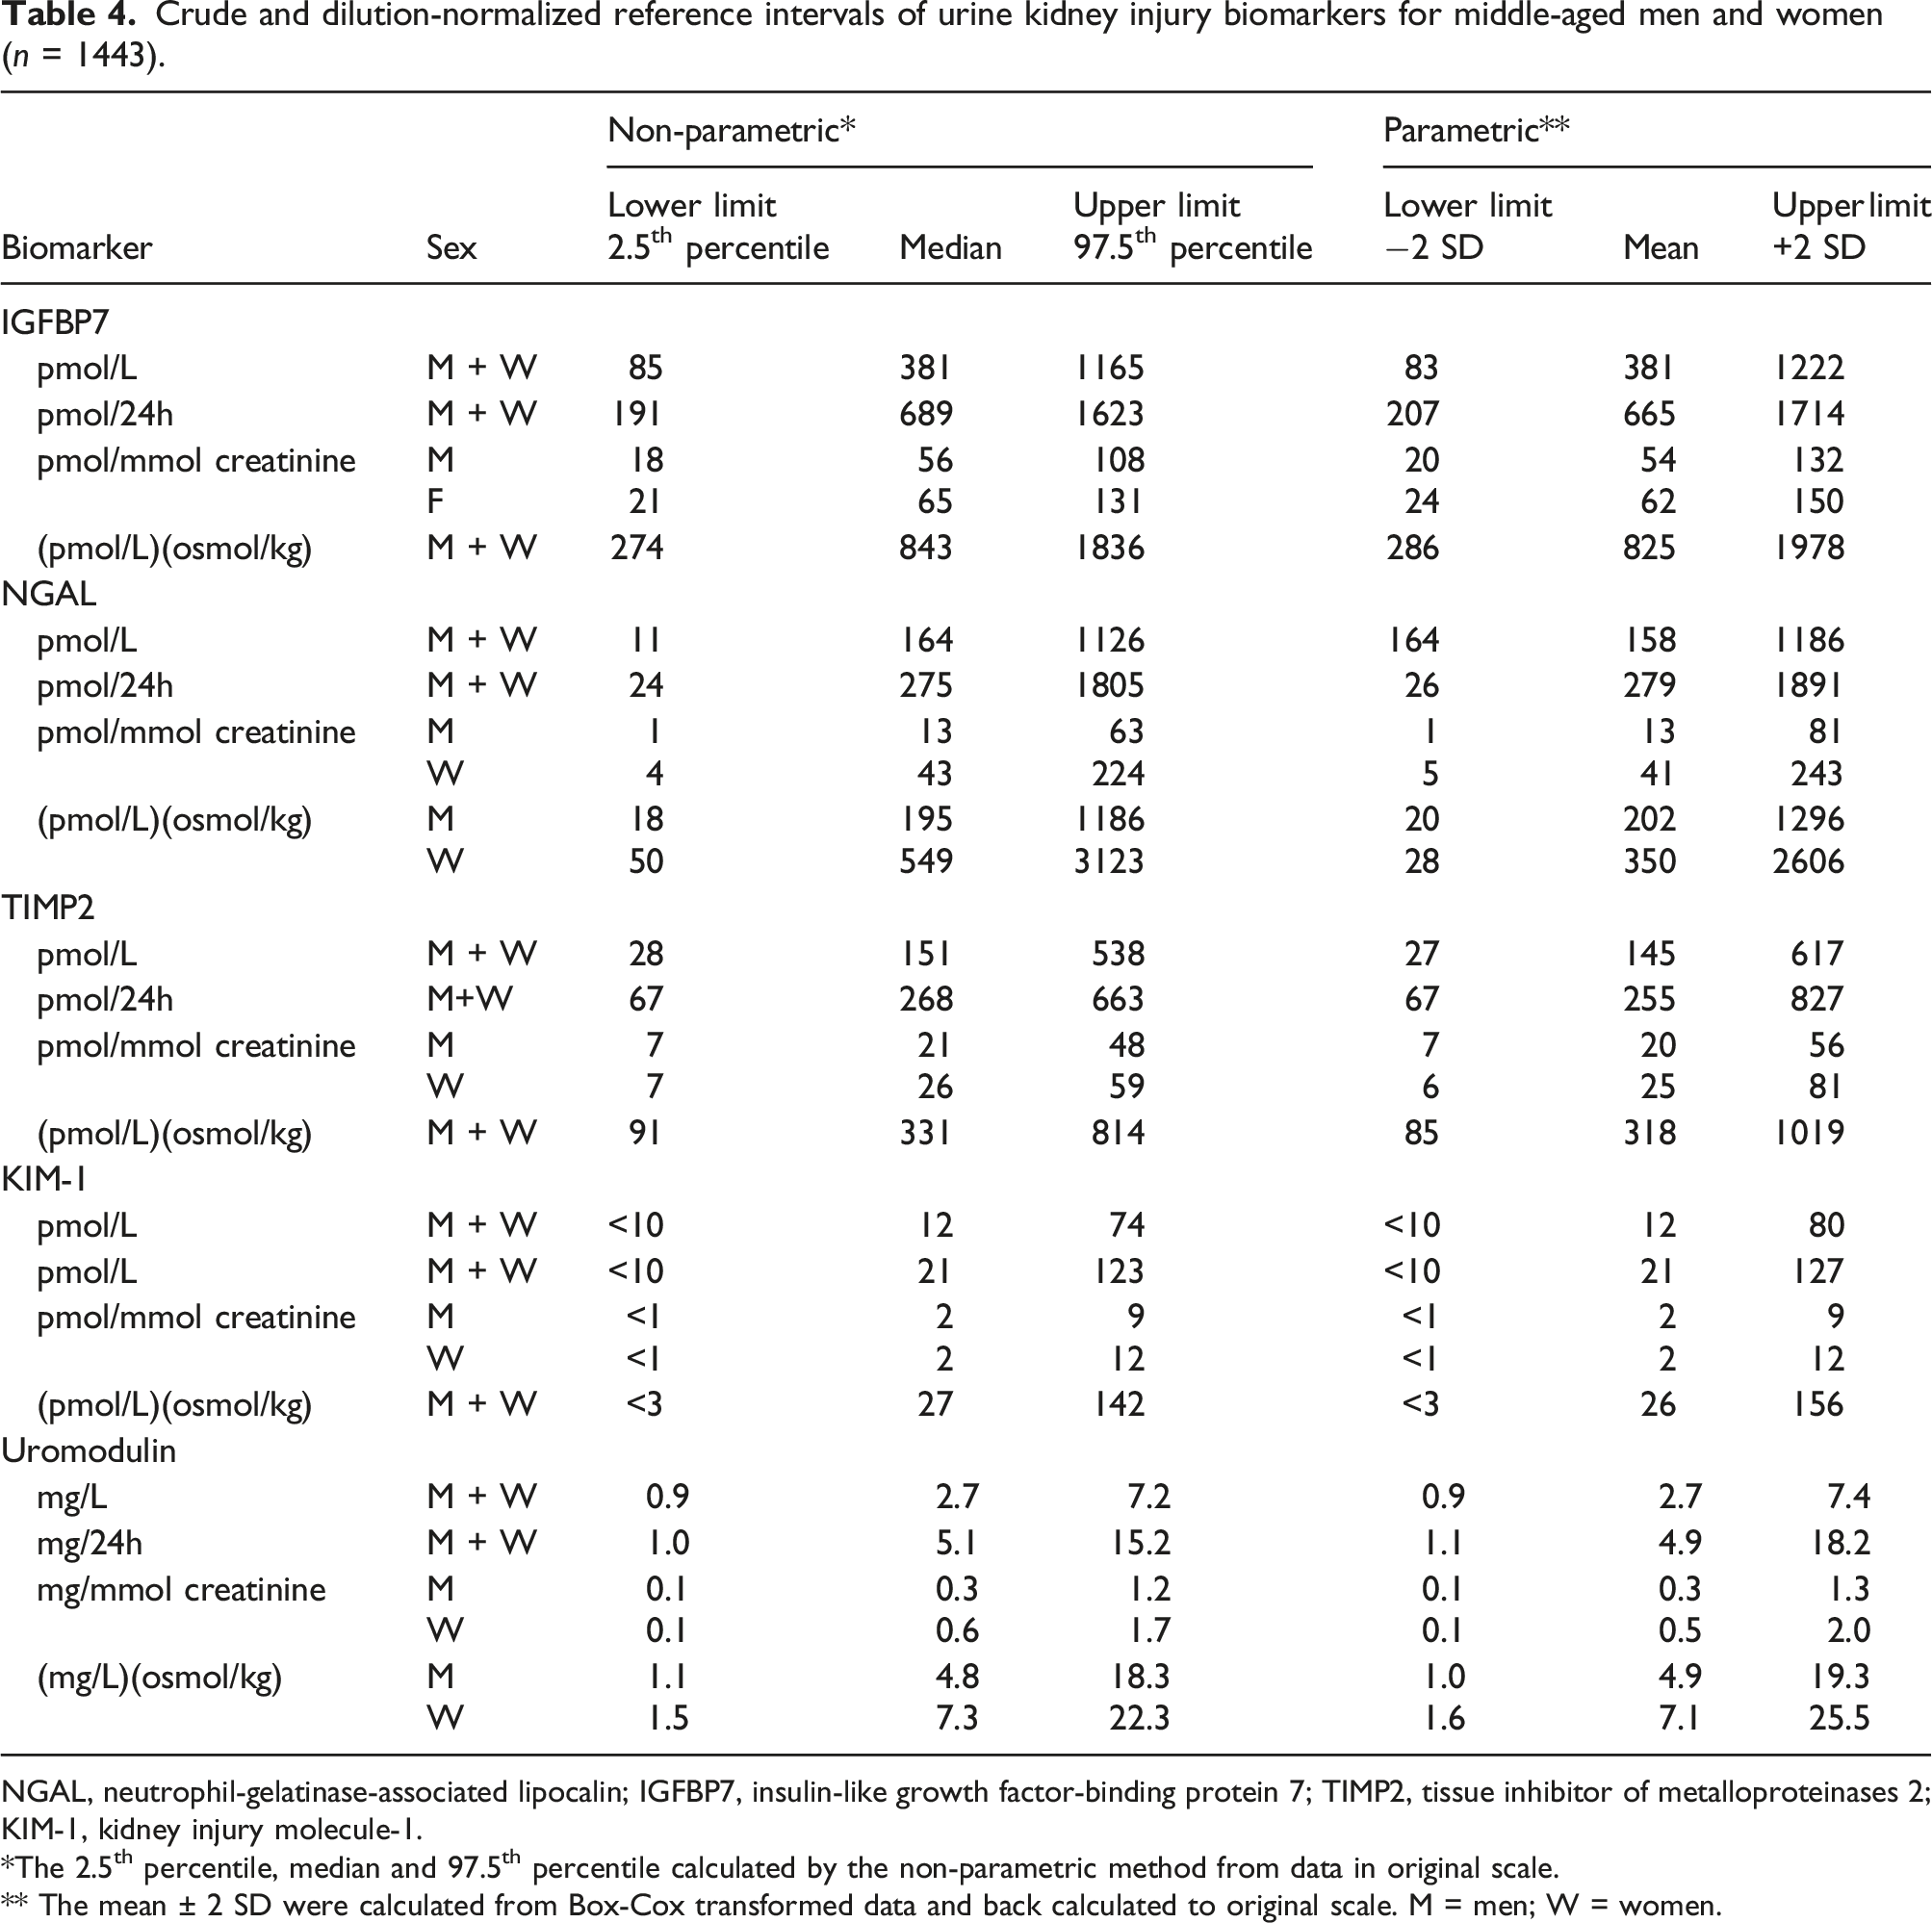
NGAL, neutrophil-gelatinase-associated lipocalin; IGFBP7, insulin-like growth factor-binding protein 7; TIMP2, tissue inhibitor of metalloproteinases 2; KIM-1, kidney injury molecule-1.
*The 2.5th percentile, median and 97.5th percentile calculated by the non-parametric method from data in original scale.
** The mean ± 2 SD were calculated from Box-Cox transformed data and back calculated to original scale. M = men; W = women.
In Table 4 crude, excreted amounts per 24 h and dilution normalized reference intervals are given. The reference intervals of creatinine-normalized biomarkers were stratified by sex, whereas unisex reference intervals were applicable to osmolality-normalized IGFBP7, TIMP2, and KIM-1. Since kidney injury biomarkers tend to increase in pathophysiological conditions, the upper limit (97.5th percentile) is considered clinically relevant for the early kidney injury biomarkers NGAL, KIM-1, TIMP2, and TIMP2. The lower limit (2.5th percentile) of tubular mass marker UMOD is hypothesized to be of clinical relevance.
Discussion
Crude and dilution-normalized urinary levels of kidney injury biomarkers and biomarker excretions per 24 h were determined in this study using a multiplex LC-MS/MS methodology. This multiplex approach enabled absolute concentration comparison, intercorrelation analysis and facilitated parallel biomarker evaluation. In the Dutch middle-aged population, tubular protein UMOD was relatively high abundant (median 2.7 mg/L), injury biomarkers NGAL, IGFBP7, TIMP2, and KIM-1 were present in picomolar to nanomolar concentrations, whereas chemokine CXCL9 and kidney-tissue specific proteins nephrin and SLC22A2 were below their limit of detection (<1 pmol/L). Urine creatinine and osmolality were intercorrelated (r = 0.90), and correlated (r = 0.69–0.73) to urine NGAL, IGFBP7, and TIMP2 concentrations. After dilution normalization, TIMP2, IGFBP7, NGAL, and KIM-1 correlated weakly (r = 0.13–0.41), whereas TP, B2M, and UMOD were positively correlated (r = 0.58–0.71).
In our study population, normalized intervals needed to be stratified by sex only. This effect of sex on kidney injury biomarker levels has been pointed out in former studies.9,10,21 For example, reference intervals of urinary kidney injury biomarkers KIM-1 and NGAL were previously stratified for sex and age groups of 10 years ranging from neonates to 80+ years. 10 This age-effect was not seen in our normalized biomarker data, but we acknowledge that our population covers a relatively small age span of 20 years. The reference interval of urinary NGAL (11–1126 pmol/L; 0.2–25.4 ng/mL) was lower in our study compared to a previous study reporting a central 95% reference interval of ±398–2187 pmol/L (<9.0–49.4 ng/mL). 9 Age and sex stratified reference intervals of urinary NGAL have also been proposed in another previous study, with upper limits ranging from ± 2.3 nmol/L (53.0 ng/mL) up to ±9.3 nmol/L (211.2 ng/mL), depending on age and sex. 10 The observed median concentration of KIM-1 (12 pmol/L, ±0.5 ng/mL) in this study is congruent with previous findings (12 pmol/L; 0.5 ng/mL).10,21 In our population, urinary UMOD concentrations were ± 10 fold lower than in a former study that reported a median ± SD of 26 mg/L (17.4–34.9 mg/L) in the general population. 22 These discrepancies in reference intervals with previous studies can be due to (1) the studied population, (2) differences in calibration strategies, and/or (3) variances in measurand composition introduced during the preanalytical phase, (co-)immunocapture or analytical measurement procedure.
The transferability of reference intervals among laboratories remains challenging due to differences in analytical methodologies and reporting units, lack of common calibrators and test standardization and use of different study populations. 20 Kidney injury biomarker concentrations are typically determined by in-house developed tests, research-use only enzyme-linked immune sorbent assays (ELISAs) or CE marked immunoassays for automated clinical chemistry analyzers. These analytical methodologies have assay- and platform-dependent calibration strategies and lack metrological traceability to higher order standards and methods.23,24 In this study, NGAL, IGFBP7, TIMP2, and KIM-1 were converted to molar units by an external calibration curve with spiked recombinant proteins and UMOD was value-assigned by a CE-marked immunoassay (both calibration strategies are not standardized to a higher-order reference material). The LC-MS/MS analytical platform correlated with immunoassay in the quantitation of NGAL, KIM-1, TIMP2, and IGFBP7, however, common calibrators are still lacking, resulting in limited transferability between methods. 25 Likewise, the NephroCheck Test® provides the product of TIMP2 and IGFBP7 concentrations, instead of protein concentrations in molar units. 11 As a consequence, The NephroCheck Test® results and reference intervals are not transferable to other analytical platforms. Test calibration to higher order reference materials and reference measurement procedures, and the establishment of an unbroken traceability chain with acceptable measurement uncertainty according to ISO 17511:2020 are needed to allow exchange of kidney injury biomarker results.26–28
To enable the interpretation of kidney injury biomarkers, it has been proposed to normalize urine concentrations by 24 h urine volume, urine creatinine, or osmolality.15,29 Expression of biomarkers per 24 h and urine creatinine are considered the default parameters for urinary analyte normalization within the field of clinical chemistry. Alternatively, urine osmolality may be used as parameter for normalization and is less affected by muscle mass and solid-food diet compared to creatinine.14,15,29-32 Nonetheless, hydration-driven dilution normalization by creatinine or osmolality relies on several assumptions that cannot always be met, such as stable creatinine production and a hemodynamic steady-state condition, especially in case of AKI development.33,34 The sex-differences in osmolality and 24 h urine volume were in agreement with earlier observations in which higher osmolality was found in men (mean 590 mOsmol/kg) than in women (mean 456 mOsmol/kg). 12 Noteworthy, we observed an inverse exponential relation between osmolality and creatinine with 24 h urine volume rather than a linear relation. Hence, normalization by dividing the biomarker concentration by creatinine or osmolality may be oversimplified
The population of this reference study was designed a priori and consisted of men and women of predominantly Caucasian ethnicity, representing the general middle-aged Dutch population. Kidney function in this population was considered normal, as indicated by conventional laboratory measures of glomerular filtration (CKD-EPI eGFR), tubular function (B2M) and glomerular permeability (total urinary protein). Kidney function in our population was in agreement with a previous study including non-diseased Caucasian individuals, reporting a mean (SD) eGFRs of 76 (13) was reported for men and 70 (12) for women in the age category of 55–59 years. 35 In our general population, hypertension and hypercholesterolemia were common comorbid conditions, with a prevalence of 34% and 13%, respectively. Nonetheless, kidney injury biomarker levels were not affected by the presence of these conditions. To take into account specific comorbid conditions in specific in-hospital populations, indirect sampling based on test results stored in laboratory information systems is an alternative approach to determine reference intervals. 36
There are certain limitations to the present study that are important to be acknowledged. First, the proteins calbindin, cubilin, and TGF-β1 were initially included in the biomarker panel, 1 but these proteins did not pass the analytical validation phase of the multiplex LC-MS/MS method. 2 Second, the urinary samples used for establishing reference intervals were stored at −80°C for up to 10 years prior to analysis and relies on biomarker stability data available. It has been shown that KIM-1 and NGAL concentrations decrease with <4% only after −80°C storage for 5 years. 37 In addition, urine sample storage at −80°C for 4 months did not affect the UMOD concentration. 38 To the best of our knowledge, the long-term stability of the other biomarkers, including TIMP2 and IGFBP7, remains to be studied. In addition, it was previously reported that short-term urine storage at 4–8°C or 25°C did affect the NGAL and KIM-1 concentrations and NephroCheck TIMP2*IGFBP7 results, which justifies the use of 24 h urine.23,39 Moreover, urine samples in this study were centrifuged and underwent two freeze-thaw cycles prior to analysis. The centrifugation of urine specimens prior to −80°C sample storage is unlikely to affect NGAL and KIM-1 levels, although this needs to be determined for LC-MS/MS analysis in particular. 39 The levels of UMOD have shown to be affected by the centrifugation procedure in a previous study. 38 The introduction of freeze-thaw cycles prior to biomarker analysis could result in underestimation of concentration levels. In a previous study, the concentration decrease after three consecutive freeze-thaw cycles in a previous study was <3%. 37 Likewise, we studied the effect of freeze-thaw cycles and centrifugation on biomarker recovery from urine determined by LC-MS/MS. Centrifugation (400g for 10 min, 3000g for 8 min vs no centrifugation), and up to 4 consecutive freeze-thaw cycles did not significantly affect the biomarker recovery, with the exception for TIMP2 with ±25% higher concentrations without centrifugation compared to centrifugation at 3000g for 8 min (Supplemental Figure 5). Finally, the reference intervals in this study were based on urine samples collected over 24 h, for capturing the intra-day concentration variability. The applicability of established reference intervals for other specimen types, such as fresh spot or catheter urine, and the timing of specimen collection suited to the intended use need to be evaluated in the future. In conclusion, we here present reference intervals for urinary NGAL, IGFBP7, TIMP2, KIM-1, and UMOD in middle-aged Dutch men and women. These reference intervals will enable the interpretation of kidney injury concentrations in patient populations and promote the translation of this panel of urinary biomarkers from research towards the medical laboratory to ultimately address the unmet clinical needs for kidney injury diagnosis and monitoring.
Supplemental Material
Supplemental Material - Reference intervals of urinary kidney injury biomarkers for middle-aged men and women determined by quantitative protein mass spectrometry
Supplemental Material for Reference intervals of urinary kidney injury biomarkers for middle-aged men and women determined by quantitative protein mass spectrometry by Tirsa T van Duijl, L. Renee. Ruhaak, Ellen K Hoogeveen, Renée de Mutsert, Frits Rosendaal, Saskia le Cessie, Johan W de Fijter, and Christa M Cobbaert in Annals of Clinical Biochemistry
Footnotes
Acknowledgement
We would like to express our sincere gratitude to all individuals and general practitioners for their participation in the NEO study. We would like to thank P.J. Noordijk and D. Kolle for their support in urine specimen processing, transport and storage. We would like to thank I. de Jonge for NEO data management and the Laboratory Research Support of the Clinical Chemistry and Laboratory Medicine department of the Leiden University Medical Center for laboratory analyses.
Declaration of conflicting interests
The author(s) declared no potential conflicts of interest with respect to the research, authorship, and/or publication of this article.
Funding
The author(s) disclosed receipt of the following financial support for the research, authorship, and/or publication of this article: The NEO study is supported by the participating Departments, the Division and the Board of Directors of the Leiden University Medical Centre, and by the Leiden University, Research Profile Area “Vascular and Regenerative Medicine.” In addition, Roche Diagnostics provided an independent research grant for kidney injury biomarker analysis by LC-MS/MS.
Ethical approval
The Medical Ethical Committee of the Leiden University Medical Center (LUMC) approved the design of the NEO study. All participants gave their written informed consent.
Guarantor
CMC.
Contributorship
C.M. Cobbaert and J.W. de Fijter conceived the approach and enable quantitative proteomics research, T.T. van Duijl performed the mass spectrometry analysis and statistical data analysis. R. de Mutsert, S. le Cessie, C.M. Cobbaert, and F. R. Rosendaal designed The Netherlands Epidemiology of Obesity study. T.T. van Duijl prepared the original manuscript draft; all authors were involved in reviewing and commenting on the manuscript.
Supplemental material
Supplemental material for this article is available online.
Correction (December 2022):
Article updated online to correct Figure 3. Image a and b have been inter-changed in the Figure.
References
Supplementary Material
Please find the following supplemental material available below.
For Open Access articles published under a Creative Commons License, all supplemental material carries the same license as the article it is associated with.
For non-Open Access articles published, all supplemental material carries a non-exclusive license, and permission requests for re-use of supplemental material or any part of supplemental material shall be sent directly to the copyright owner as specified in the copyright notice associated with the article.