
Abstract
Background
The widely automated method using indirect ion specific electrodes (ISE) potentiometry for determination of sodium concentration is prone to interference from lipaemia. Manufacturer-specified lipaemic (L)-index cut offs may underestimate the effects of endogenous lipaemia.
Methods
We assessed the interference on sodium concentration caused by endogenous lipaemia in 32 residual samples (from 13 patients) using indirect ISE (Cobas® 8000 modular analyser with c702 module, Roche diagnostics) and direct ISE (GEM 4000 premier, Werfen) potentiometric methods. Regression analysis (linear and non-linear) was used to determine a reliable (L)-index cut off for reporting sodium concentration.
Results
There was a poor correlation observed between triglyceride concentration and (L)-index. There was significant negative interference caused by endogenous lipaemia within analysed samples. Non-linear regression demonstrated a negative interference of approximately 5% at an (L)-index of 250.
Conclusion
At present, the manufacturer advises not to report sodium concentration by indirect ISE on the Cobas® 8000 modular analyser if the (L)-index is >2000. However, this has been determined by the addition of exogenous lipids (Intralipid®) and it is clear that this is not comparable to endogenous lipaemia. To ensure patient safety, clinical laboratories should consider lowering the cut off for (L)-index that they use for reporting sodium concentration.
Background
Automated measurement of electrolytes by ion specific electrode (ISE) potentiometry is one of the most commonly performed analytical tests in clinical chemistry laboratories. 1 ISEs can be utilised in either direct or indirect methods. The main difference between methods is the dilution of samples with indirect ISE, whereas direct methods measure the concentration in undiluted samples, that is, whole blood. Indirect ISEs are used by most automated laboratory biochemistry analysers, whereas direct ISEs are most utilised in point of care testing (POCT) devices, for example, blood gas analysis. 2 Sodium is the most abundant cation in extracellular fluid and contributes a significant proportion to osmolality. 3 Its measurement can be affected by pre-analytical errors including contamination from sample tube preservatives and anticoagulants during phlebotomy (e.g. sodium citrate, which falsely elevates sodium) and haemolysis (which falsely lowers sodium). 4
Disorders of sodium balance are the most common electrolyte disorders encountered in clinical practice. 5 Many cases are straightforward to manage, particularly if chronic, but a rapid fall in plasma sodium (more than 10 mmol/L in 24 h) can cause cerebral oedema. Rapidly rising sodium, which is sometimes due to iatrogenic overtreatment of hyponatraemia, can cause osmotic demyelination syndrome. 6 Both of these complications can result in death or long-term neurological injury. Therefore, accurate measurement and reporting of the sodium concentration is vital to monitor the rate of change and reduce the risk of serious adverse consequences in patients affected by these electrolyte problems.
In addition to pre-analytical interference, indirect ISE methods are subject to error from the ‘electrolyte exclusion’ or ‘volume displacement’ effect. 7 This can be caused by the presence of high concentrations of lipoproteins in a sample (lipaemia) and can result in a falsely lowered sodium concentration being reported (so-called ‘pseudohyponatremia’). Lipaemia leads to turbidity making measurement of various analytes (including sodium) difficult. After haemolysis, it is the most common endogenous interference. 8 The largest particles, chylomicrons, have the greatest potential to increase turbidity. 9
Various methods exist for assessing lipaemia in patient samples. Visual detection is possible, but very subjective. 10 Most analytical platforms utilise automatic detection and assessment of the degree of lipaemia generating a (L)-index. Some laboratories measure triglyceride concentration to assess lipaemia. However, manufacturers of assays often state that there is a poor correlation between lipaemic index and triglyceride concentration. The current manufacturer guidelines for the Cobas® 8000 modular analyser with c702 module (Roche Diagnostics) state that their assay has no significant interference up to an (L)-index of 2000. However, anecdotally in our laboratory, this does not always seem to be the case in practice. We aimed to assess the negative interference caused by lipaemia on the measurement of sodium by indirect ISE on the Roche Cobas® 8000 and determine a reliable (L)-index cut-off for reporting in patient samples.
Methods
Analyte measurement and sample collection
This study was carried out in the Clinical Biochemistry laboratory at the Royal Victoria Hospital, Belfast Health and Social Care Trust (BHSCT). Residual clinical samples with a range of (L)-indices were collected and stored at −80°C until a batched analysis could be performed. These samples were analysed by both automated indirect ISE method (Cobas® 8000 modular analyser with c702 module [Roche Diagnostics]) and by direct ISE on a Werfen blood gas analyser (GEM 4000 Premier).
Sample analysis
Thirty-two residual samples from 13 individual patients were collected. On the day of testing, all samples were thawed and mixed thoroughly. Sodium, triglycerides and (L)-index were measured on the Roche Cobas® 8000 (indirect ISE) and then sodium was again measured by direct ISE (Werfen® blood gas analyser). Furthermore, since the upper limit of measurement for the Roche Cobas® 8000 triglyceride assay is 50 mmol/L, samples with values above this were diluted (dilution factor 1:5) and repeat analysis was performed to obtain a ‘true’ triglyceride value. Results were collated and non-linear regression was performed on Microsoft Excel®. Ten samples which had sodium, triglyceride and L-index measured before and after freeze-thawing were analysed to ensure that this process would not have significant effect on analyte concentrations. We observed no significant effect of the freeze-thaw cycle on sodium or triglycerides but, of note, the (L)-index after a freeze-thaw cycle increased by approximately 70%. We therefore used pre-freezing (L)-index values for our subsequent analyses, as in clinical practice samples for electrolyte measurement are not usually frozen before analysis.
Results
Negative interference caused by endogenous lipaemia on determination of sodium concentration by indirect ISE
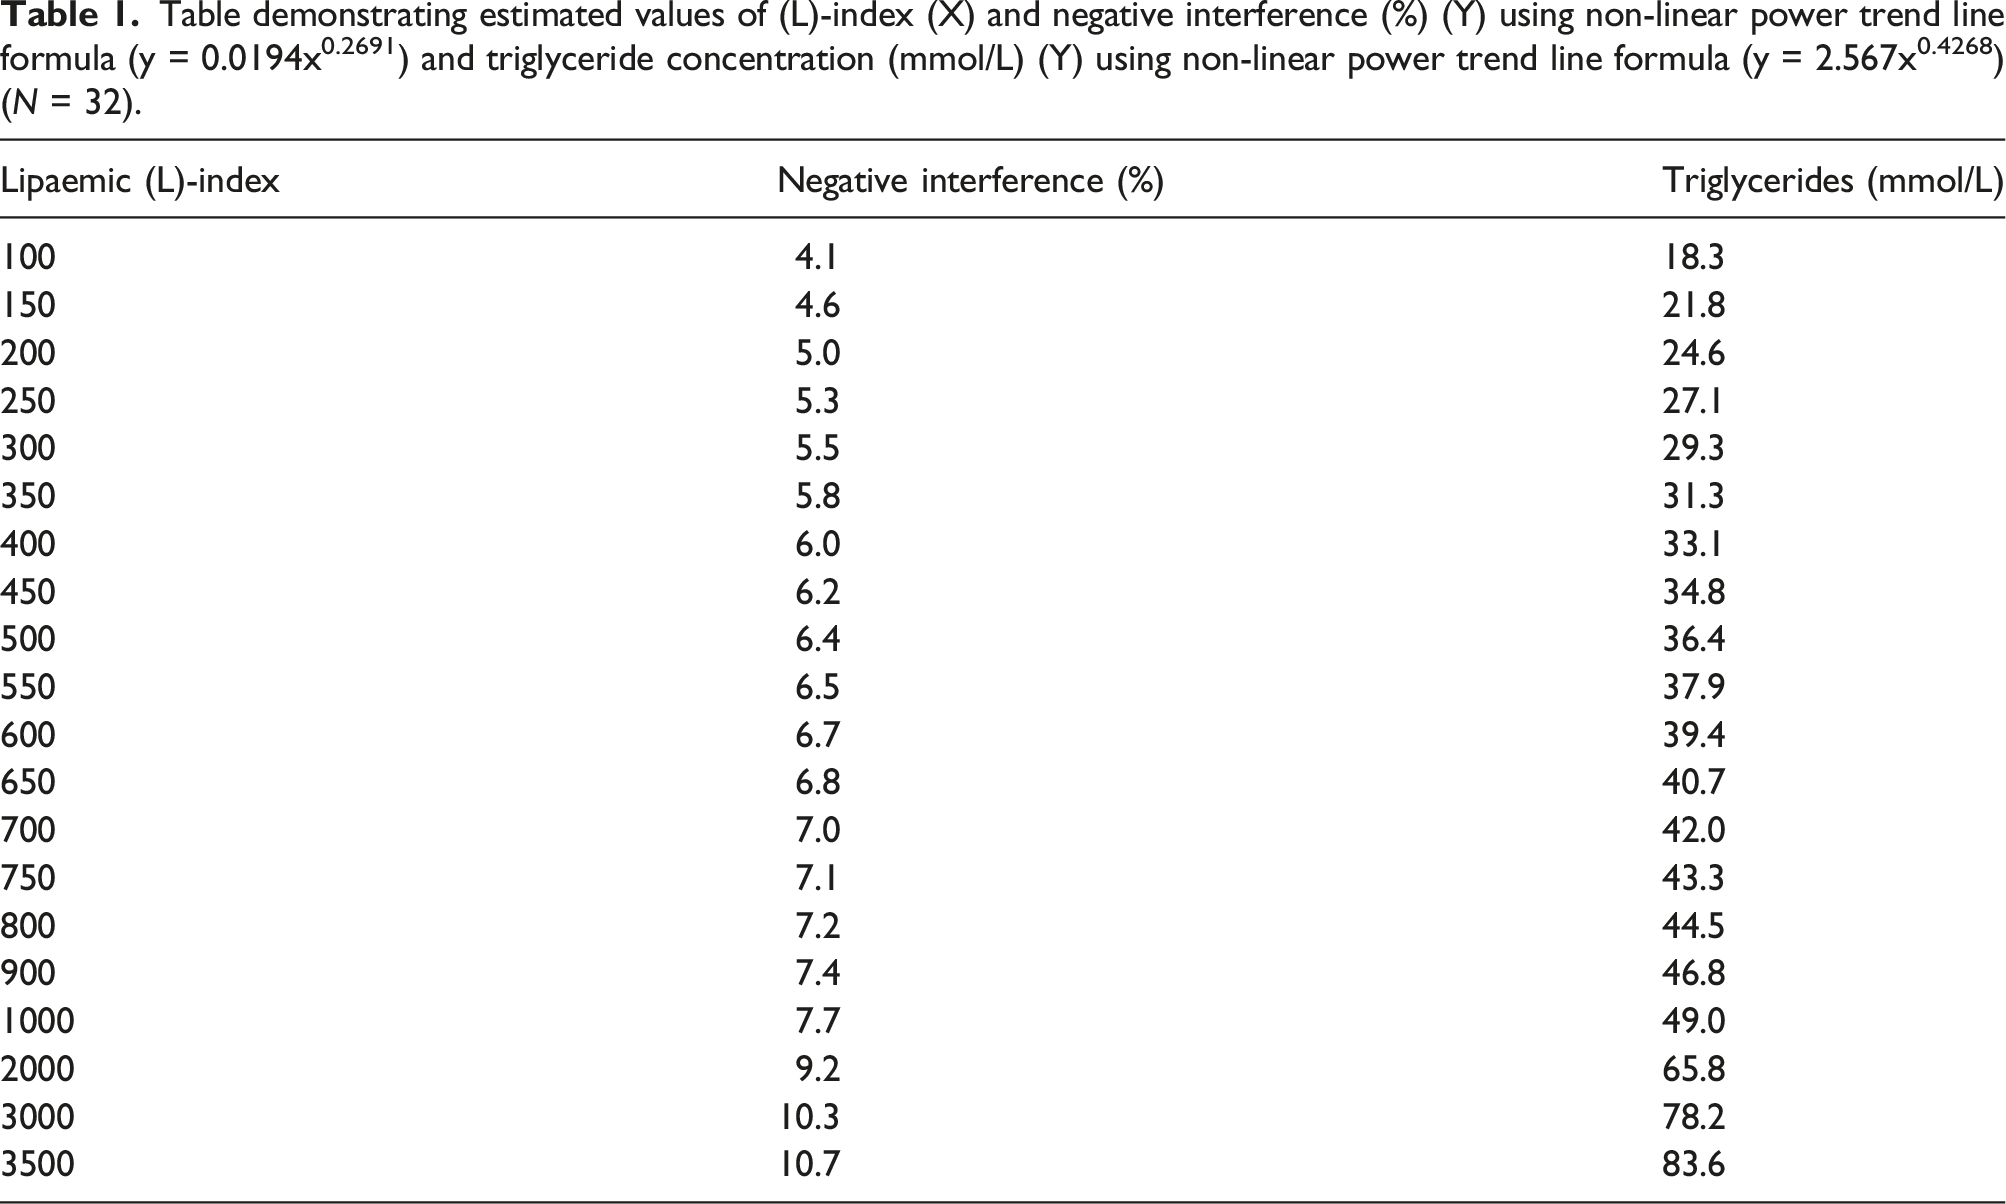
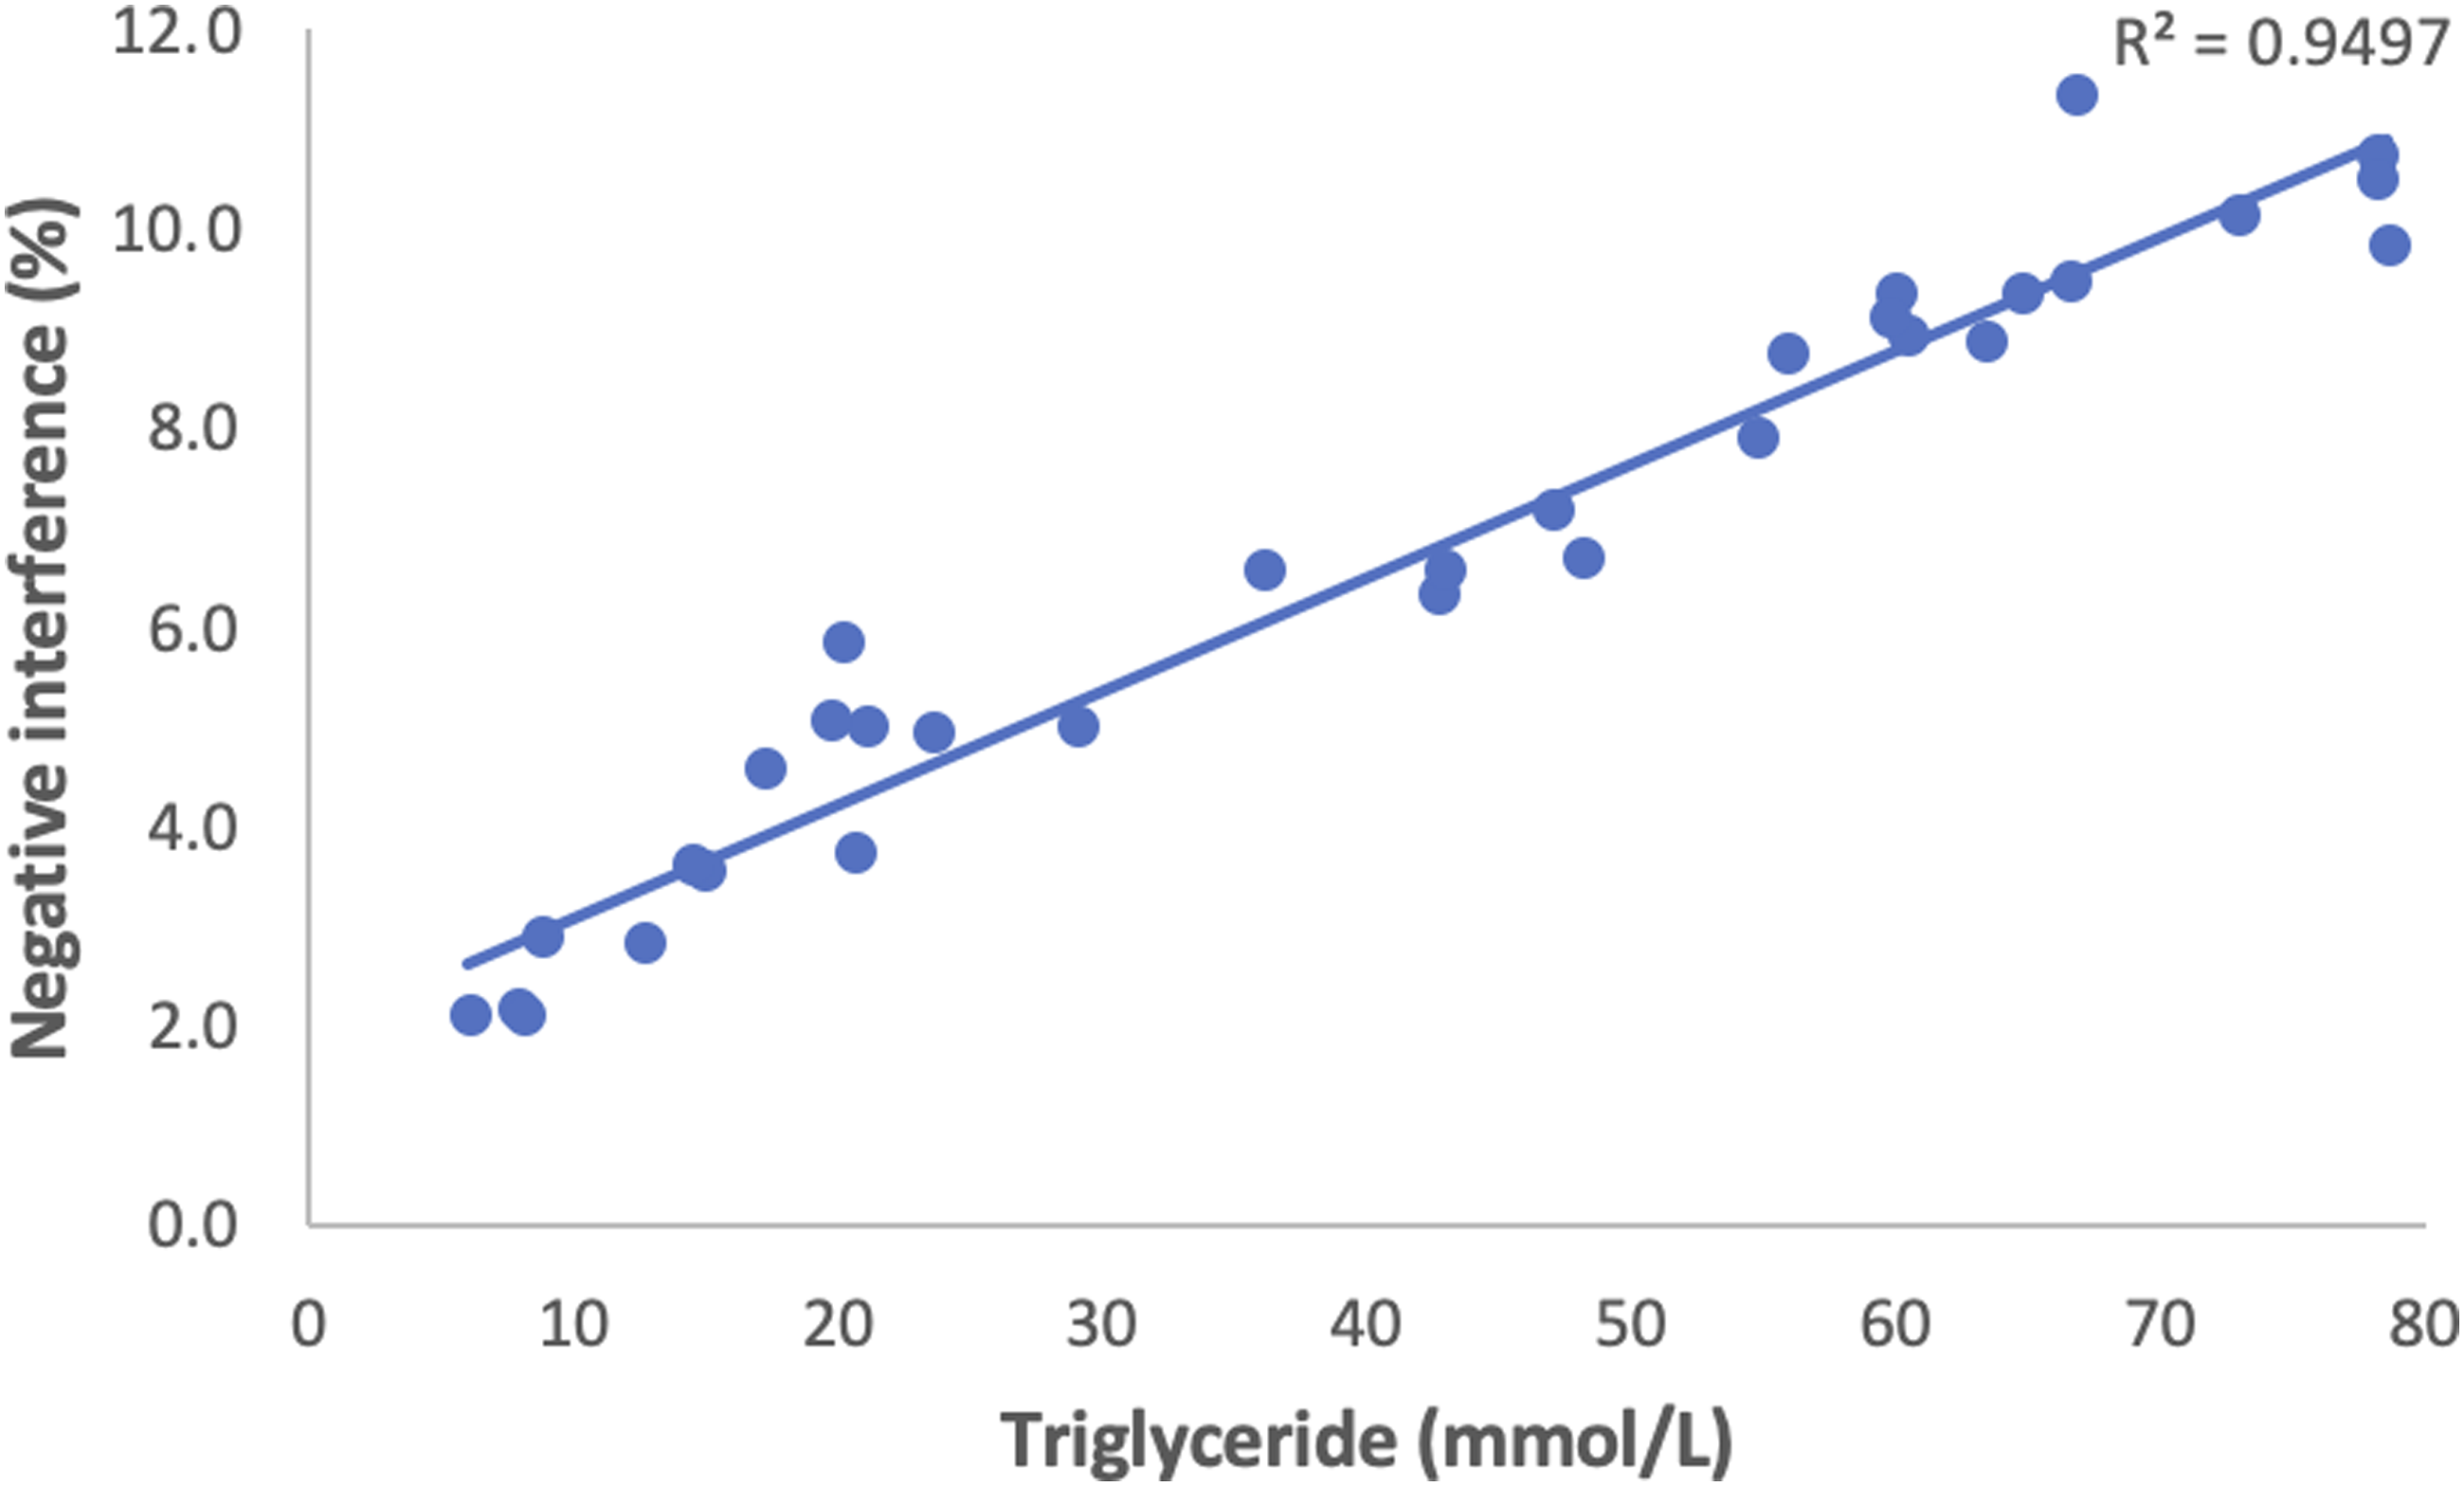
Within the 32 residual samples there was a range of (L)-indices (8–3402). Negative interference was calculated using the following equation: Negative interference (%) = ([Na] direct ISE- [Na] indirect ISE/[Na]direct ISE) x 100. There was significant scatter of results and a non-linear curve of best fit was applied with a coefficient of determination R2 = 0.713 (Figure 1). Non-linear regression was used to determine the % negative interference at various L-indices (Table 1). There was a range of triglyceride values (5.9–78.3 mmol/L). Triglyceride values were plotted against negative interference (%) and a linear curve of best fit was applied demonstrating a strong correlation with an R2 = 0.9497 (Figure 2). Scatter plot of (L)- index versus negative interference (%) (N = 32). Data is shown with non-linear power trend-line (coefficient of determination, R2 = 0.713). Table demonstrating estimated values of (L)-index (X) and negative interference (%) (Y) using non-linear power trend line formula (y = 0.0194x0.2691) and triglyceride concentration (mmol/L) (Y) using non-linear power trend line formula (y = 2.567x0.4268) (N = 32). Scatter plot of triglycerides (mmol/L) versus negative interference (%) (N = 32). Data is displayed with linear trendline (Coefficient of determination, R2 = 0.9497).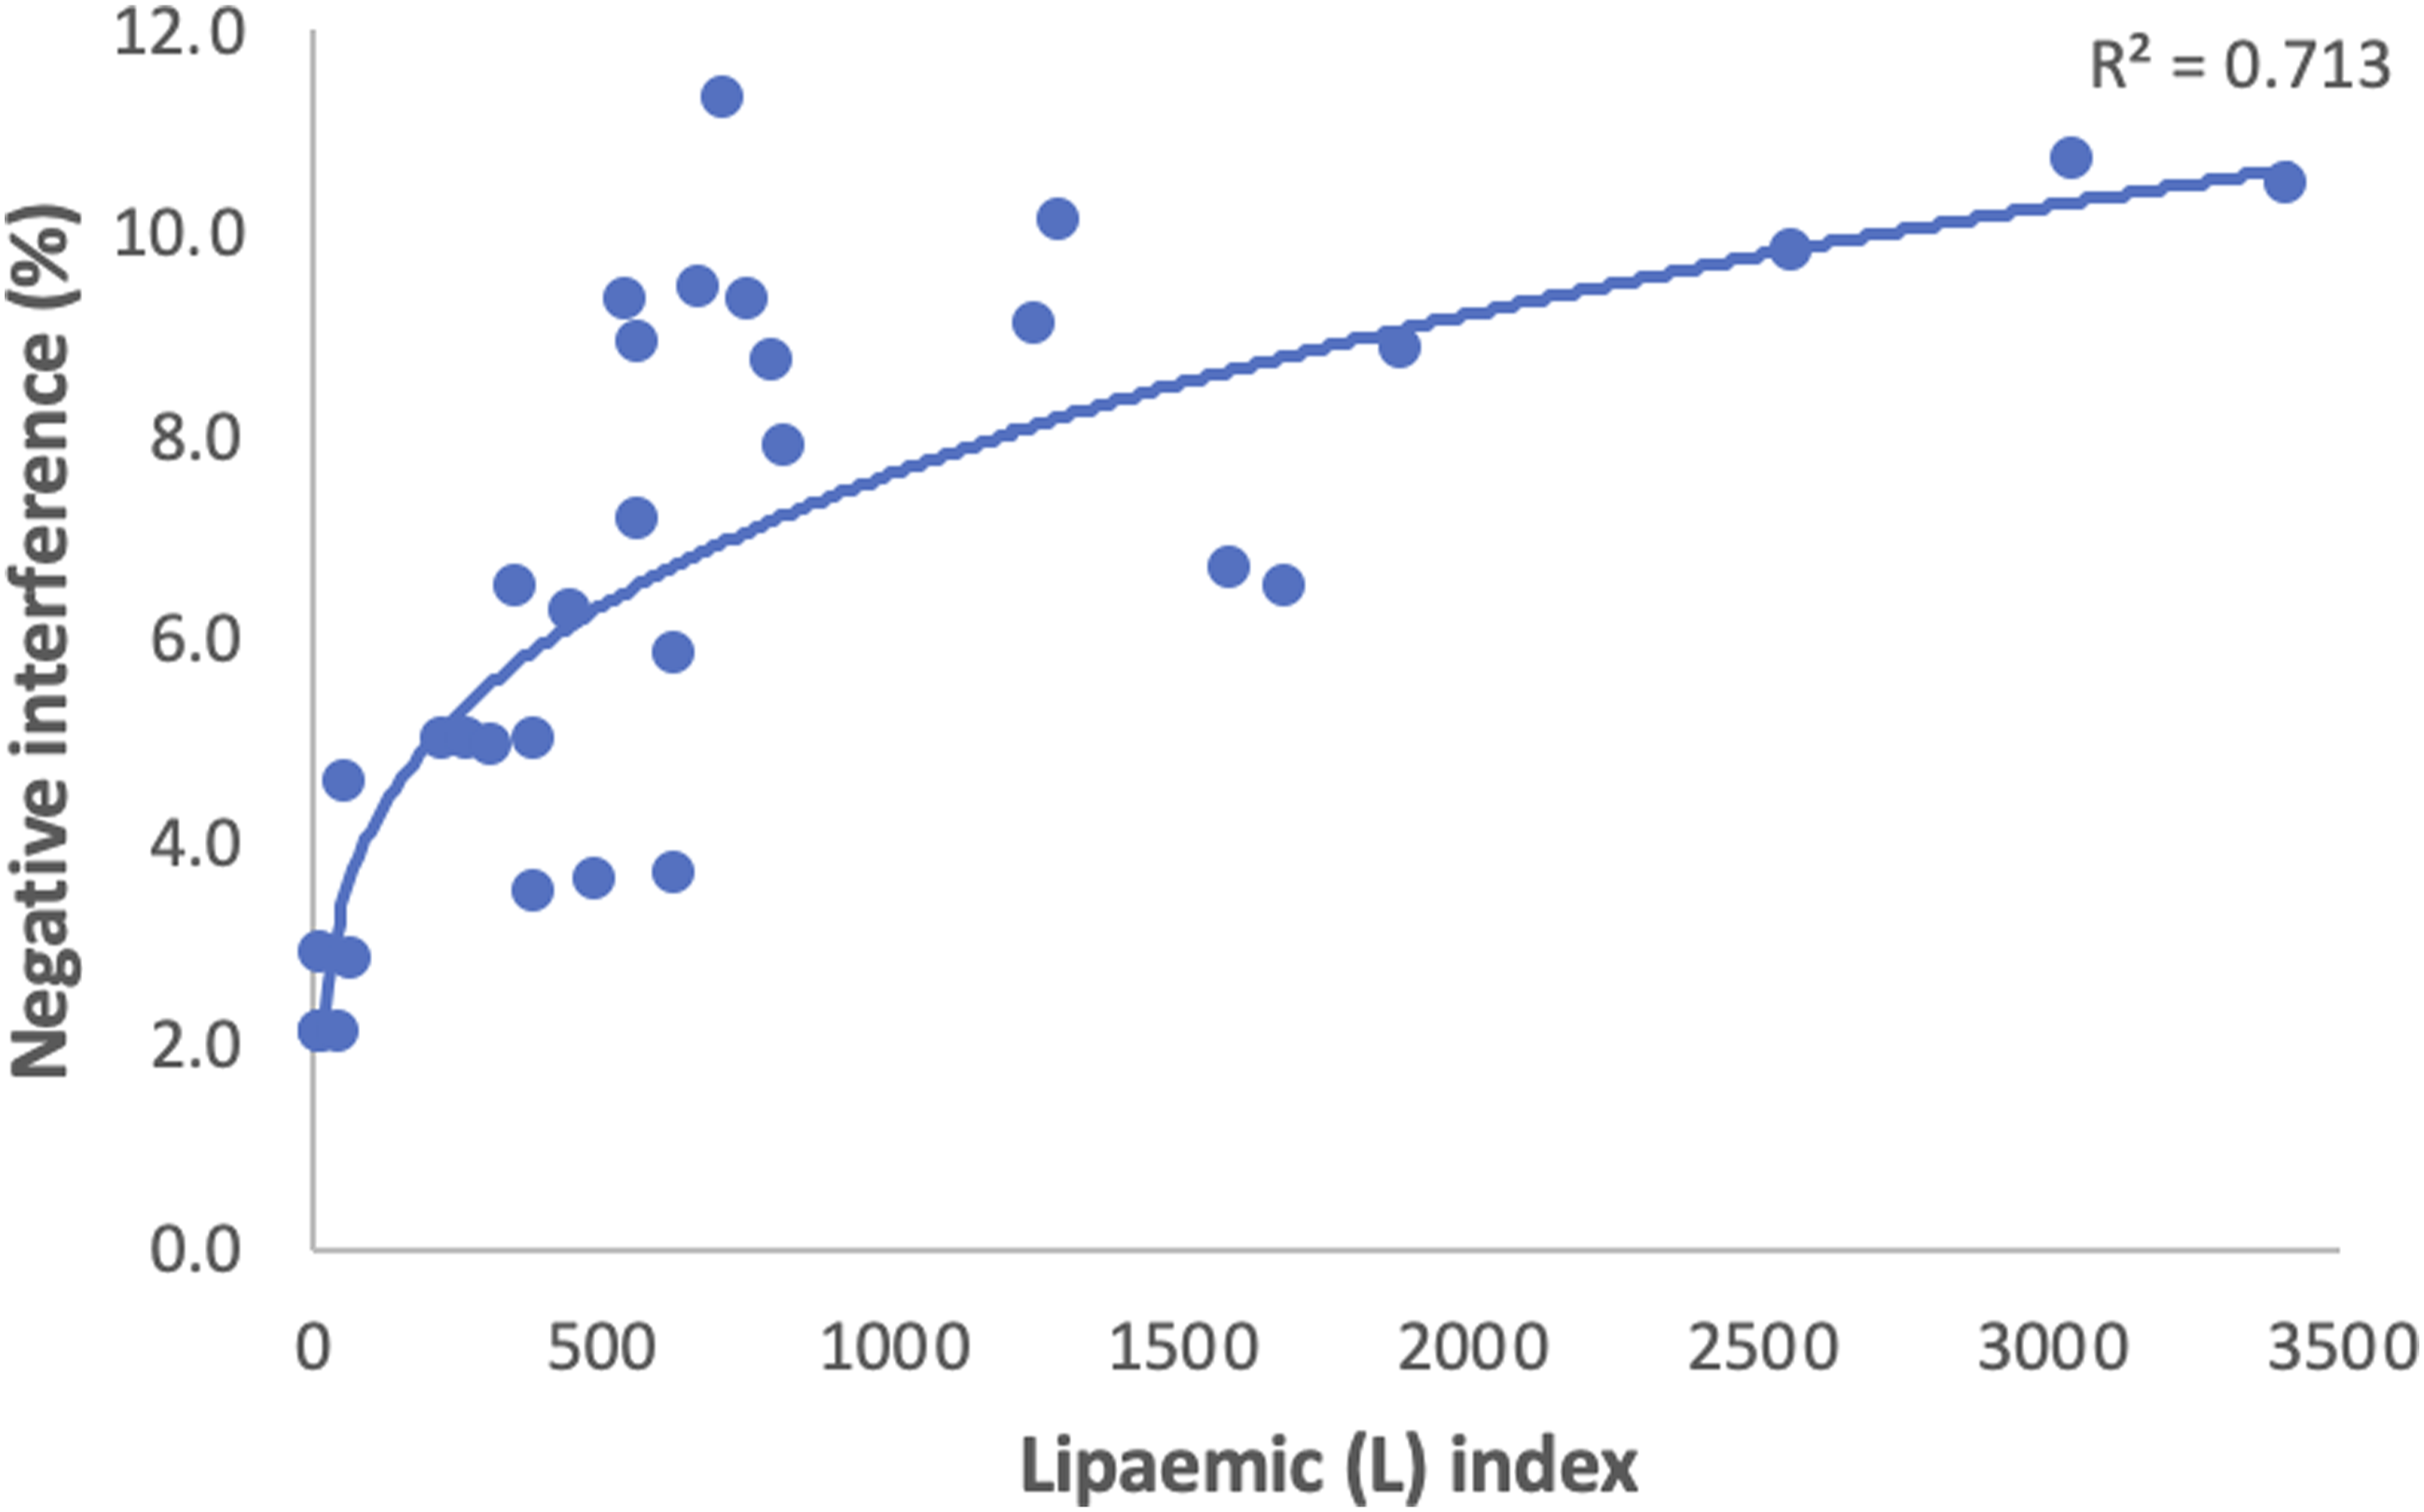
Correlation between lipaemic index and triglycerides
Within the samples, there was significant scatter of results and a poor non-linear correlation between (L)-index and triglycerides with a coefficient of determination R2 = 0.7462 (Figure 3). This is in keeping with the manufacturer’s information. Non-linear regression was used to determine the triglyceride concentration at various (L)-indices (see Table 1). Scatter plot of (L)-index versus triglycerides (mmol/L) (N = 32). Data is displayed with non-linear power trendline (Coefficient of determination, R2 = 0.7462).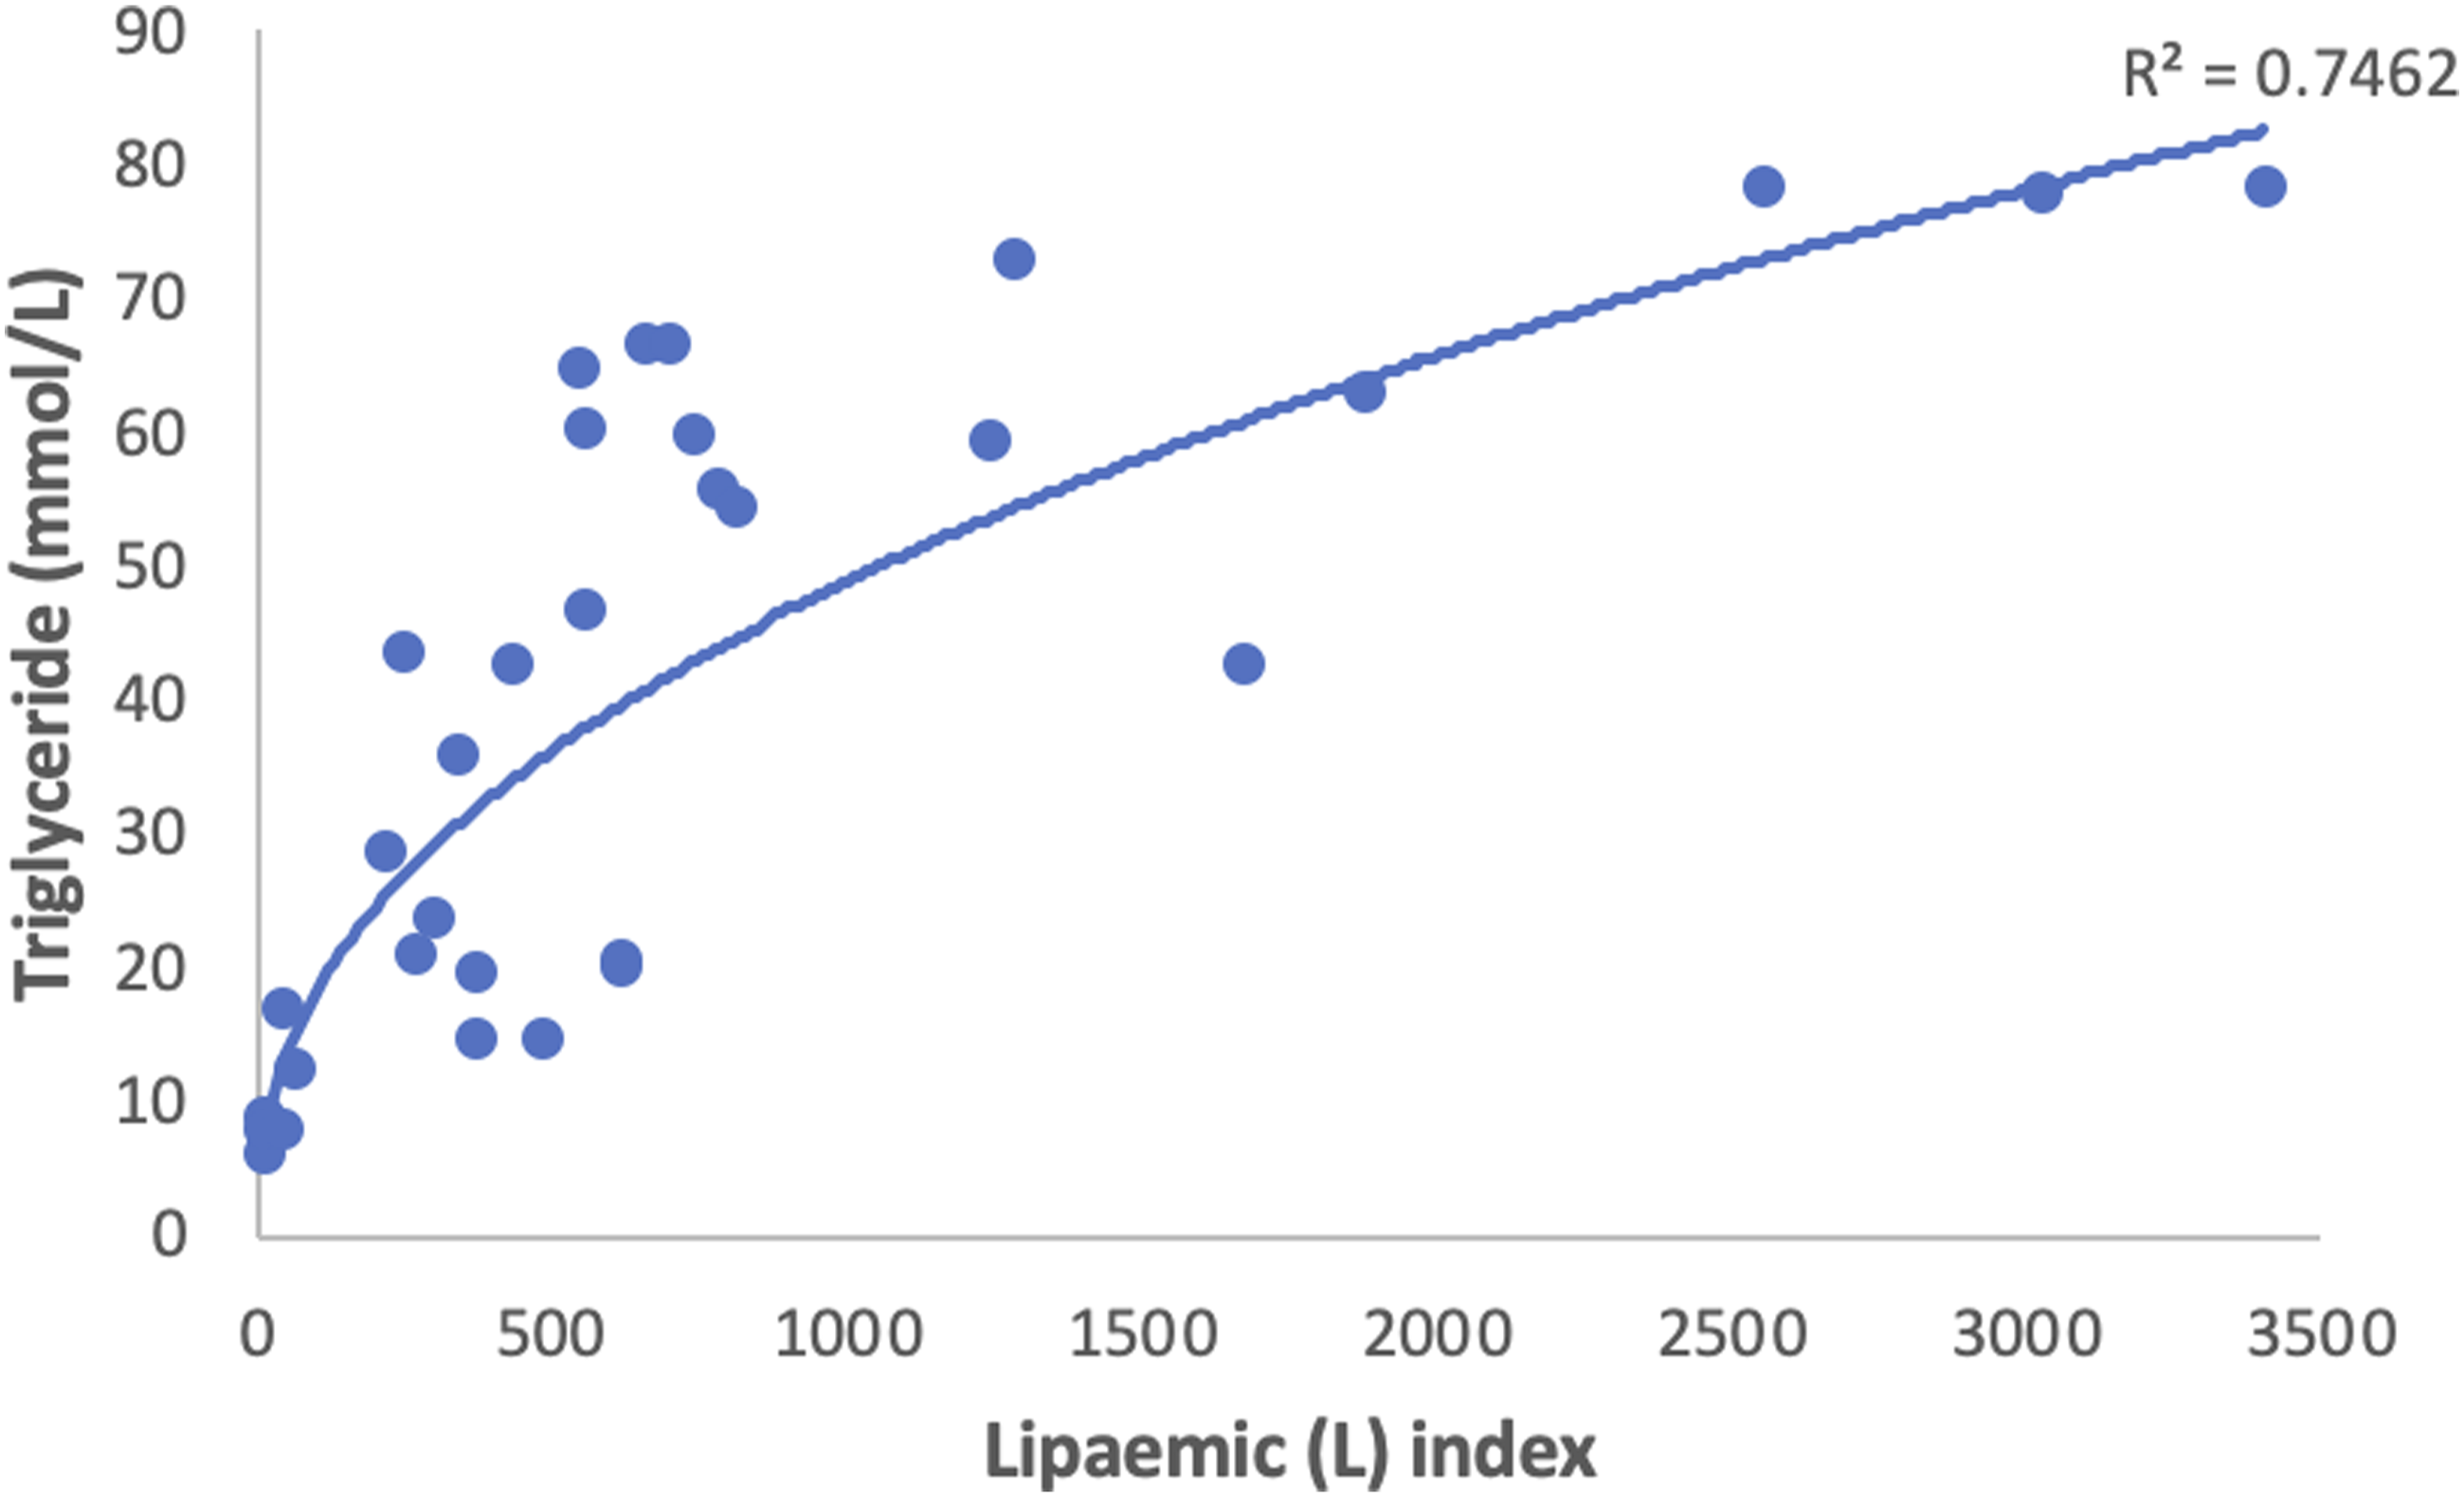
Discussion
Our laboratory currently uses the indirect ISE method of sodium measurement on the Cobas® 8000 modular analyser with c702 module (Roche Diagnostics). The manufacturer advises that there is no significant effect on sodium measurement up to an (L)-index of 2000, with the caveat that this is based on addition of exogenous lipids (Intralipid®) to samples. Intralipid® is a sterile, non-pyrogenic fat emulsion prepared for intravenous administration as a source of calories and essential fatty acids. 12 It is not biochemically or structurally comparable to human lipoproteins and a recently published study in the United States has shown that it does not replicate the effect of endogenous lipaemia on sodium measuremement. 13 This has been reinforced by our study in a different patient population. Our analysis of 32 residual clinical samples has shown that at an (L)-index of 2000, we would expect a typical negative interference of 9%, that is, 13 mmol/L at a true sodium of level 140 mmol/L. This is an unacceptably large error for such a critical analyte as serum sodium, and could have catastrophic consequences for patient management. Typical sodium assays have an average bias of <1%, according to the United Kingdom National External Quality Assessment Service (NEQAS) for Clinical Chemistry (Report Distribution 1114 [17.10.2021]), and a bias >1.5% should raise concern about laboratory performance.
The correlation between triglyceride concentration and negative interference was considerably stronger than (L)-index versus negative interference. However, all samples processed through our analyser have an (L)-index measured, whereas triglycerides are requested on only a small percentage. Any laboratory algorithm designed to prevent the reporting of pseudohyponatraemia therefore has to depend first and foremost on (L)-index. Reflexing samples for triglycerides when (L)-index is elevated is a possibility, but creates considerable extra work for laboratory staff and raises the question of responsibility for following up results not requested by the clinician. (Given the poor correlation between (L)-index and triglycerides, we would expect a wide range of results.) We therefore decided against introducing this policy in our laboratory. However, lipaemic samples are indicated as such by a comment on our reports, and this should enable clinical teams to take appropriate action.
Interference testing is a requirement of medical diagnostic companies. However, manufacturer’s data are not always applicable to ‘real-world’ laboratory practice. 14 Because the effect of the lipaemia produced is dependent on numerous laboratory conditions and the nature of lipaemia (i.e. endogenous or exogenous), it would be useful for all future manufacturer reports to document and describe accurately conditions and methods used in analyte determination and overcoming lipaemia. Whereas previously such samples could be treated by various manual methods (e.g. dialysis, deproteination 15 ), modern automated hospital-based laboratories are poorly equipped for such manipulations. There are several ways of removing excessive lipoproteins (ultracentrifugation, 16 extraction, 17 sample dilution, 18 ) depending on availability. Theoretically In most cases, lipaemia can be removed from the sample and measurement can be done without interferences, but utilising these methods presents a resource and equipment management issue to National Health Service (NHS) laboratories with high throughput and demand.
The poor correlation between (L)-index and triglyceride concentration observed in this study (Figure 3) is already well recognised. We speculated that the degree of interference might be related to the type of lipoprotein present, but even within an individual patient who provided multiple samples, correlation remained poor. (L)-index measures light scattering to approximate the interference caused by a higher concentration of lipoproteins. 11 It is interesting that the (L)-index increased so markedly after a freeze-thaw cycle, suggesting that during this process some change took place in lipoprotein structure which was not reversed simply by thawing and mixing. This has not been reported in the literature before. It is unlikely to have any implication for routine clinical work but may have implications for research projects, for example, where samples may be stored frozen before batch analysis.
Due to the very significant risk of reporting falsely low sodium results in lipaemic samples, we have now lowered our (L)-index cut off for the reporting of serum sodium to 250, for all relevant Cobas® 8000 modular analysers used for sodium analysis across the BHSCT. We have adopted a (L)-index cut off of 200 for paediatric samples (<16 years of age), where the risk of cerebral oedema is even higher. Sodium results obtained from samples where the measured (L)-index is greater than these cut-offs will not be reported. Instead, a comment will be appended redirecting users towards direct ISE devices if a sodium result is required. Even at this (L)-index cut-off, there is a typical negative interference of 5%, which could also adversely affect patient management. Ideally the (L)-index cut off should be lowered further, if feasible, and this is something that we will continue to review.
In summary, the currently recommended (L)-index cut-off for the reporting of serum sodium is highly inappropriate for real-life clinical samples, with consequent risk to patient safety. Clinical laboratories using this or similar methods should consider implementation of a lower (L)-index cut-off for sodium reporting, with reflex measurement of sodium using a direct ISE method instead in lipaemic samples.
Footnotes
Acknowledgements
Lynsey Reilly, Emma Reilly, Rory Loughlin.
Declaration of conflicting interests
The author(s) declared no potential conflicts of interest with respect to the research, authorship, and/or publication of this article.
Funding
The author(s) received no financial support for the research, authorship, and/or publication of this article.
Ethical approval
Not applicable.
Guarantor
EPM.
Contributorship
Contributorship: All authors have had access to the data and have reviewed and approved the final manuscript.