
Abstract
Clinical laboratories frequently encounter samples showing significant haemolysis, icterus or lipaemia. Technical advances, utilizing spectrophotometric measurements on automated chemistry analysers, allow rapid and accurate identification of such samples. However, accurate quantification of haemolysis, icterus and lipaemia interference is of limited value if laboratories do not set rational alert limits, based on sound interference testing experiments. Furthermore, in the context of increasing consolidation of laboratories and the formation of laboratory networks, there is an increasing requirement for harmonization of the handling of haemolysis, icterus and lipaemia-affected samples across different analytical platforms. Harmonization may be best achieved by considering both the analytical aspects of index measurement and the possible variations in the effects of haemolysis, icterus and lipaemia interferences on assays from different manufacturers. Initial verification studies, followed up with ongoing quality control testing, can help a laboratory ensure the accuracy of haemolysis, icterus and lipaemia index results, as well as assist in managing any biases in index results from analysers from different manufacturers. Similarities, and variations, in the effect of haemolysis, icterus and lipaemia interference in assays from different manufacturers can often be predicted from the mechanism of interference. Nevertheless, interference testing is required to confirm expected similarities or to quantify differences. It is important that laboratories are familiar with a number of interference testing protocols and the particular strengths and weaknesses of each. A rigorous approach to all aspects of haemolysis, icterus and lipaemia interference testing allows the analytical progress in index measurement to be translated into improved patient care.
Introduction
Interference with biochemistry assays due to haemolysis, icterus or lipaemia (HIL) is a common problem in clinical laboratory practice. Traditionally, the identification and quantification of HIL interference has been performed by visually inspecting for changes in the colour and/or clarity of serum or plasma. Any redness, yellowness or turbidity was subjectively classified into a semi-quantitative grade or HIL ‘index’. However, the manufacturers of modern biochemistry analysers have developed instruments that are able to objectively quantify haemoglobin, bilirubin and turbidity in serum or plasma samples by the use of multiple spectrophotometric measurements. Modern analysers are therefore able to identify HIL interference much more accurately than the traditional approach. 1
Both commercial assay manufacturers and clinical laboratories have been slow to update their handling of HIL interference to take advantage of this technical improvement. Indeed, some instrument manufacturers have their instruments report semi-quantitative HIL index results to accommodate laboratory scientists who are comfortable with this traditional style of reporting. Additionally, the acceptability criterion used by manufacturers to decide the level at which an assay shows significant interference is often a traditional generic value (frequently ± 10%) rather than the more rational analyte-specific approach advised by the Clinical and Laboratory Standards Institute (CLSI). 2 Generally, manufacturers will routinely only provide limited information regarding the details of the experimental design and results used to establish the recommendations regarding HIL interference with their assays. Therefore, a laboratory may have some difficulty in judging the quality of the information provided by the manufacturer or deriving its own conclusions from the manufacturer’s data, for instance, by applying a different acceptability criterion.
Clinical laboratories, too, have been slow to update their management of HIL interference. It is uncommon for laboratories to perform their own interference testing, and the manufacturers’ recommendations for interference alert limits are adopted by 95% of laboratories. 3 Laboratories, individually or as networks, are frequently using biochemistry analysers from different manufacturers. In this context, the indiscriminate adoption of manufacturers’ recommendations precludes a rational, harmonized approach to HIL interference. By modernizing their approach to HIL interference and placing a greater emphasis on the HIL indices as analytical results in themselves, laboratory managers will be able to identify interference more accurately and harmonize the handling of HIL-affected samples across a laboratory.
Haemolysis
Haemolysis has been traditionally considered the most common pre-analytical error affecting biochemistry results. 4 Recent data, however, suggest that modern sample collection, transport and processing procedures have made haemolysis a less frequent issue in routine practice. Analysis of data from 75 laboratories during 2013 found a median rate of haemolysed samples of 0.44%, with a 25th percentile of 0.12% and a 75th percentile of 0.85%. 5 The incidence with which laboratories receive haemolysed samples can vary markedly depending on where and how their samples are collected. For instance, haemolysis in samples received from emergency departments has been reported to be as high as 31%. 6 While such data focus on venous samples, other sample types may also be affected by haemolysis at a significant rate. For example, 4% of arterial blood gas samples in a tertiary referral hospital showed significant haemolysis. 7
Haemolysis results from disruption of the membranes of red blood cells (RBCs). RBCs are robust cells, able to withstand significant deformational stresses in the microcirculation; however, they are more sensitive to tangential stress. 8 Shearing forces beyond 300 Pa cause lysis of normal RBCs. 9 In certain patients, this threshold may be lowered. Increased mechanical fragility of red cells has been described in diabetes, multiple sclerosis, as well as in postmenopausal women.10–12
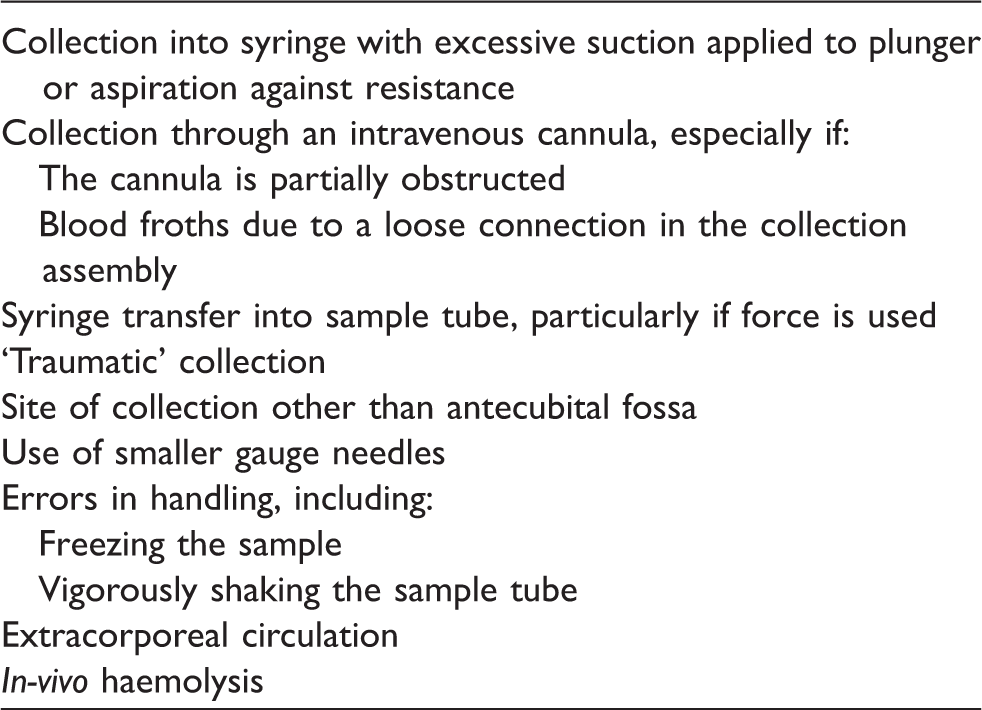
A number of factors related to sample collection have been reported to be associated with haemolysis, but may not be causative. For instance, increased rates of haemolysis have been observed in clinical specimens when the tourniquet compression time was prolonged. 21 However, under experimental conditions, when tourniquet application time is varied during multiple collections in individual patients, no such effect is seen. 22 Factors such as tourniquet application time may correlate with difficulty of venesection, where turbulent blood flow is more likely.
Haemolysis may interfere with biochemistry results through a number of mechanisms. These may be broadly categorized into factors that change the concentration of the analyte in the sample and those that interfere with analyte measurement. The release of the RBCs’ intracellular contents will increase the concentrations of analytes present in high concentrations within the cells (such as potassium, aspartate aminotransferase (AST) and lactate dehydrogenase) and decrease the concentrations of analytes present in low concentrations within the cells. For the latter effect to be clinically significant, the analyte must also be controlled within tight physiological limits. Sodium and chloride are examples of analytes affected in this manner. 23 The release of haemoglobin, or other intracellular components, may also cause degradation of the analyte in the sample. Bilirubin is degraded via the pseudoperoxidase activity of haemoglobin, while intracellular proteases may break down insulin and troponin T.24–26
Haemolysis may interfere with analyte measurement via diverse mechanisms. Oxygenated and deoxygenated haemoglobin have slightly different absorbance spectra but show maximal absorbance around 415 nm, with significant absorbance between 320 and 450 nm and 540 and 580 nm. 27 Colorimetric assays that use absorbance measurements in one or more of these ranges are therefore susceptible to interference. Examples include iron, lipase, albumin and γ-glutamyl transferase.23,28 Alkaline phosphatase assays are susceptible to negative interference because alkali denaturation of haemoglobin may cause a negative offset in absorbance readings. 29 Haemolysis may also cause the release of enzymes that participate in analytical reactions; for instance, adenylate cyclase causes a positive interference with creatine kinase assays. 30 It is possible that multiple mechanisms may influence particular results in haemolysed samples, especially when the haemolysis is marked.
Icterus
Icterus refers to the yellow colour resulting from increased sample bilirubin concentration. 2 Raised bilirubin concentrations most frequently result from liver disease; however, some assays may be sensitive to the relatively mild hyperbilirubinaemia that occurs in the context of Gilbert’s syndrome or in vivo haemolysis. Icterus exerts effects on chemistry tests primarily through spectrophotometric and chemical interferences. Bilirubin absorbs light between 400 and 540 nm, with a peak around 460 nm.31,32 Colorimetric assays taking primary or secondary absorbance measurements at these wavelengths may be affected, such as phosphate and Jaffe creatinine assays.33,34 In Jaffe creatinine assays, the formation of the coloured creatinine-picrate complex is measured by absorbance readings taken around 500 nm. Under the alkaline conditions of the reaction, bilirubin is oxidized to biliverdin, which causes negative interference by decreasing absorbance of the sample at 500 nm. A number of strategies have been used to minimize this interference. Potassium ferricyanide may be added to oxidize the bilirubin to biliverdin prior to initiating the Jaffe reaction. 35 Another strategy is so-called ‘rate-blanking’, where the measured rate of colour change in the sample after addition of sodium hydroxide is used as a correction factor. 36
Bilirubin’s antioxidant properties gives it the ability to react with hydrogen peroxide, 37 which is an additional mechanism of icteric interference. Hydrogen peroxide is an intermediate in some common chemistry assays (including cholesterol, triglycerides, uric acid and enzymatic creatinine), which are therefore susceptible to icteric interference.34,38 Assays may employ a high-efficiency hydrogen peroxide acceptor and/or ferrocyanide to try to minimize this interference. 34
The unconjugated and conjugated forms of bilirubin may exert different effects on certain assays. Conjugated bilirubin has been found to cause the greater degree of interference with most assays. 39 However, this is not always the case; indeed, in some instances, the unconjugated and conjugated forms of bilirubin have been shown to cause interference in opposite directions. The Abbott Aeroset and Roche Modular triglyceride assays have demonstrated positive interference by unconjugated bilirubin and negative interference by conjugated bilirubin. 39
Lipaemia
Lipaemia refers to the sample turbidity resulting from the light scattering effect of a high concentration of lipoprotein particles. The size of the particles in solution is a major factor determining the extent of light scatter. Being the largest lipoprotein particles, with diameters up to 1000 nm, the accumulation of chylomicrons is the primary cause of lipaemia; however, the large (60–200 nm diameter) and intermediate (35–60 nm diameter) subclasses of VLDL may also contribute to sample turbidity. 40 The most common cause of lipaemia is a recent fatty meal. 41 Lipaemia may also be produced by high alcohol intake, diabetes mellitus, renal impairment, total parenteral nutrition, certain medications and hereditary conditions. 42 Lipaemia has been reported to be the most common interferent in outpatient populations, occurring in up to 7.4% of samples. 43 Clinical laboratories may encounter an increasing incidence of lipaemic samples resulting from greater use of non-fasting collections. For instance, some newer guidelines for cardiovascular disease risk assessment now permit the use of non-fasting lipid measurements, while the acceptance of HbA1c for diabetes diagnosis may decrease the use of fasting glucose measurements.44,45
Lipaemia can cause interference in biochemistry results through a variety of mechanisms. Light scattering, differential partitioning of analyte between the polar and aqueous phases of the sample, and interaction of the lipoprotein particles with assay reagents may all cause interference in results. Lipaemia causes light scattering across the visual spectrum (300 to 700 nm) and consequently exerts profound effects on turbidimetric and nephelometric assays. The scattering of light shows no specific peaks, but it does increase as the wavelength decreases. Colorimetric assays taking absorbance readings at the shorter wavelengths of the visual spectrum are therefore most susceptible to interference. As a result, assays that utilize changes in NAD(P)H concentration, which is measured around 340 nm, are susceptible to lipaemia interference.
The presence of lipoprotein particles with large lipid cores may cause interference because of differential partitioning of analytes between the polar and non-polar phases of the sample. Pseudohyponatraemia is a well-recognized effect resulting from sodium remaining in the aqueous phase of the sample. If the sample is diluted prior to analysis, as in indirect ion-selective electrode and flame photometry methods, an assumption is made regarding the proportion of the sample that is aqueous. This assumption does not hold for lipaemic samples, and the consequence is falsely low results. Chloride and potassium results are affected by the same mechanism. 46 Differential partitioning may also cause erroneous results because of the tendency for chylomicrons to settle to the top of a sample that is left to stand. The chylomicrons will carry with them polar analytes, such as steroid hormones and hydrophobic drugs. The results of testing such samples will vary depending on the level of the tube from which the analyser aspirates (normally near the top of the tube). 41 In addition, there is potential for lipoprotein particles to cause interference by adsorbing hydrophobic reagents or reaction products or by non-specific interference with antigen–antibody binding in immunoassays.47,48
Measurement of the serum indices
All current automated chemistry analysers use the same principle for HIL index measurements. Multiple spectrophotometric absorbance readings are taken, generally after dilution of the sample. In the simplest approach, three bichromatic absorbance measurements are taken. Because of their spectral overlap, correction calculations are required to account for the contribution of multiple HIL parameters to absorbance at some wavelengths. Figure 1 shows the absorbance spectra of haemoglobin, bilirubin and lipaemia. Lipaemia can generally be measured without overlap from haemoglobin or bilirubin by taking a primary wavelength of 650 nm or greater, with the secondary measurement at a longer wavelength. Measurements for haemoglobin, whether taken around 570 or 415 nm, must take into account the contribution of lipaemia to absorbance. This is achieved by applying a correction factor to the result based on the measured lipaemia of the sample. Measurements for bilirubin must employ correction factors to account for both lipaemia and haemoglobin absorbance. Some instruments take measurements at more than three pairs of wavelength to calculate the serum indices. In these instances, the correction equations are more complicated, but generally involve summing the difference of each pair of wavelengths measured and multiplying the sum by a propriety factor.
49
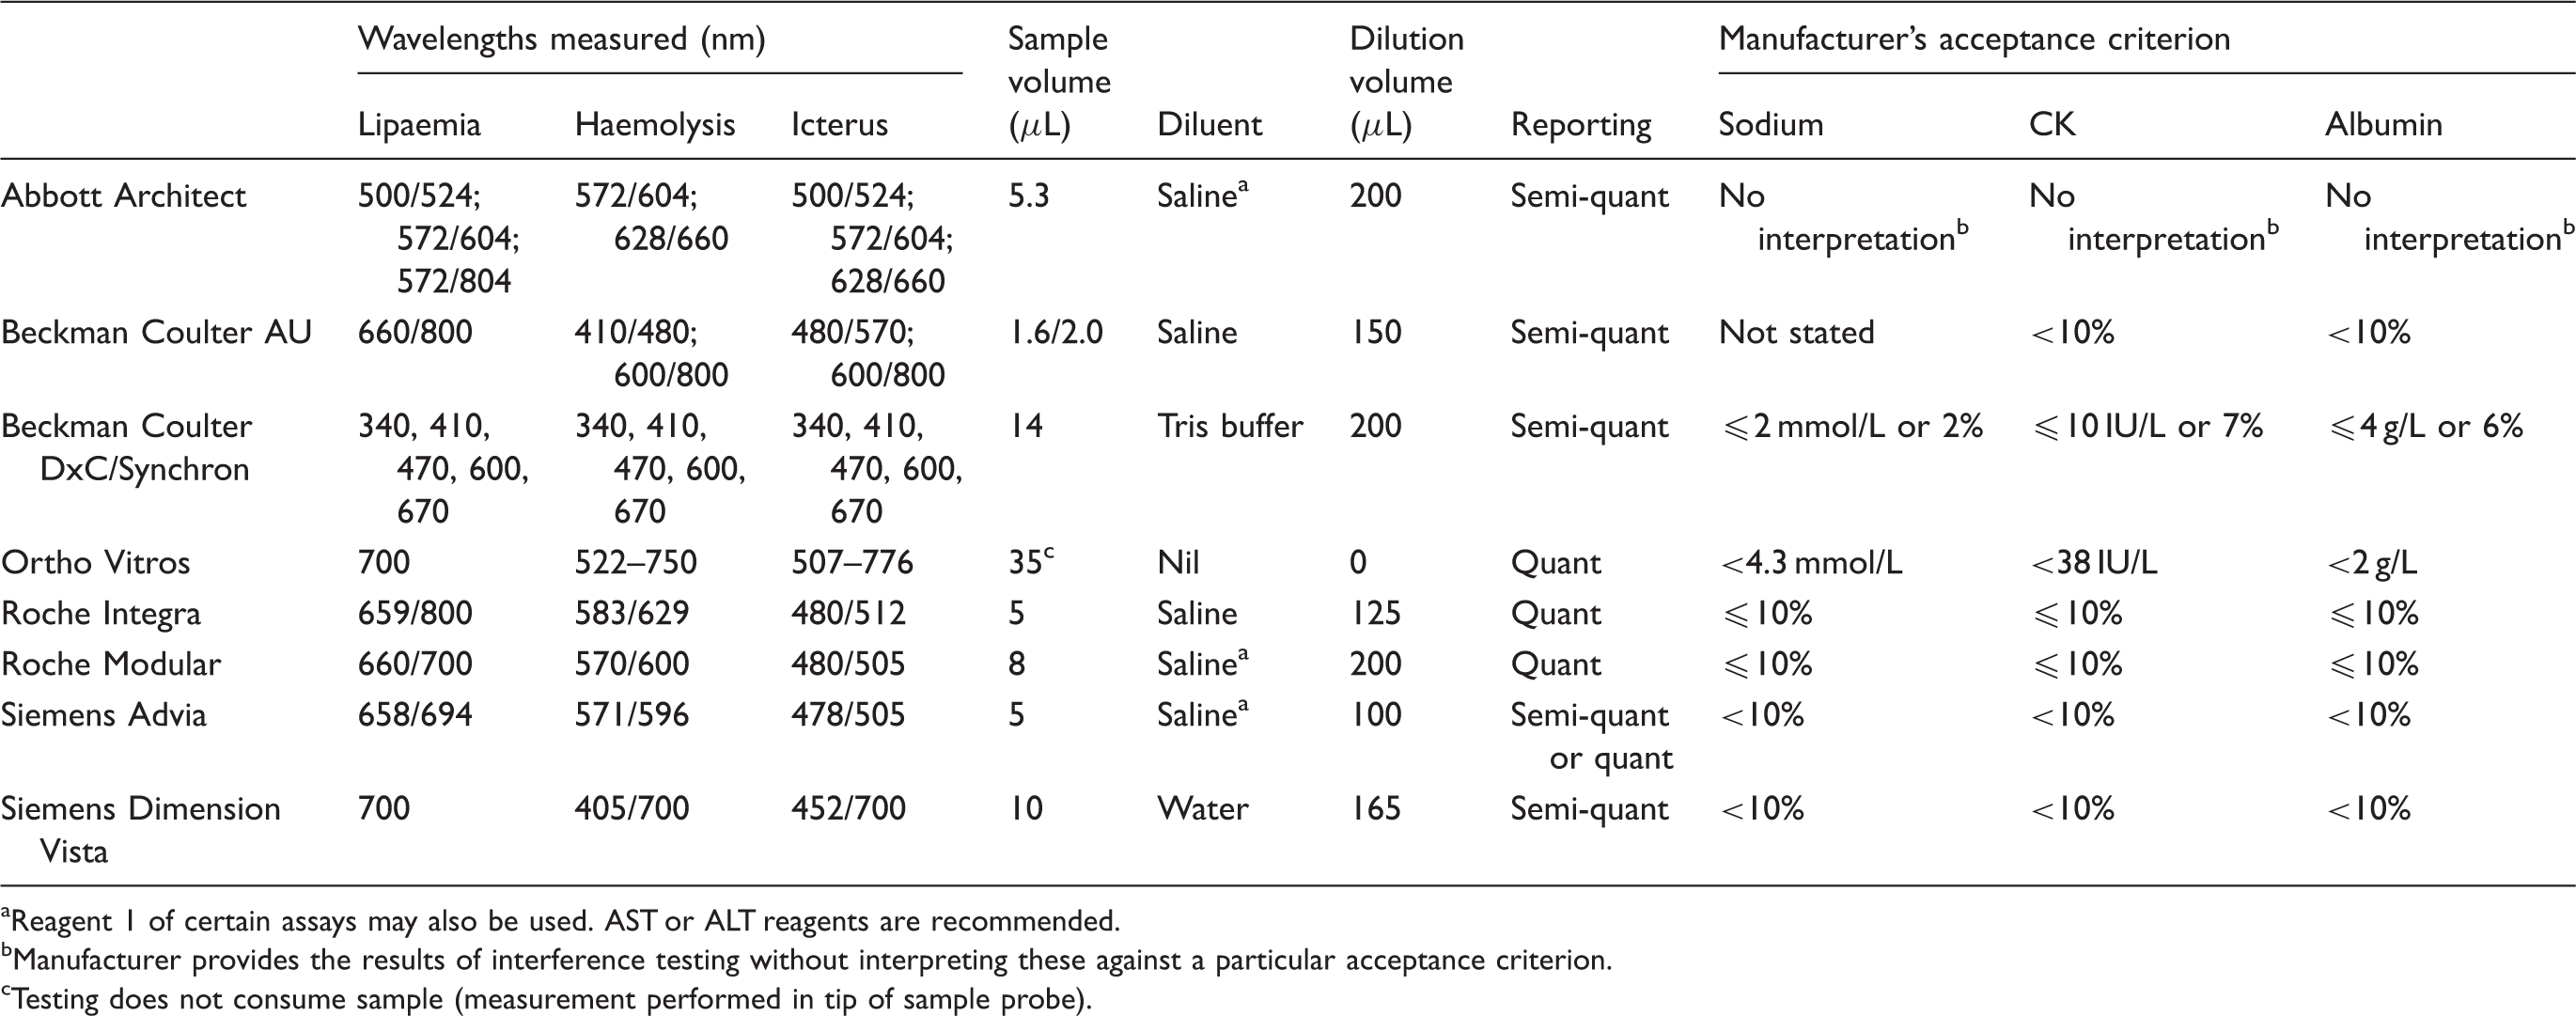
Table 2 details the characteristics of HIL index measurement for a number of the automated chemistry platforms in routine use.
Reagent 1 of certain assays may also be used. AST or ALT reagents are recommended. Manufacturer provides the results of interference testing without interpreting these against a particular acceptance criterion. Testing does not consume sample (measurement performed in tip of sample probe).
 ) and lipaemia (
 ).
).
The measurement of serum indices is not immune to interference itself. The correction equations may not fully account for spectral overlap of HIL absorbance, particularly in samples showing marked HIL.2,94 There are limited data published on these effects, and the magnitude and/or direction of bias is likely to be different for different instruments because of variations in the wavelengths measured and algorithms used. 2 Not all manufacturers provide information relating to these effects. Where information is provided, it ranges from general: ‘samples containing extremely high bilirubin concentrations or samples showing gross haemolysis may produce non-specific lipaemic flags’ 95 to more specific statements: ‘40 mg/dL bilirubin can have a negative effect on the haemolytic index. 500 mg/dL intralipid can have a positive effect on the haemolytic index’. 96 Additionally, the presence of other coloured compounds in the sample may interfere with HIL index results. For instance, Rose Bengal, used in the treatment of melanoma, has been shown to cause positive interference in the haemolytic index on some instruments 97 , while Patent Blue V dye, used to identify sentinel lymph nodes during cancer surgery, may cause positive interference with the lipaemic index and negative interference with the haemolytic and icteric indices. 98 High concentrations of EDTA, as may occur in under-filled EDTA tubes, may also cause positive interference in haemolytic index results. 99
Raised lipaemic index results may occur in samples containing high concentrations of immunoglobulins. A study examining 202 visually clear samples with extremely high lipaemic index results found all samples to have significantly elevated immunoglobulins: 87% monoclonal or biclonal gammopathy and 13% polyclonal gammopathy. 50 Conversely, however, only approximately 25% of samples with a monoclonal protein give a raised lipaemic index. 50 The high lipaemic index only occurs when the protein precipitates prior to measurement, either during its interaction with the diluent used for HIL analysis or because it acts as a cryoglobulin. 100 Susceptibility to this effect varies between different biochemistry analysers. 50
The icteric and lipaemic indices have corresponding analytes in routine biochemical analysis, bilirubin and triglycerides, respectively. There is excellent correlation between the icteric index and the formal laboratory measurement of bilirubin. Indeed, it has been proposed that the icteric index is used to identify patients with hyperbilirubinaemia who have not had liver function tests requested. 101 Furthermore, discrepancies between a patient’s bilirubin result and icteric index may be used to identify interference in the bilirubin assay. For example, paraprotein interference may cause marked false elevations in bilirubin measured by diazo methods, but not affect the icteric index. 102
In contrast, there is a much looser correlation between the lipaemic index and triglyceride concentration in patient samples, with correlation coefficients estimated to be 0.49–0.88.103,104 This poor correlation is expected because of the large variation in the size and triglyceride content between, and within, lipoprotein classes. However, for assays where the interference is mediated by the turbidity of the sample, the lipaemic index will more accurately indicate the potential for interference. The complementary information provided by triglyceride concentration and lipaemic index, reported as the logarithm of triglyceride concentration to lipaemic index ratio, has been proposed as a useful parameter for discriminating between certain lipoprotein disorders, identifying abnormalities of glycerol metabolism and detecting pre-analytical errors due to a non-fasting state. 105 Additionally, interference in triglyceride assays, as may occur because of high glycerol concentrations, has been identified when patients have a markedly elevated triglyceride result, but a normal lipaemic index. 106
There may be a role for information technology solutions in highlighting potential inference in HIL index results to laboratory staff. For instance, where it has been established by a laboratory that a lipaemic index greater than a certain value may produce a false-high haemolysis index result, a comment may appear warning laboratory staff of this effect. Similarly, there may be value in the laboratory information system (LIS) monitoring and flagging discrepancies between triglyceride results and lipaemic indices as well as bilirubin results and icteric indices. This may help identify instances of interference either in the analytes or their corresponding indices. The latter effect may be particularly helpful because some laboratories may have set up their LIS to automatically validate results if the analyte results are normal. Even in laboratories where results are manually validated, it may be easy for staff to fail to notice a high lipaemic flag when all the results of the reported analytes are normal. In such an instance, some form of LIS notification to staff may allow the identification of an undiagnosed paraprotein.
The haemolytic index does not have a corresponding analyte among routine testing panels. However, there may be value in considering use of the haemolytic index beyond interference testing. Plasma-free haemoglobin is a useful parameter in the monitoring of intravascular haemolysis and has also been found to be a prognostic marker, superior to procalcitonin and clinical scoring systems, in the context of severe sepsis.107,108
Accurate HIL index results are important because they influence the interpretation of laboratory testing. It is therefore appropriate for laboratories to perform some basic checks to ensure the accuracy of HIL index results. The CLSI recommends that laboratories consider verifying an instrument’s index results prior to use and perform ongoing quality control (QC). 2 Verification checks suggested by the CLSI include comparing haemolytic and icteric index results to the direct analysis of haemoglobin (such as by the cyanomethemoglobin method) and both total and direct bilirubin. An alternative verification method proposed by the CLSI is to simply add haemolysate, bilirubin or intralipid to patient pools in a range of concentrations expected to generate HIL flags. 2 Although not explicitly a component of the CLSI verification guide, laboratories should also consider evaluating the precision of an instrument’s index results prior to routine use. This would also help the verification fulfil the International Organization for Standardization 151890 document. 109 Basic QC material can be prepared by freezing aliquots of a patient pool that has had haemolysate or intralipid added. QC for the icteric index can be easily prepared with commercial bilirubin QC material. 2 Such checks can help to ensure that HIL indices are performing as expected over time and that there is acceptable agreement in HIL index results between the different instruments used by the laboratory.
Interference testing
It is important that laboratory managers are aware of the various approaches to testing the susceptibility of assays to HIL interference. The limitations of the interference information supplied by assay manufacturers, as well as the need for many laboratories to manage HIL interference on different chemistry analysers, make performing inhouse interference testing all the more imperative. Evaluation of HIL interference involves using an experimental protocol that best replicates the interference effects as they occur in patient samples and interpreting the results against rational criteria.
Two basic experimental designs are used to evaluate HIL interference. The potentially interfering substance may be spiked into samples and the results compared with unspiked samples. Alternatively, patient samples containing the interferent may be obtained and results from the assay being evaluated compared with results from a highly specific assay not susceptible to interference. The latter approach has the advantage of showing the interference effects as they occur in patient samples. However, this design is less commonly used because of the requirement to identify numerous patient samples demonstrating a wide range of haemolysis, icterus and lipaemia, plus the requirement for a highly specific measurement procedure. Nevertheless, as mass spectrometry techniques become increasingly used in routine laboratories, this experimental design may become more feasible. CLSI guidelines providing detailed instructions on performing interference testing are available. 78
There are a number of considerations when planning HIL interference testing using protocols based on spiking-in the interferent. In the case of haemolysis, it is important to add RBC contents to samples rather than simply haemoglobin. Haemolysates may be prepared by subjecting whole blood to mechanical trauma, osmotic shock or freezing. The use of mechanical trauma, which can be achieved by passing a sample multiple times through a fine-gauge needle, will most closely mimic the mechanism of most cases of ex vivo haemolysis. 79 A shortcoming of this technique is the difficulty of producing the desired increments in the haemolytic index. Osmotic shock of washed RBCs, followed by freezing, is the procedure recommended by the CLSI. 78 An additional consideration for analytes, such as insulin and troponin T, where the mechanism of haemolysis interference is degradation by intracellular enzymes, is the duration for which the sample is exposed to intracellular contents. For these analytes, it may be important to expose samples to intracellular enzymes for a similar amount of time to that expected for routine clinical specimens.
Testing for icteric interference can be done by the addition of bilirubin. However, it is important that interference from both the unconjugated and conjugated bilirubin forms is tested. Certain assays have shown interference with one, but not the other, of these forms; 80 other assays have shown positive interference with one form and negative interference with the other. 39 Interference studies are commonly performed using ditaurobilirubin as a stable alternative to the monoglucuronide and diglucuronide conjugate bilirubin forms found in vivo. However, concerns have been raised that ditaurobilirubin may not always produce the same interference effects as the glucuronide conjugate forms. 2
Interference from lipaemia is frequently assessed by the addition of the soy-based emulsion, intralipid, to samples. However, there are limitations to the use of intralipid. It consists of phospholipid-rich liposomes and triglyceride-rich artificial chylomicrons 200–600 nm in size (mean 345 nm). 81 Therefore, intralipid particles are larger than VLDL particles and have a smaller range of sizes than chylomicrons. Additionally, the refractive index of intralipid differs from lipoprotein particles. 81 Consequently, samples spiked with intralipid may fail to show the same effects as lipaemic patient specimens. Indeed, lipaemic patient specimens, but not samples spiked with intralipid, have demonstrated negative interference for caeruloplasmin, creatinine, haptoglobin and prealbumin.82,104
Lipaemia interference testing may employ a variation to the approach of using patient samples. Rather than comparing results to an interference-free method, the lipoproteins may be removed and the analysis repeated by the routine assay. Lipoprotein removal may be achieved by ultracentrifugation, high-speed centrifugation or treatment of the sample with the commercially available non-ionic cyclodextrin polymer, lipoclear. Caution needs to be exercised when using lipoclear, as the agent itself may interfere with certain assays, such as sodium and albumin. 83 Even with an ideal experimental protocol, however, there may be some patient-to-patient variation in assay interference, related to variations in lipoprotein composition. Larger lipoprotein particles may exert a greater effect on assays affected by differential partitioning, while the degree of turbidity is largely influenced by the number of particles present. 84
It is recommended that when a spiking protocol is used for interference experiments, at least two different analyte concentrations are tested. 2 Although HIL interference is often independent of analyte concentration, it is not always the case. Haemolysis interference with routine bilirubin and troponin assays has been shown to vary with analyte concentration.85,86 The CLSI provides recommendations regarding the analyte concentrations at which interference testing should be performed. 78 In addition, there may be merit in performing interference testing with each sample type used by the laboratory. For instance, differences in the effect of haemolysis on potassium assays have been demonstrated in venous versus capillary samples. 87
The setting of acceptability limits is of great significance in the interpretation of results of interference studies. Manufacturers often use ±10% as their criterion of acceptability for their assay performance claims with regard to interferences (Table 2). However, this generic criterion may not be appropriate for all analytes, and a more rational approach is to set analyte-specific criteria. Several different approaches have been taken for setting analyte-specific criteria. Some authors have used the criterion that the interference does not exceed the total allowable limit of error for the analyte specified by professional bodies, such as the Clinical Laboratory Improvement Amendments (CLIA) or the Royal College of Pathologists of Australasia.88,89
The CLSI has taken a more stringent approach. It considers an interference to be acceptable when the result is within a total error specification, considering the bias and imprecision of the assay under investigation and the physiological variability of the analyte, in addition to the effect of the interferent. Therefore, the allowable degree of interference is the residual error after the bias, imprecision and physiological variability have been subtracted (as variances) from the total allowable error. 78
Another approach is to derive an acceptability limit for interference directly from biological and/or analytical variation data. A number of equations have been used based on different considerations. The equation I < 1.96 × (CVA2 + CVI
2
)1/2 specifies that the interference (I) is less than the central 95% of the variation in the result caused by the analytical (CVA) and intra-individual biological variation (CVI).49,90 Others have used the equation I < 0.375 × (CVI2 + CVG
2
)1/2, where CVG is the between-individual biological variation.
39
This equation was derived using Gaussian statistics considering the proportion of a population with results outside the reference interval (ideally 5%). It identifies an interference as significant if it increases the proportion of abnormal results to 6.7% or more.
91
Others have derived the following equation, by assuming the quality goals of CVA < ½ × CVI and minimal systematic error (SE) are met: I < CVI – 1.96 × CVA + SE.
92
Figure 2 illustrates how the use of different acceptability criteria may influence the interpretation of the results from an interference testing experiment.
The effect of using different acceptability criteria when setting HIL interference alert limits. The interferographs show data for sodium (a) and creatine kinase (b) from an experiment in which haemolysate was spiked-in to pooled patient serum.
94
A number of examples of acceptability limits are plotted: ±10%, allowable limits of error from CLIA, and allowable limits for interference based on biological variation, using the equation I < 1.96 × (CVA2 + CVI
2
)1/2.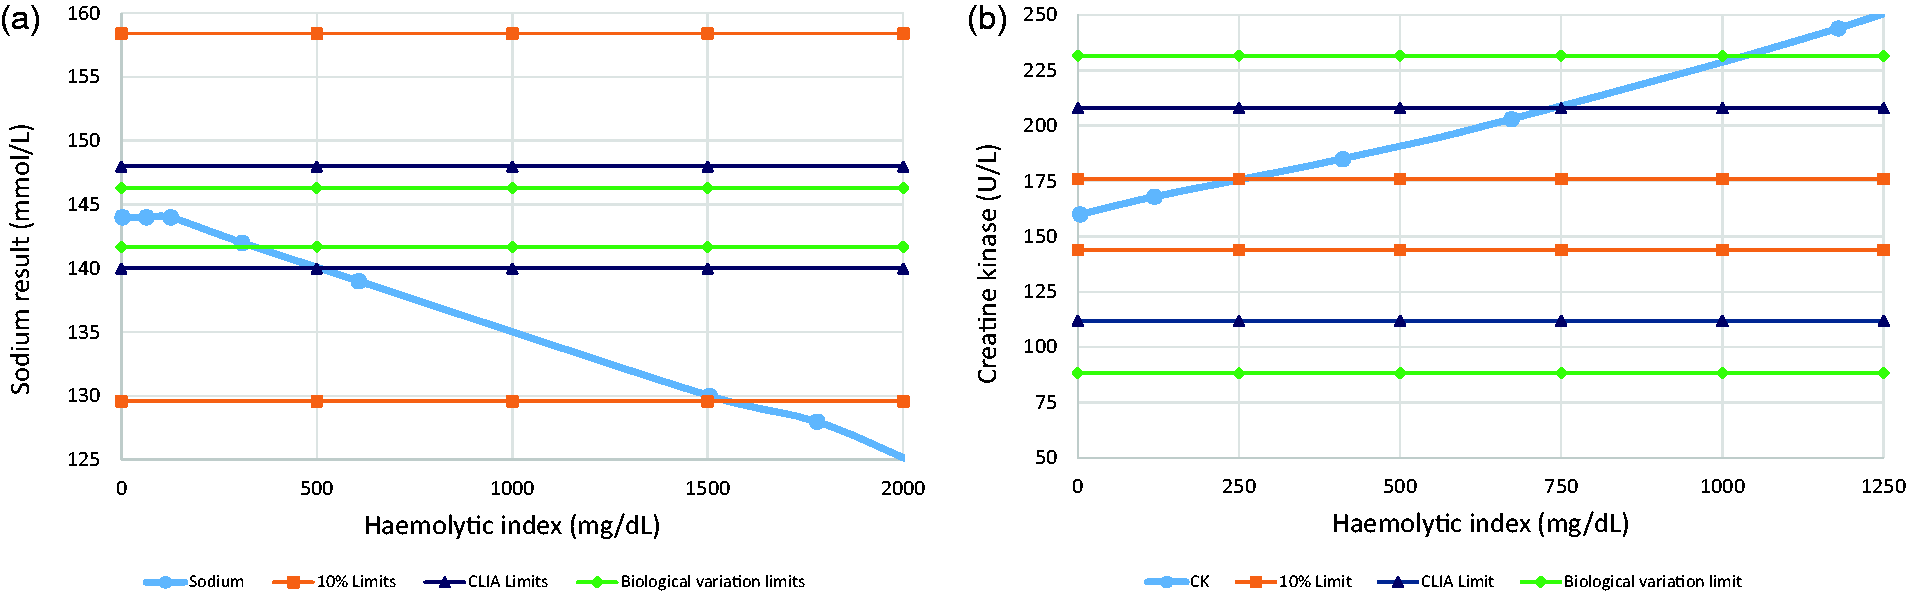
In practice, a laboratory may consider a hierarchy of HIL index limits, employing up to three levels. First, a ‘grey zone’ limit may be set. A grey zone index may occur in one of two contexts: (i) the index result is above the highest HIL level tested for the analyte and, therefore, no interference data exist for the result or (ii) the index result lies above the highest level tested with no significant interference but below the lowest level tested with unacceptable interference. 2 Second, the ‘alert index’ is the lowest tested concentration of haemoglobin, bilirubin or lipaemia at which the analyte result is altered to a clinically significant degree. Index results above the alert index will therefore generate an interference flag.
Some laboratories may choose to report some results where the HIL indices are above alert levels along with an accompanying comment explaining the likely effect of interference on the result. 93 Such laboratories may then consider a third decision level, the ‘hold index’, above which the interference is present to such a degree that the result provides no useful information to the clinician and should not be reported. Laboratories may also consider modifying the alert limits depending on analyte concentration, recognizing that a particular degree of interference may be more or less significant at different analyte concentrations. 2
Managing indices across different platforms
Managers of laboratories using biochemistry analysers from multiple manufacturers face an additional layer of complexity when developing a rational approach to HIL interference. A similar challenge is faced by laboratory networks, in which a variety of analytical platforms are used, when they attempt to harmonize their handling of HIL interference. In such scenarios, consideration first needs to be given to how HIL index results from the different platforms compare and, second, to how HIL interference affects results from each analyser.
All current biochemistry analysers use the same principle for HIL index measurement. However, bias in index results from different instruments may emerge because of differences in the diluent and dilution factor used, wavelengths measured and the correction equations employed. 110 Despite the ubiquitousness of HIL testing, there have been few published studies comparing HIL results from different platforms. The WEQAS preanalytical proficiency programme has reported some data on agreement of serum indices. 111 The haemolytic index results for a single sample were tabulated from a total of 144 laboratories. The mean haemolytic index results for the different instruments showed good agreement: Abbott Architect 168 mg/dL, Roche Cobas 199 mg/dL, Ortho Vitros 173 mg/dL, while mean results (n = 57) for a sample spiked with conjugated bilirubin spiked to a concentration of 320 μmol/L showed greater variability between the methods: Abbott Architect 292 μmol/L, Roche Cobas 476 μmol/L, Roche Modular 440 μmol/L, Siemens Dimension 684 μmol/L. There was a similar amount of intermethod variability for a sample spiked with intralipid, mean results (n = 111): Abbott Architect 371 mg/dL, Roche Cobas 527 mg/dL, Ortho Vitros 310 mg/dL, Siemens Advia 483 mg/dL.
The haemolytic index results for a number of methods have also been compared to a cyanomethaemoglobin reference method. Lippi et al. 110 concluded that the agreement between haemolytic index results from the Roche Modular, Roche Integra, Siemens Dimension RxL, Siemens Advia 2400, Siemens Advia 1800, Olympus AU 680 and Coulter DxC 800 with the reference method was ‘satisfactory’. 110 Their data, however, did show that the Siemens Advia 2400 and 1800 systems had a proportional positive bias of approximately 40% compared with the reference method, while the other quantitative methods (Modular and Integra) showed close agreement with the reference method. However, when H index results were normalized to the instrument-specific alert value (as defined by the manufacturer or local user), the differences were greatly reduced; for example, the normalized Advia 2400 results were all within 10% of the reference method. This illustrated that difference in H index results were being compensated for by adjustment of the alert limit for each instrument. The ‘normalization’ process used in the study simply involved dividing all results from each instrument by a particular factor, therefore factoring results from different platforms would appear to be an alternative approach to attempt to harmonize index results.
The ability of a laboratory to harmonize HIL index results is greatly limited if one or more of the analytical platforms reports HIL index results semi-quantitatively. In this instance, it may be difficult to alter the limits used to set the semi-quantitative ranges. Nevertheless, it may still be possible to harmonize reporting among the different systems by instructing the LIS to report the quantitative index results in a semi-quantitative manner, using the same index ranges as used on the platform reporting semi-quantitatively. Harmonizing index results to a semi-quantitative method in this manner restricts the ability to set precise alert limits for each assay. It also limits the ability to distinguish degrees of HIL above the highest semi-quantitative category and selectively report assay results accordingly.
There may also be differences in HIL index results from the same analyser at different laboratories because of the use of different method parameters. For example, some instruments may be set-up to measure indices after dilution in saline or in a particular assay reagent, as detailed in Table 2. The Siemens Advia may be set-up to use saline or alanine aminotransferase (ALT) reagent 1 as the diluent for HIL analysis. However, comparison of the use of these two diluents for HIL analysis on the same instrument showed that the haemolytic index was about 15% lower when the ALT reagent was used, compared with the saline as diluent. The icteric and lipaemic indices showed no significant differences between results obtained using the two diluents. 94
The second consideration when managing the indices across different analytical platforms is whether assays from different manufacturers are similarly affected by HIL interference. For analytes where the mechanism of interference is a change in the concentration of analyte in the sample, such as the effect of haemolysis on sodium and potassium results, the effect of HIL is expected to be similar on all platforms. Indeed, this has been found to be the case on the Advia and Modular instruments for sodium and potassium. 94 For assays where the mechanism of interference is interruption of the measurement process, there is a much greater potential for dissimilar effects on different instruments. Icterus, for instance, has been shown to have no significant effect on some phosphate assays (Ortho Vitros 250/950 and Hitachi 700/900 platforms), positive interference with other assays (Technicon Axon) and negative interference with yet other assays (Roche Integra and Kone 30i/60i platforms). 112 Therefore, there is much greater scope for harmonizing the handling of HIL-affected samples on assays where the mechanism is change in the concentration of analyte in the sample, as opposed to where there is interference in the measurement process itself.
Conclusions
HIL interference is a common problem in routine laboratory practice. Recent advances by instrument manufacturers have enabled the use of rapid and accurate assessment of HIL by spectrophotometric analysis. However, laboratory practice has generally failed to take full advantage of the technical progress. The information provided by manufacturers regarding HIL interference with their assays may have limitations; for instance, inappropriate criteria are often used for identifying significant interference. Nevertheless, laboratories frequently adopt the recommendations of manufacturers for HIL. It is imperative that laboratories are able to critically evaluate the information supplied by manufacturers regarding HIL interference and perform their own interference studies where this information is inadequate. Laboratory quality can be improved by treating HIL indices as another quantitative assay. HIL index verification and internal quality control can ensure the ongoing accuracy of results. Method comparison studies may also be appropriate if laboratories, or laboratory networks, use chemistry analysers from different manufacturers. On the basis of such studies, factoring HIL results may be considered to harmonize results from different analysers. Ongoing method comparison checks may then ensure consistency in how samples affected by HIL interference are handled by the laboratory, independent of the analyser on which the sample happens to be measured. A rigorous approach to handling samples demonstrating significant HIL will allow the advances achieved by spectrophotometric measurement of these interferences to be maximized and, consequently, patient safety improved.
Footnotes
Acknowledgements
This article was prepared at the invitation of the Clinical Sciences Reviews Committee of the Association for Clinical Biochemistry and Laboratory Medicine.
Declaration of conflicting interests
The author(s) declared no potential conflicts of interest with respect to the research, authorship, and/or publication of this article.
Funding
The author(s) received no financial support for the research, authorship, and/or publication of this article.
Ethical approval
Not applicable.
Guarantor
CF.
Contributorship
CF researched literature and wrote the first draft of the manuscript. All authors planned, reviewed and edited the manuscript and approved the final version.