
Abstract
Background
Haemolysis has been reported as having a positive, negative or no effect on plasma sodium (PNa) and chloride (PCl). We investigated the haemoltytic effect of different haemolysis protocols on PNa and PCl using modelling and laboratory experiments.
Methods
In a modelling experiment, percentage change and recovery due to dilution in routinely (in vitro) haemolysed samples were compared against shear stress haemolysis and samples spiked with haemolysate from whole blood freeze–thaw, packed cells freeze–thaw and osmotic shock protocols. The results were compared against a control base pool. Additionally, for the osmotic shock method, results were compared against saline- and deionised water (DIW)-spiked controls. In a laboratory experiment, percentage change and recovery were similarly compared using haemolysate from whole blood freeze–thaw and osmotic shock protocols. PNa, PCl and H-index were measured on the Abbott Architect and haemoglobin on the Sysmex XN-9000.
Results
In the modelling experiment, the percentage decrease in PNa and PCl was similar in in vitro haemolysis, shear stress haemolysis, whole blood freeze–thaw haemolysis and packed cells freeze–thaw haemolysis and this was lower compared to the osmotic shock method. In the laboratory experiment, the change in PNa compared to the base pool was less (p < 0.001) per unit increase in H-index in the freeze–thaw method (−0.33 mmol, 95% CI −0.35 to −0.31) compared to the osmotic shock method (−0.65 mmol, 95% CI −0.66 to −0.64). PCl did not change with haemolysis in the freeze–thaw method and changed by −0.21 ± 0.01 mmol per unit increase in the H-index in the osmotic shock method. Recovery of PNa and PCl increased with increasing H-index in both methods.
Conclusion
The osmotic shock protocol is inappropriate for haemolysis studies because of dilution with DIW used for cell lysis. Recovery calculations may incorrectly compensate for genuine dilution caused by haemolysis.
Background
Although in vitro haemolysis has become less frequent with improvements in sample collection, transport and processing, it remains the commonest pre-analytical error.1,2 Most haemolysed specimens received by laboratories are the result of in vitro haemolysis, with in vivo haemolysis accounting for less than 2% of haemolysed specimens. 3 Haemolysis has been variably defined as erythrocyte breakdown2,3 or the release of intracellular contents from erythrocytes, leukocytes and platelets. 4 Spectrophotometric measurement of the haemolytic index (H-index) is the preferred method for estimation of haemolysis but is itself prone to interference 2 and only takes into account contribution from erythrocytes.
Bias or error due to haemolysis could be due to these four mechanisms 3 : (a) spectrophotometric interference due to released haemoglobin, (b) physical 5 or chemical interference due to haemoglobin or other intracellular substances, (c) increase in plasma concentration for analytes with higher intracellular than extracellular concentrations, and (d) dilution of serum or plasma analyte levels with lower intracellular than extracellular analyte concentrations. For analytes like sodium 5 and chloride, the effect could be due to a combination of these factors. The effect of these factors has traditionally been termed as haemolytic interference and often incongruously presented as interference from haemoglobin.
The International Federation of Clinical Chemistry and Laboratory Medicine (IFCC) defines interference as ‘the systematic error of measurement caused by a sample component, which does not, by itself, produce a signal in the measuring system’, 3 whereas the Clinical and Laboratory Standards Institute (CLSI) defines interference as ‘a cause of clinically significant bias in the measured analyte concentration due to the effect of another component or property of the sample’. 6 A real method-independent change in analyte concentration due to haemolysis as a result of either higher (e.g. potassium) or lower (e.g. sodium and chloride) intracellular concentration, therefore, cannot be classed as ‘interference’ and is termed an ‘influence’. 7 The change in analyte concentration due to a combination of interference and influence has been termed as an ‘effect’ throughout this article.
There are several well-described methods to study in vitro haemolysis and most utilise osmotic shock, freeze–thaw, shear stress or a combination of these to lyse cells. 3 Most widely used has been the osmotic shock protocol described by Meites 8 which has been adapted by CLSI and included in the CLSI guidance document for interference testing in Clinical Chemistry. 6
Data on the effect of haemolysis on plasma sodium and chloride concentrations are conflicting. The concentrations of sodium (10–15 mmol/L) 8 and chloride (45 to 54 mmol/L) in erythrocytes 10 are much lower than in plasma. During haemolysis, therefore, it would be expected that plasma sodium and chloride would decrease due to dilution by released intracellular contents. Consistent with this notion, a decrease in sodium and chloride concentrations with increasing haemolysis has been reported5,9,10; however, others have reported no effect 11 or an increase.12,13 We hypothesised that the increased concentrations of sodium (observed values of 102.1% and 104.5% at haemoglobin 10 g/L and 20 g/L, respectively, on Architect 12 ) and chloride (observed values of 106.2% and 112.1% at haemoglobin 10 g/L and 20 g/L, respectively, on Architect 12 ) with haemolysis reported by Abbott Architect and Alinity platforms used in our laboratory could be either due to their use of the osmotic shock protocol to study the effect of haemolysis or their incorrect use of recovery calculations to correct for sample dilution due to haemolysis or both.
In an institution-approved service evaluation project, therefore, we conducted laboratory experiments comparing two haemolysate preparation protocols (freeze–thaw and osmotic shock) and two data processing methods (percentage change and recovery) to evaluate methods for investigating the effect of haemolysis on the ion-selective electrode (ISE) sodium and chloride results and to identify reasons for the reported conflicting data. It is not possible to accurately quantify dilution in samples haemolysed in routine laboratory practise or in haemolysis experiments. Therefore, in addition to the laboratory study, we constructed a theoretical model to predict the dilution effect of commonly used haemolysate preparation methods compared against routine in vitro haemolysed samples.
Methods
Modelling experiment
A virtual experiment modelled on plasma sodium and chloride was designed to study the effect of haemolysis on analyte X which has plasma and intracellular concentrations of 100 mmol/L and 0 mmol/L, respectively.
Summary and results of the modelling experiment.
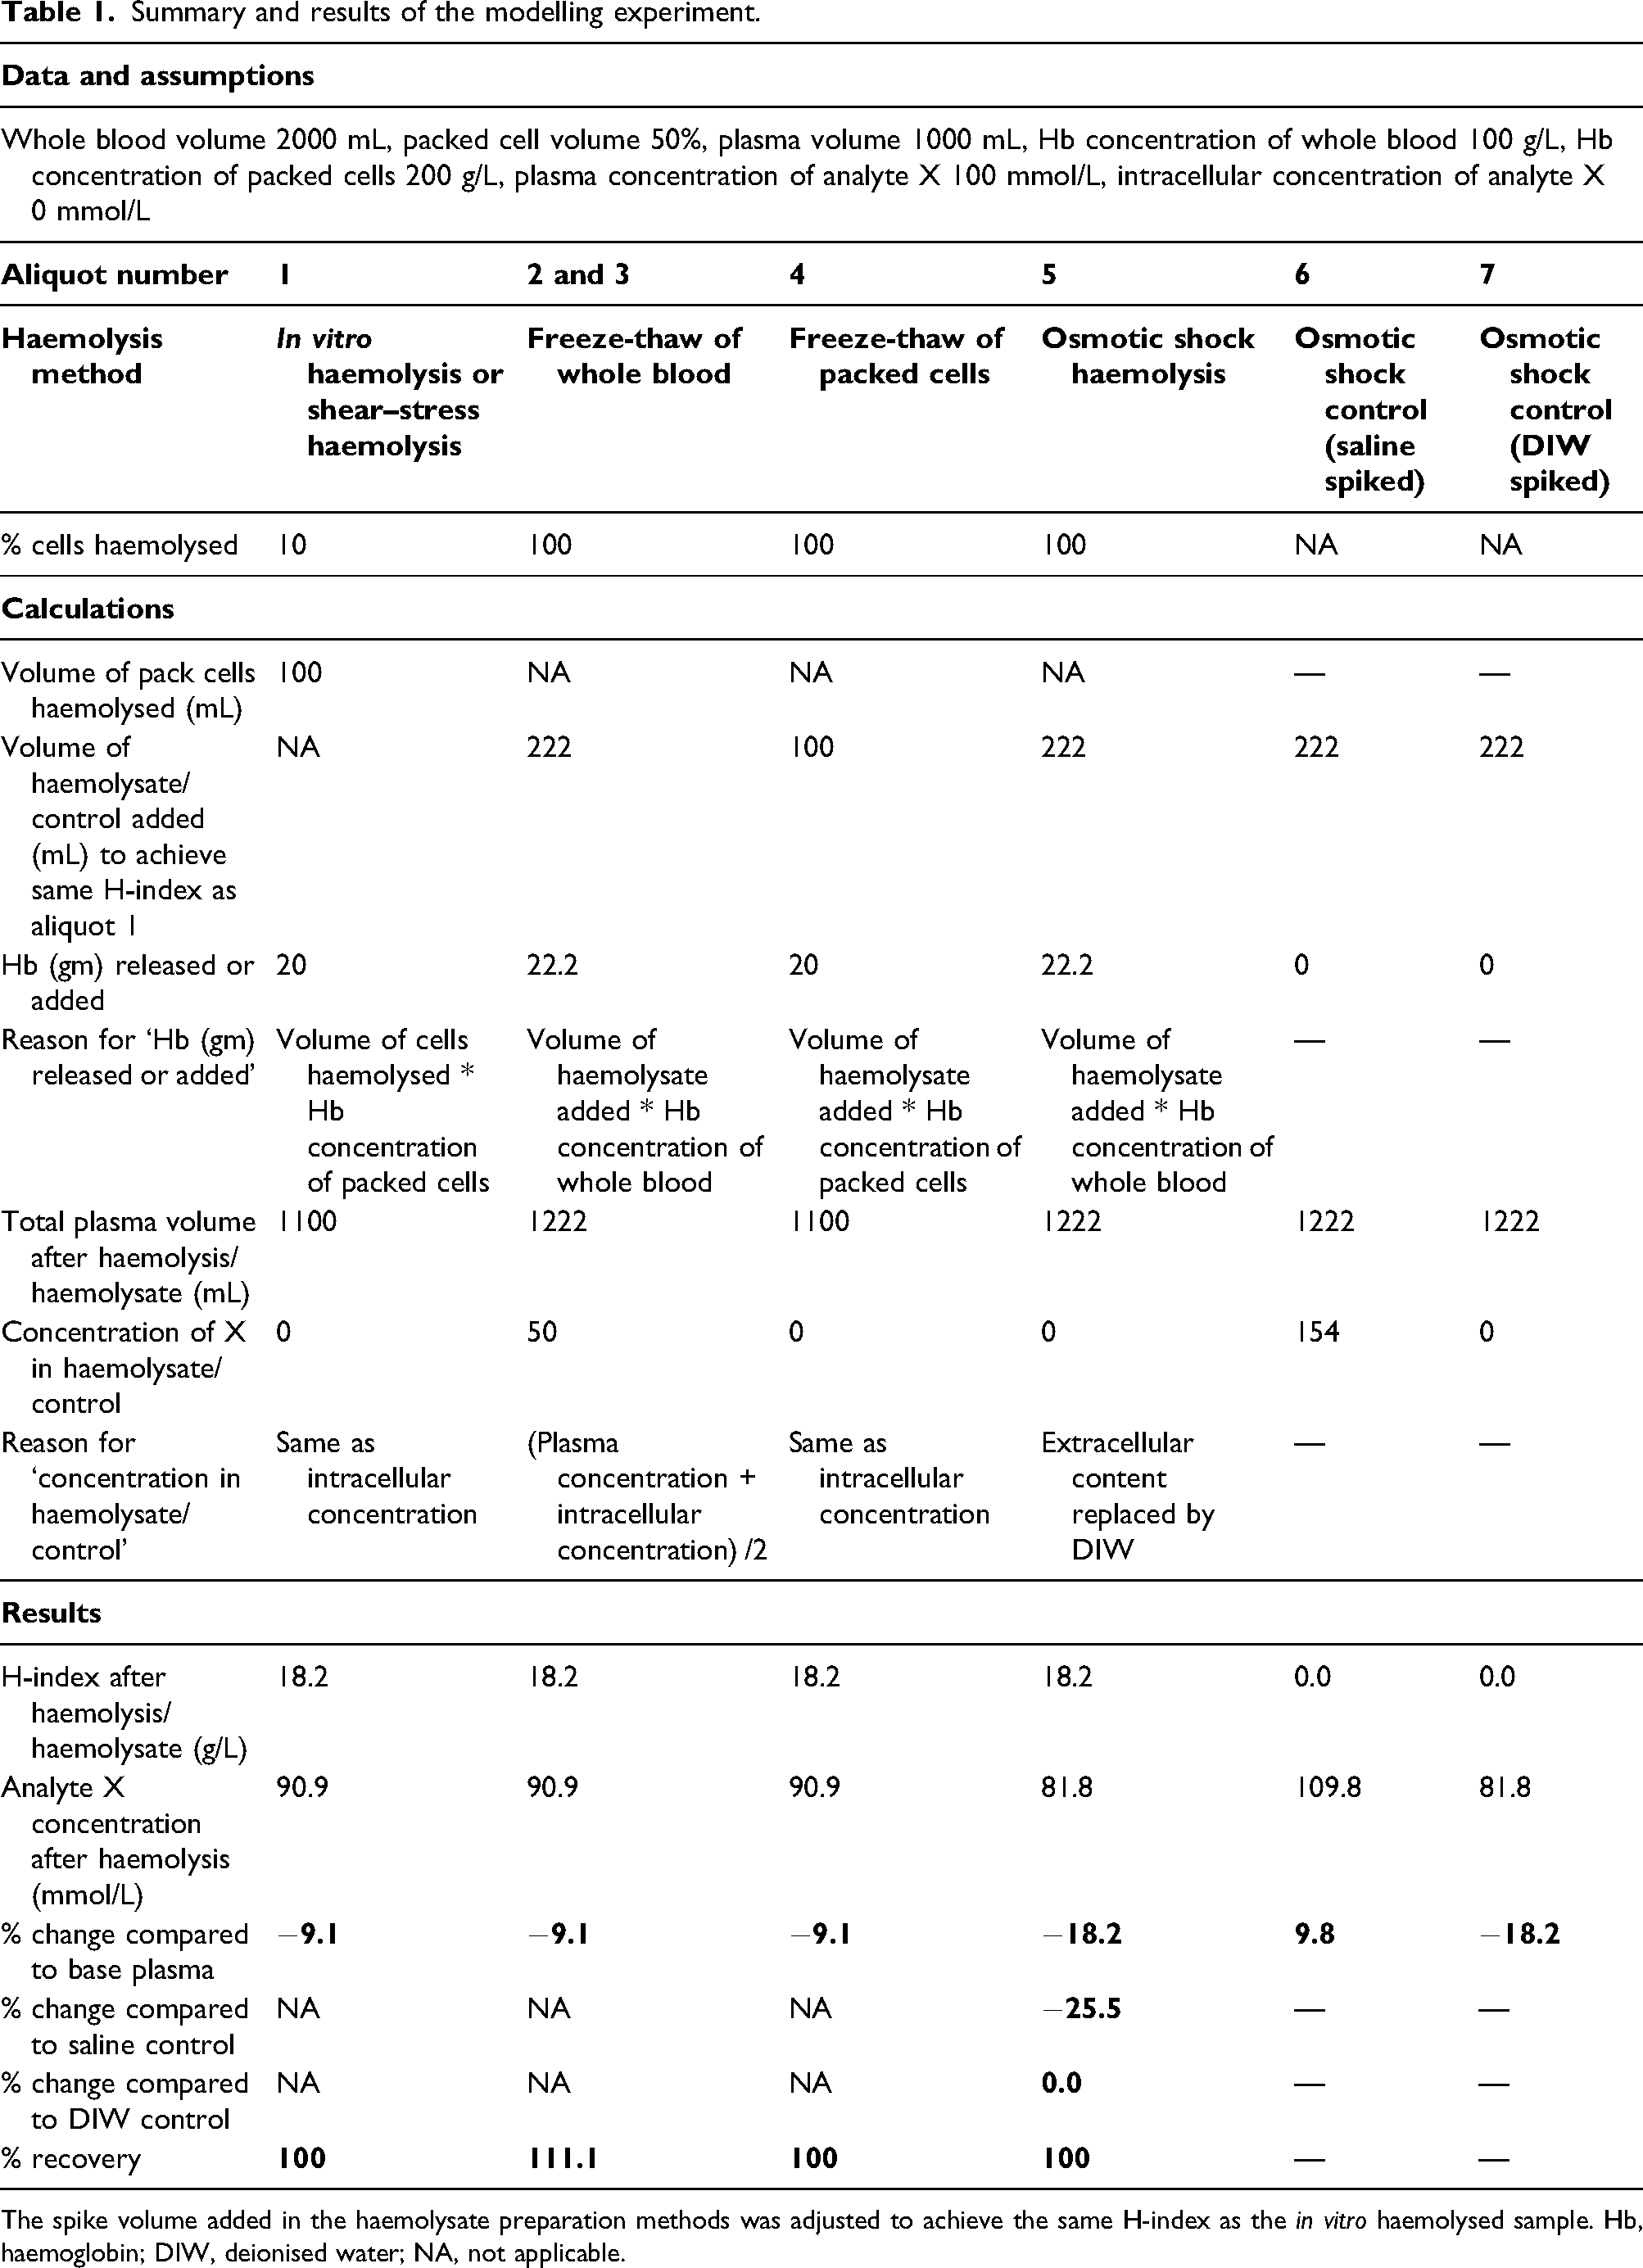
The spike volume added in the haemolysate preparation methods was adjusted to achieve the same H-index as the in vitro haemolysed sample. Hb, haemoglobin; DIW, deionised water; NA, not applicable.
The first aliquot of blood underwent routine processing in the laboratory, but 10% of the erythrocytes (100 mL out of 1000 mL) were coincidentally haemolysed during processing. We hypothesise that residual cell debris from the haemolysed cells was negligible. The resultant plasma volume in this aliquot would increase to 1100 mL. Mechanical or shear stress haemolysis, where blood is cycled through a needle, mimics this scenario of routine in vitro haemolysis.
The second aliquot underwent freeze–thaw cycles of the whole blood to prepare haemolysate. 9 The haemolysate was spiked into 1000 mL plasma obtained after centrifugation of the third aliquot. An assumption of complete cell lysis with negligible residual cell debris was made. The spiked volume was adjusted to achieve the same haemoglobin concentration (H-index) as aliquot 1.
The fourth aliquot was centrifuged separating 1000 mL of packed cells from 1000 mL of plasma. The packed cells underwent freeze–thaw cycles to achieve complete cell lysis producing haemolysate. The haemolysate was spiked into 1000 mL plasma and the spike volume was adjusted to achieve the same haemoglobin concentration as aliquots 1 and 3.
The fifth aliquot was centrifuged to separate 1000 mL cells from 1000 mL plasma. The packed cells underwent complete lysis by osmotic shock (addition of 1000 mL deionised water (DIW)) to produce haemolysate. 6 The haemolysate was spiked into 1000 mL plasma and the spike volume was adjusted to achieve the same haemoglobin concentration as aliquots 1, 3 and 4.
The sixth and the seventh aliquots were centrifuged and the separated 1000 mL plasma was spiked with the same volume as aliquot five spike but, respectively, with saline and DIW. The model assumed 154 mmol/L concentration of analyte X in saline. As in the CLSI-recommended method, 6 these two aliquots acted as controls for comparison of results of the osmotic shock lysis aliquot five.
Analyte X and haemoglobin (H-index in g/L) were measured on a chemistry analyser. To mimic sodium and chloride measurement by direct ISE, 5 we assumed that neither haemoglobin nor any other intracellular contents cause analytical interference in X; therefore, the effect of haemolysis would entirely be due to dilution by the release of intracellular contents deplete in X. The results by each of the methods were tabulated and percentage change and recovery of X were calculated.
The measured result, in this virtual scenario, would equate to the expected result calculated accounting for dilution using the formula {[plasma concentration * (plasma volume/total volume after haemolysis or spike)] + [concentration in haemolysate * (volume increased due to haemolysis or spike/total volume after haemolysis or spike]}.
Bias in terms of recovery was calculated against the base plasma pool by the formula [concentration in haemolysed or spiked sample * (total volume after haemolysis or spike/volume of base plasma pool)/plasma concentration] and was expressed as a percentage. To ensure comparability, recovery was also calculated using the same equation for in vitro haemolysis (aliquot 1).
The same procedure was repeated n = ∞ times and each time the routinely processed aliquot (aliquot one) haemolysed to a varying extent and therefore the rest of the aliquots followed the same sample handling and spiking procedure detailed above to achieve an equal H-index each time. Analyte X and H-index were measured every time for each of the aliquots, except aliquot two, and percentage change and recovery were plotted (Figure 1). Plots of H-index with percentage change (a) and H-index with percentage recovery (b) for in vitro haemolysis and the three haemolysate preparation methods after multiple repeats of the modelling experiment. Figures truncated at H-index 30.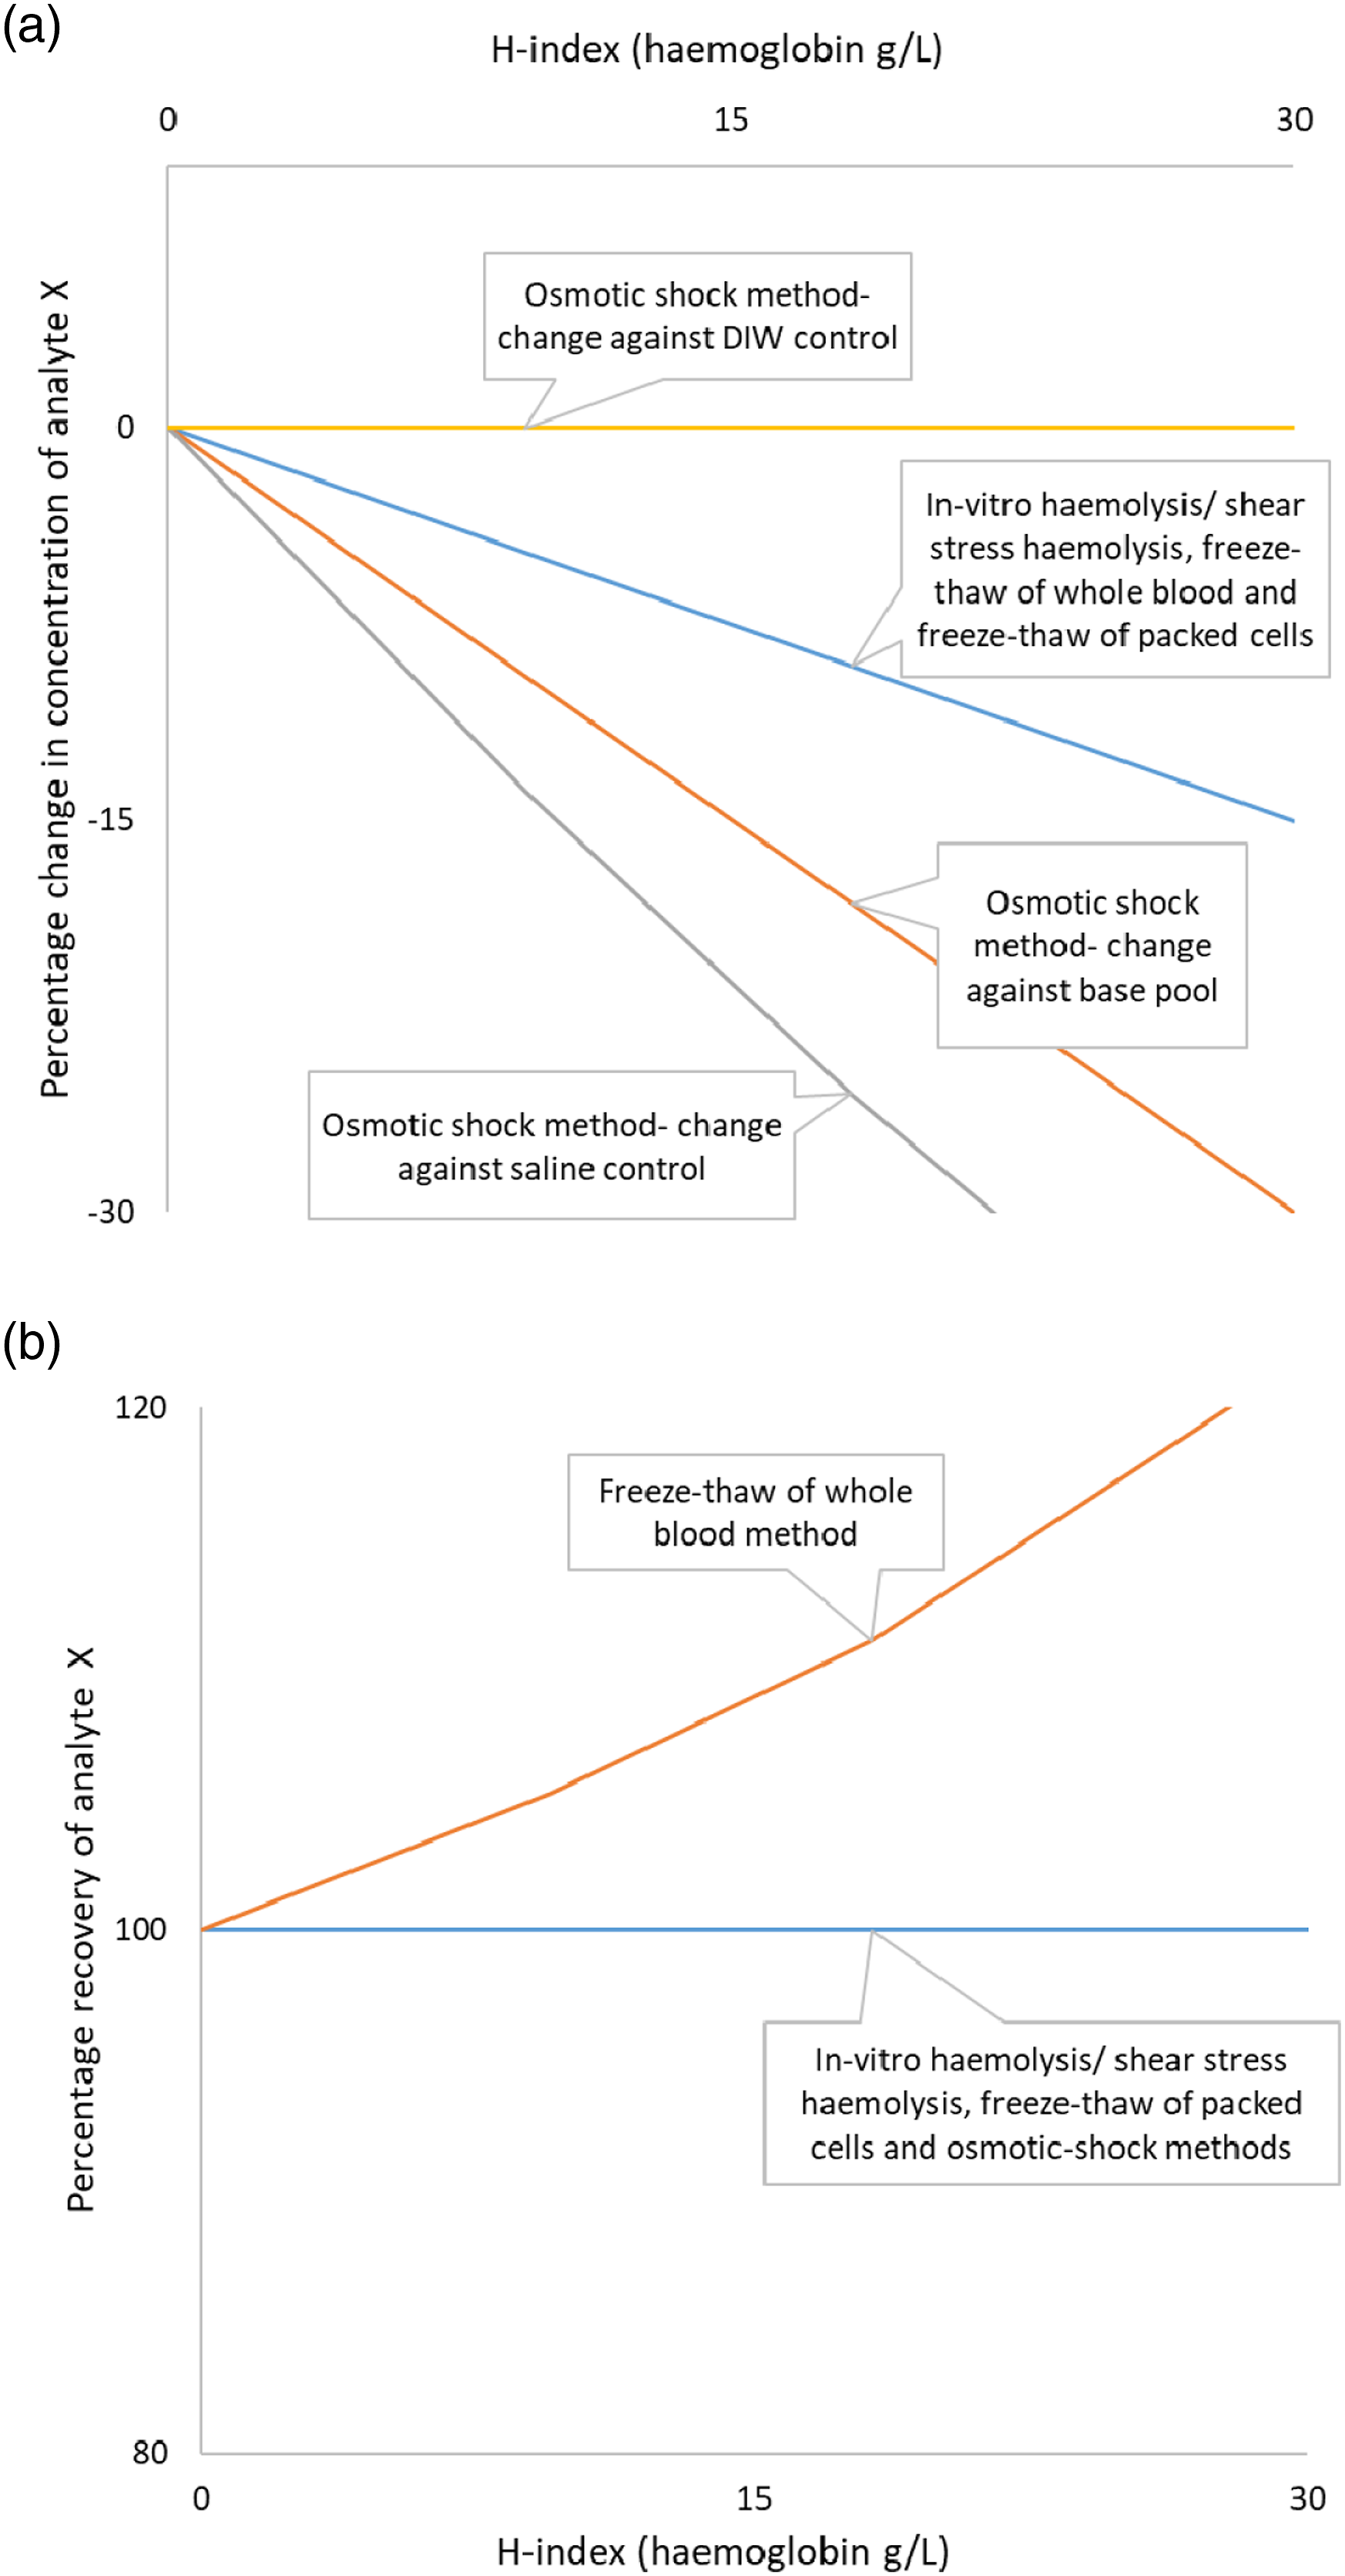
Laboratory study
Blood was collected into thirteen lithium heparin tubes (454084, Greiner, Austria) from a healthy male volunteer after obtaining informed written consent. Twelve samples were centrifuged at 1500 g for 10 min and the separated plasma pooled, stored at 2 to 8°C for 24 h and then aliquoted. Packed cells from one of these samples were used to prepare haemolysate by the CLSI-recommended osmotic shock haemolysis protocol. 6 The thirteenth blood sample was used to prepare haemolysate by the freeze–thaw protocol adapted from a previously described method. 9
The osmotic shock haemolysis protocol involved three saline washes of packed cells followed by osmotic shock lysis by the addition of an equal volume of DIW, thorough mixing and an overnight freeze. 6 The freeze–thaw method involved three freeze–thaw cycles of the whole blood sample in the lithium heparin tube. The first two cycles were a two-hour freeze at −20°C and one-hour thaw at room temperature and the third cycle was an overnight freeze at −20°C followed by a thaw at room temperature. Following cell lysis in both the protocols, samples were centrifuged and the supernatant haemolysates were used for interference studies. Haemoglobin in whole blood and each haemolysate was measured using a Sysmex XN-9000 (Sysmex, Kobe, Japan).
Using volunteer-pooled plasma, two separate sets of samples were spiked with an increasing amount of haemolysate (0, 12.5, 25, 37.5, 50, 75, 100, 150 and 200 µL in 500 µL plasma) using either the osmotic shock haemolysate or freeze–thaw haemolysate. Sodium and chloride by indirect ISE and H-index were measured in duplicate on an Abbott Architect c16000. The results from both the protocols were compared to the haemolysate-free plasma control to calculate percentage change compared to the base pool and percentage recovery. Additionally, as recommended in CLSI EP07-A2 protocol, 6 each osmotic shock haemolysate result was compared to respective control samples. Saline (sodium and chloride 154 mmol/L) and DIW controls were prepared by the addition of a volume equal to the amount of haemolysate spiked.
Inter-assay coefficient of variation (CV) for sodium was 0.58% at 123 mmol/L and 0.49% at 146 mmol/L, respectively. Inter-assay CV for chloride was 0.44% at 96 mmol/L and 0.68% at 119 mmol/L, respectively. Inter-assay CV for H-index was 0.5% at 3.38 and 0.3% at 17.64, respectively, and inter-assay CV for haemoglobin was 0.8% at 147 g/L. The numeric H-index on Abbott Architect represents haemoglobin concentration in g/L.
A change in sodium exceeding the reference change value (RCV) for unidirectional change with 99% probability was considered significant. The RCV was calculated by formula [21/2 * 2.33 * (CVa2 + CVi2)1/2]. 14 Analytical CV (CVa) of sodium and chloride used in the calculation was 0.49% and 0.44%, respectively. Median within-subject biological variation (CVi) for sodium and chloride was, respectively, 0.5% and 1.1% from the EFLM biological variation database. 15
Data were tabulated in Microsoft Excel (Microsoft Corporation) and statistical analyses were performed using IBM SPSS Statistics for Windows, version 25 (IBM Corp., USA). Data were non-parametric (Shapiro–Wilk test) and therefore Spearman rank correlation was used to measure the degree of association between variables. Changes in plasma sodium and chloride with a unit increase in the H-index for the two methods were compared by the Mann–Whitney U test. The threshold for statistical significance was 5%.
Results
Modelling experiment
The H-index was 18.2 (haemoglobin 18.2 g/L) in the sample haemolysed in vitro (Table 1). To achieve an H-index of 18.2, 1000 mL plasma sample aliquots would have to be spiked with 222 mL, 100 mL and 222 mL of haemolysate obtained from freeze–thaw of whole blood, freeze–thaw of packed cells and osmotic shock methods, respectively. The final plasma volume was 1100 mL for the in vitro haemolysed sample and sample spiked with freeze–thaw of packed cells and 1222 mL for the sample spiked with haemolysate from the other two methods.
The concentration of analyte X would be 90.9 mmol/L in the in vitro haemolysed sample/shear stress haemolysed sample and with freeze–thaw of whole blood and freeze–thaw of packed cells haemolysis methods. The concentration of X would, respectively, be 81.8 mmol/L, 109.8 mmol/L and 81.8 mmol/L in plasma spiked with haemolysate from osmotic shock method, plasma control for osmotic shock method spiked with saline and plasma control of osmotic shock method spiked with distilled water (Table 1). The concentration of analyte X would reduce by 9.1% with in vitro haemolysis/shear stress haemolysis, freeze–thaw of whole blood and freeze–thaw of packed cells. The concentration of X would reduce by 18.2% in the osmotic shock method when compared against the base pool and reduce by 25.5% when compared against control plasma spiked with saline and would be unchanged (0.0%) when compared against control plasma spiked with distilled water.
Recovery would be 100% for in vitro haemolysis and with freeze–thaw of packed cells and osmotic shock haemolysis methods. Recovery would be 111.1% for the aliquot spiked with haemolysate obtained by freeze–thaw of the whole blood.
Multiple virtual data points of paired H-index with percentage change and percentage recovery were derived after repeating the virtual experiment n = ∞ times. Per unit change in the H-index, the percentage decrease in analyte X concentration would be the same with routine in vitro haemolysis/shear stress, freeze–thaw of whole blood and freeze–thaw of packed cells methods and these would be lower compared to the osmotic shock procedure (Figure 1a). Recovery would be 100% with in vitro haemolysis/shear stress haemolysis, freeze–thaw of packed cells and osmotic shock methods. Recovery would increase with increasing haemolysis in the freeze–thaw of the whole blood method (Figure 1b).
Laboratory study
Haemoglobin concentration was 161 g/L, 155 g/L and 172 g/L in whole blood, haemolysate prepared by freeze–thaw of whole blood and haemolysate prepared by osmotic shock methods, respectively. The Abbott H-index correlated (ρ 1.000, p < 0.01, n = 17) with spiked haemoglobin between 0.0 and 49.1 g/L.
There was a proportional negative bias in sodium with increasing haemolysis in both methods (ρ −1.000, p < 0.01). The change in plasma sodium compared to the base pool per unit increase in H-index in the freeze–thaw method (−0.33 mmol, 95% CI −0.35 to −0.31) was less (p < 0.001) than the osmotic shock method (−0.65 mmol, 95% CI −0.66 to −0.64) (Figure 2a). Negative bias in sodium exceeding the RCV of 2.3% (99% probability to detect significant unidirectional change) occurred at an H-index 8.8 (95% CI 8.0–9.6), 4.5 (95% CI 4.1–4.9) and 2.7 (95% CI 1.7–3.7) in freeze–thaw of whole blood method, osmotic shock method compared against the base pool and osmotic shock method compared against the saline-spiked control, respectively. Positive bias in sodium exceeding the RCV of 2.3% occurred at an H-index of 16.7 (95% CI 9.7–19.4) in the osmotic shock method compared against the DIW-spiked control. Effect of haemolysis on plasma sodium (a) and chloride (b) by freeze–thaw method (Δ), osmotic shock method with comparison against the base pool (•), osmotic shock method with comparison against saline-spiked control (ο) and osmotic shock method with comparison against DIW-spiked control (x). Dashed horizontal lines indicate reference change value. Figures truncated at 10% change, −15% change and H-index of 30.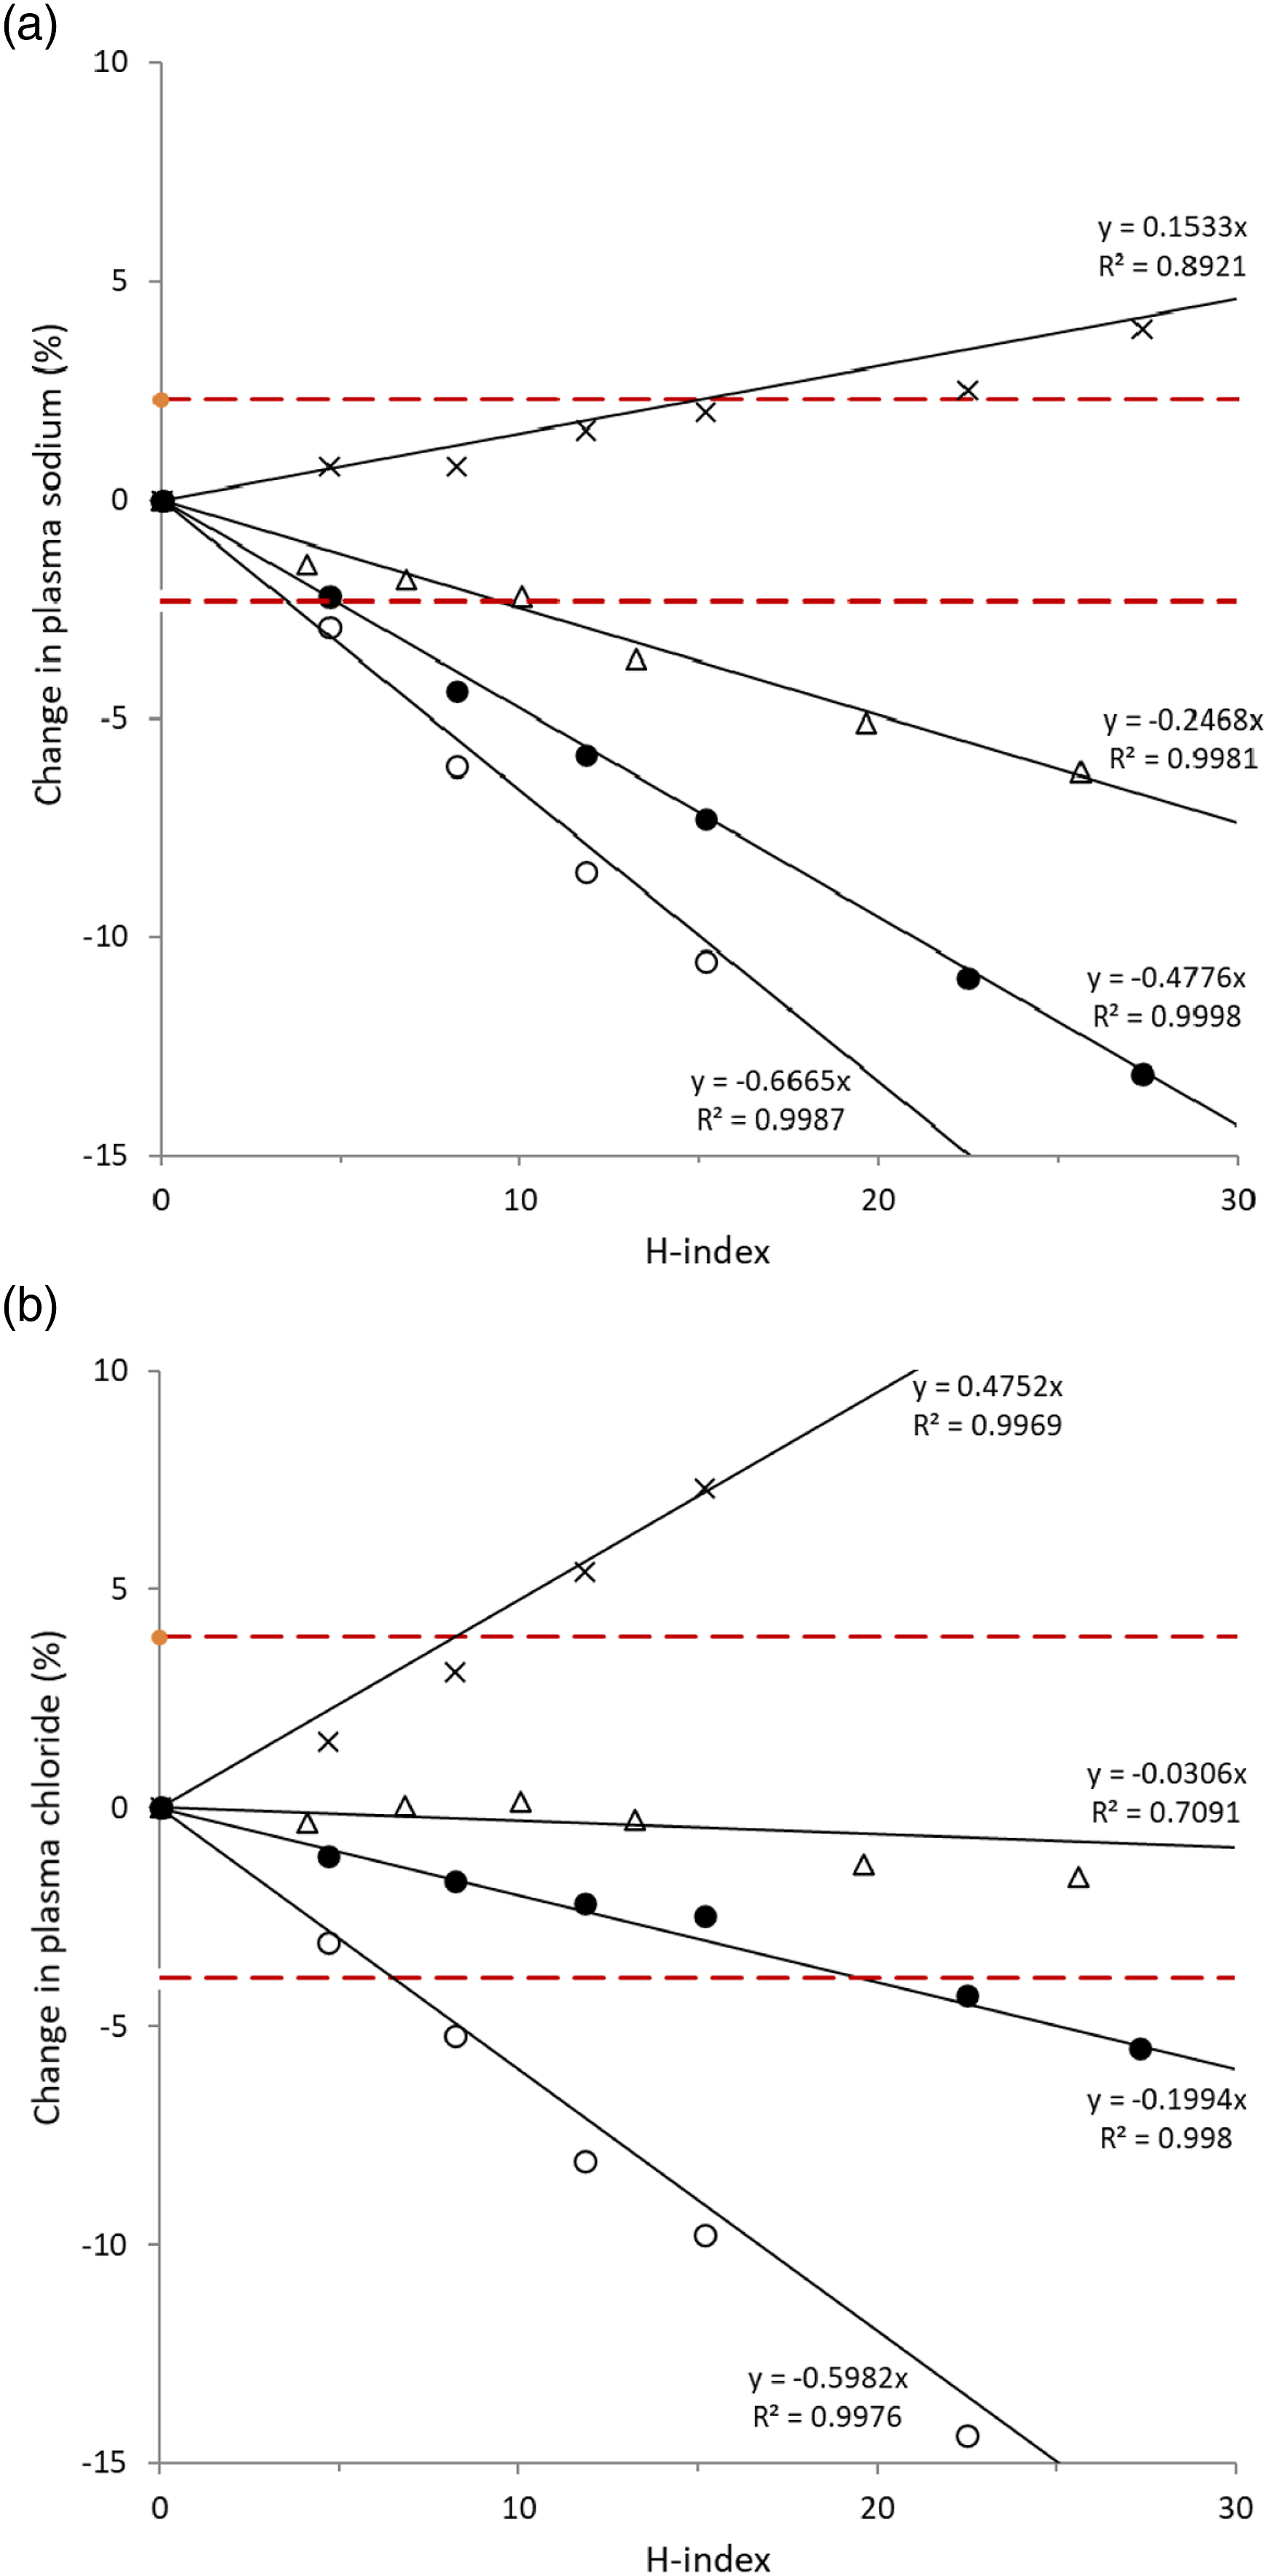
Plasma chloride did not change with haemolysis in the freeze–thaw method up to the maximum tested H-index of 44.6. Plasma chloride changed by −0.21 ± 0.01 mmol per unit increase in the H-index in the osmotic shock method when compared against the base pool (Figure 2b). Negative bias in chloride exceeding the RCV of 3.9% (99% probability to detect significant unidirectional change) occurred at an H-index 19.8 (95% CI 19.5–20.2) and 5.5 (95% CI 4.3–6.6) in the osmotic shock method compared against the base pool and osmotic shock method compared against the saline-spiked control, respectively. Positive bias in chloride exceeding the RCV of 3.9% occurred at an H-index of 9.1 (95% CI 7.9–10.1) in the osmotic shock method compared against the DIW-spiked control.
Percentage change and recovery of sodium and chloride at comparable H-index levels by freeze–thaw of whole blood and osmotic shock methods, and percentage change against respective saline and DIW controls for osmotic shock method (EP07-A2).
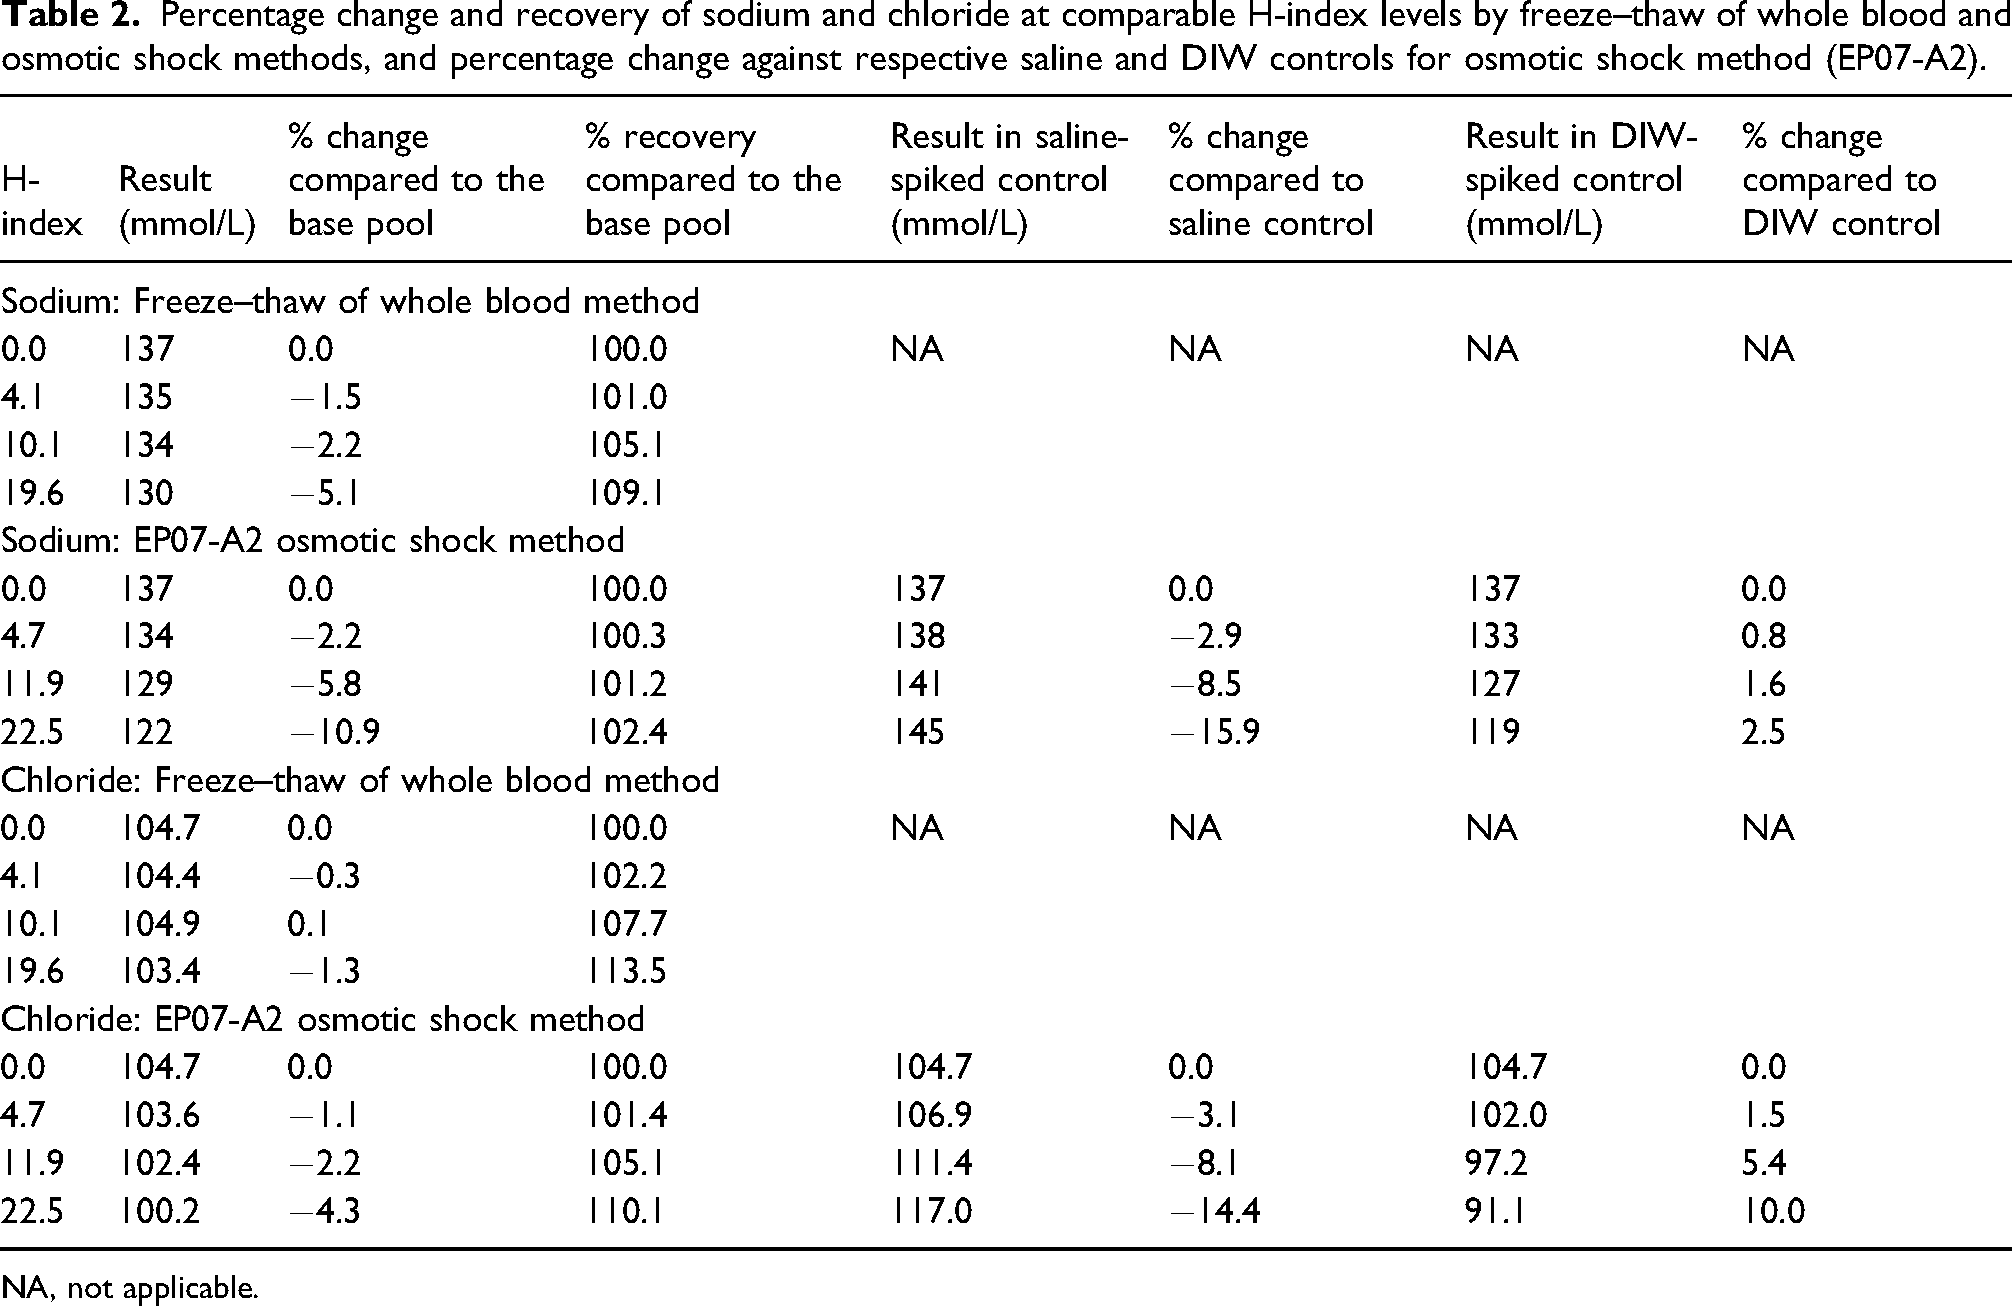
NA, not applicable.
Discussion
The effects of haemolysis on measured analytes are multifactorial and may be due to the release of haemoglobin or other intracellular substances or dilution caused by intracellular fluid or any combination of these factors. The effects of haemolysis due to spectral and chemical interference by haemoglobin10,16,17 and release of analytes with high intracellular concentration16,17 are well-recognised, but data on the effect of dilution on analytes with low intracellular concentrations are limited.5,9,10
Paired interference testing using the osmotic shock haemolysate protocol, adapted by the CLSI, 6 was developed to study analytical interference from ‘dissolved haemoglobin’. 8 In the protocol, therefore, dilution with DIW while preparing haemolysate was not considered of importance. 8 For parameters like sodium and chloride, however, which are under very tight physiological control, 18 even small differences in dilution could be of significance.
During haemolysis, released intracellular proteins including haemoglobin and lipids could affect indirect ISE measurement of electrolytes by the electrolyte exclusion effect. This interference, however, is small and the main effect of haemolysis on sodium measurement by indirect ISE (and the entire effect when measured by direct ISE) is due to the release of sodium deplete intracellular contents causing dilution.5,9
When analyte concentrations change during haemolysis due to their higher or lower intracellular concentration, EP07-A2 recommends measurement of the analyte in spiked and control samples by a method unaffected by haemoglobin. Measurement of sodium by direct ISE is not affected by haemoglobin or the electrolyte exclusion effect but despite that sodium goes down in haemolysis. The decrease in plasma sodium concentration with haemolysis is caused by dilution from the release of sodium-depleted intracellular contents. 5 Our laboratory and modelling experiments demonstrate that the osmotic shock procedure is unsuitable to study the effects of haemolysis on sodium and chloride because the DIW used for cell lysis results in additional dilution, and the equivalent volume of saline added to the control samples compounds the negative pseudo-interference. This may lead to erroneous adoption of lower H-index cut-offs.
The EP07-A2 haemolysate preparation procedure suggests preparation of control by the addition of an equivalent volume of saline to an aliquot of the same serum pool. The document, however, also recommends ‘prepare the control pool exactly as the test pool in all respects, except the test interferent is replaced with the same volume of solvent used to prepare the stock test pool’. 6 The only modification in the test pool in the EP07-A2 osmotic shock procedure is the addition of DIW. We, therefore, in addition to the control samples with saline, included control samples with DIW. The comparison against control with DIW (0% change in Table 1 and positive change in Table 2), however, compensates for dilution caused by haemolysis and therefore is also unsuitable. A 2.5% increase in sodium at an H-index 22.5, when compared against DIW-spiked control in the osmotic shock method (Table 2), indicates the release of a small amount of intracellular sodium. The osmotic shock method, by using DIW to lyse cells, alters the dilution seen in true haemolysis irrespective of whether the results are compared against the base pool or control with an equivalent volume of saline or DIW. An additional limitation of the osmotic shock haemolysate preparation procedure is the loss of contribution by leukocytes and platelets as these are removed when erythrocytes are saline washed following centrifugation. 3
Recovery, a requirement for method validation, is performed by spiking a sample with a known amount of analyte 19 and usually calculated as percentage recovery by the formula [(spiked result – base result) * 100/spike added]. 20 The artificially created spike has dilutional effects, for example, a serum sample spiked with a drug solution in methanol to assess recovery of the drug. This, however, does not apply to haemolytic effect studies as dilution should solely be due to haemolysis, provided an appropriate haemolysate preparation method is selected. Recovery formulae compensating for dilution caused by haemolysis incorrectly suggests an increase in sodium and chloride concentrations with increasing haemolysis. A 102.4% recovery for sodium at an H-index of 22.5 by the osmotic shock method (Table 2), again indicates the release of a small amount of intracellular sodium increases total sodium content in the plasma but may be misinterpreted as a positive influence. On the contrary, haemolysis exerts a negative influence as sodium concentration decreases with haemolysis due to dilution from the release of intracellular fluid. This is evident from the modelling experiment where, since the intracellular analyte concentration was 0 mmol/L, the recovery remained 100% with increasing haemolysis (Figure 1b).
Abbott diagnostics, using the CLSI protocol, 6 reported 102.1% and 104.5% of target for sodium and 106.2% and 112.1% of target for chloride at haemoglobin concentrations of 10 and 20 g/L, respectively. 12 We found recoveries of 101.2% and 102.4% for sodium and 105.1% and 110.1% for chloride at comparable H-indices of 11.9 and 22.5, respectively. It is likely that interference studies performed by Abbott were for several analytes simultaneously 13 which could have led to the use of recovery calculation to correct for dilution which would have been appropriate for analytes involving artificial spikes but inappropriate for dilution due to haemolysis.
Summary of manufacturer’s haemolytic interference (effect) studies for serum sodium on a few commonly used chemistry equipment.
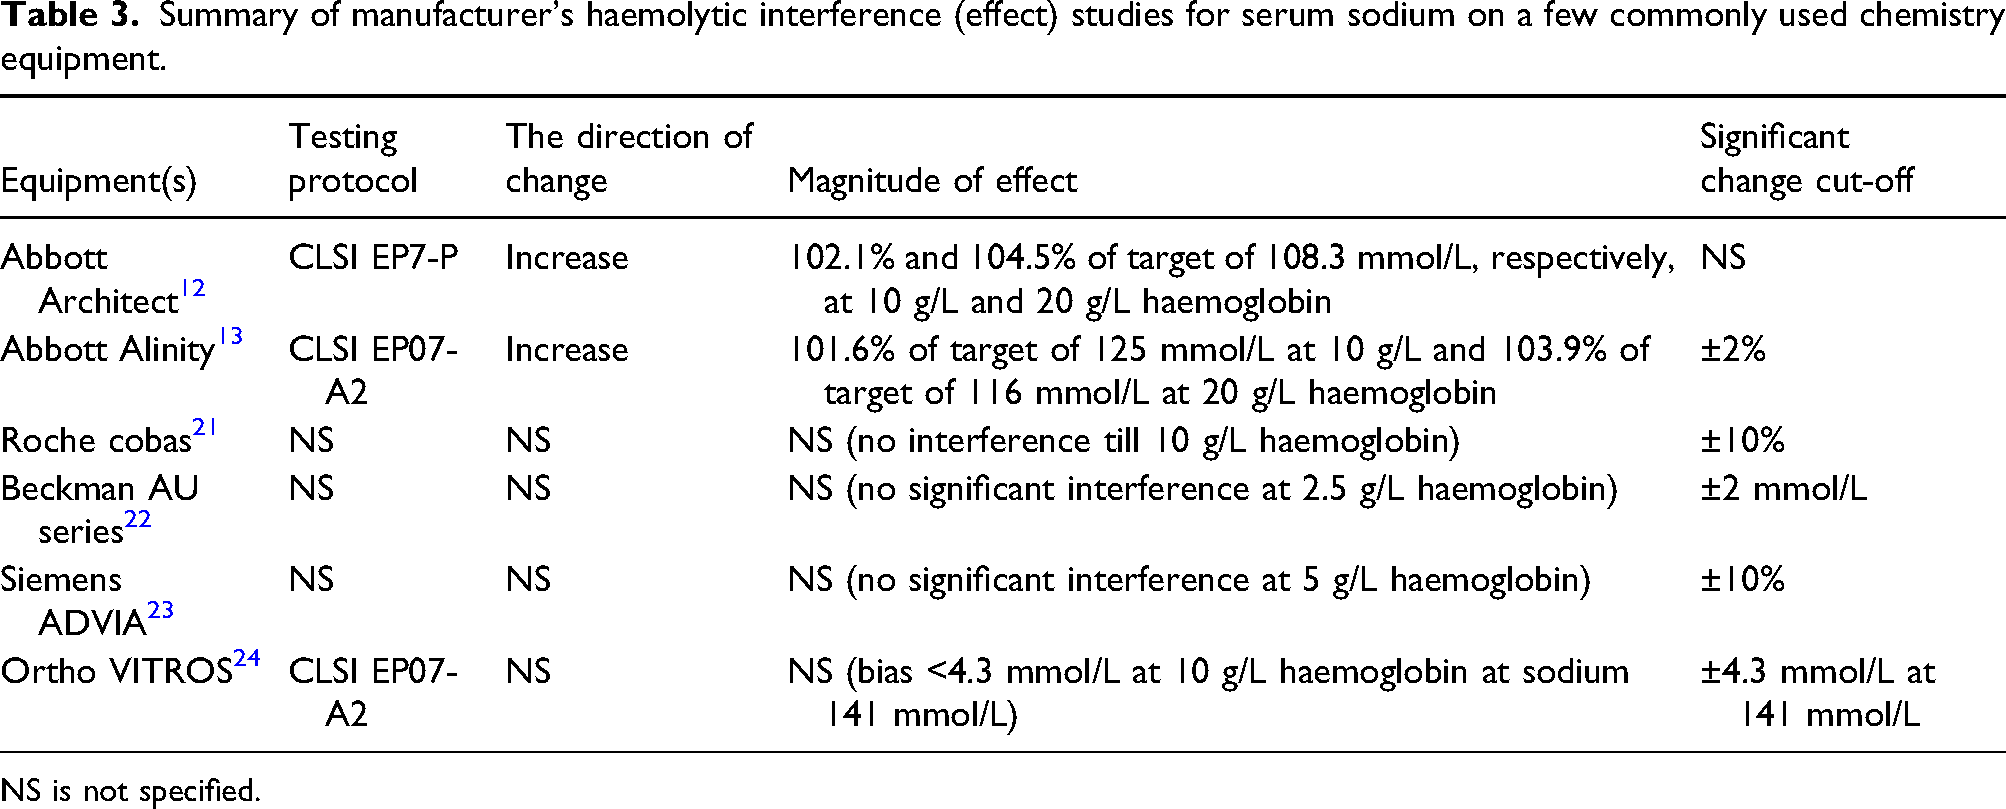
NS is not specified.
Since erythrocyte chloride concentration is approximately 50 mmol/L, a decrease in plasma chloride would be expected with increasing haemolysis as previously reported. 10 In this study, however, plasma chloride did not change with increasing H-index using the freeze–thaw protocol (Table 2). In another experiment using the freeze–thaw of whole blood method, there was a decrease in plasma chloride with increasing haemolysis when measured using direct ISE on the RAPIDPoint 500 (Siemens, Germany) and indirect ISE on Roche cobas c 513 (Roche Diagnostics, Germany) but, unexpectedly, not when measured using indirect ISE on the Abbott Architect and Abbott Alinity (Abbott Laboratories, USA) (unpublished data), which we are unable to explain but it is likely to be due to assay design. The decrease in chloride using the osmotic shock protocol was expected firstly due to dilution by DIW when results are compared against the base pool and secondly due to increased chloride concentration in the control when the results were compared against the saline-spiked control.
The laboratory experiment demonstrates that the results from the osmotic shock haemolysis procedure are different to the freeze–thaw haemolysis method. It is the modelling experiment, however, that extends the comparison of different haemolysis methods to in vitro haemolysis in routine laboratory samples. The results of the modelling experiment emphasise additional bias introduced by the use of DIW in the osmotic shock procedure which makes this method unrepresentative of in vitro haemolysis in routine samples and incomparable to shear stress haemolysis, freeze–thaw of whole blood and freeze–thaw of packed cells haemolysis methods. This incomparability persists irrespective of whether results are compared with the base pool, saline-spiked control or DIW-spiked control. Haemolysate obtained by freeze–thaw cycles of heparinized whole blood, freeze–thaw cycles of packed cells or shear stress methods, where blood is cycled through a needle, are better suited for interference studies as they more closely mimic in vitro haemolysis. The latter two methods, however, have poor reproducibility9,25 and therefore were not included in our laboratory experiment.
Finally, it is assumed that cellular stroma is completely removed from haemolysed cells when centrifuged 8 and therefore the assumption that the relationship of released haemoglobin and haemolytic effects in experimental studies would be the same as in routine in vitro haemolysis. Haemolytic experimental studies, especially the freeze–thaw 9 and osmotic shock 8 protocols, achieve near-complete cell lysis which may not be representative of in vitro haemolysed samples routinely received by laboratories. The ratio of released haemoglobin and other intracellular contents could, therefore, be different in routine samples compared to experimental samples, and this requires further study.
In summary, we report that osmotic shock protocol and use of recovery calculations are not suitable for studying the effect of haemolysis. This is particularly relevant for analytes with low intracellular concentrations where the haemolytic effect is primarily due to dilution. We describe a standardised protocol, adapted from Delgado et al. 9 for reproducible haemolysate preparation using freeze–thaw of whole blood to achieve near-complete lysis. We also suggest the term ‘effect of haemolysis’ should replace ‘interference by haemoglobin’ when presenting the findings of haemolytic studies.
Footnotes
Declaration of conflicting interests
The author(s) declared no potential conflicts of interest with respect to the research, authorship, and/or publication of this article.
Funding
The author(s) received no financial support for the research, authorship, and/or publication of this article.
Ethical approval
Institution registered and approved service evaluation with the Royal Wolverhampton NHS Trust (Wolverhampton, UK) with ID 5448.
Guarantor
RG.
Contributorship
TK and HG conceived the project and designed the service evaluation. TK collected samples from HG after obtaining informed written consent. HG and TK analysed samples. TK analysed the data and wrote the first draft of the manuscript. All authors critically reviewed, revised and approved the final version.