
Abstract
Background
For a better assessment of thyroid function, each laboratory should establish its own reference intervals (RI). In Lebanon, no previous study has been conducted to establish the reference values for thyroid function tests.
Methods
This cross-sectional study included 301 volunteers aged between 18 and 65 years (65.8% women, 34.2% men), free from any thyroid pathology and any condition that could affect thyroid function tests. The reference intervals of thyroid-stimulating hormone (TSH), free T4 (FT4), free T3 (FT3), and total T3 (TT3) were measured on the Roche Cobas e411 machine. 39 subjects tested positive for thyroid peroxidase antibodies (TPOAb) and/or thyroglobulin antibodies (TGAb), were excluded from the study.
Results
There was an increase in the 2.5th percentile for the TSH compared to the value provided by the manufacturer (from 0.27 to 0.53 mlU/L) as well as a decrease in the 97.5th percentile for the FT4, TT3, and FT3 (respectively, from 22 to 19.78 pmol/L for FT4, from 3.1 to 2.71 nmol/L for TT3, and from 6.80 to 6.10 pmol/L for FT3). Higher TT3 and FT3 values were noted in men compared to women (respectively, p = 0.068 and p < 0.0001). An age decrease in FT4 and FT3 was also observed (respectively, p = 0.045 and p < 0.0001).
Conclusion
The established RI of thyroid function tests for the Lebanese population were significantly different from the values recommended by the manufacturer (Roche Diagnostics). Changing our RI values will allow a more accurate diagnosis of thyroid dysfunction.
Introduction
Thyroid dysfunction is very common in the general population. Results from the National Health and Nutrition Examination Survey (NHANES III) revealed that 4.6% of the United States (US) population had hypothyroidism, of which 4.3% were subclinical and 1.3% had hyperthyroidism of which 0.7% were subclinical. 1
In current practice, diagnosing thyroid dysfunction is easy in symptomatic patients with suggestive thyroid function tests. The problem arises with subclinical hyper and hypothyroidism. In these cases, the patient is usually asymptomatic and peripheral thyroid hormones are within the normal reference intervals (RI). Thyroid-stimulating hormone (TSH) is the cornerstone of thyroid dysfunction diagnosis; its value is beyond the upper limit of the RI in subclinical hypothyroidism or below its lower limit in subclinical hyperthyroidism. In addition, free thyroxine (FT4) is useful for the diagnosis of overt hypo- or hyperthyroidism, while T3 tests (total triiodothyronine (TT3) or free triiodothyronine (FT3)) are useful to diagnose only hyperthyroidism and to determine its severity. 2
Laboratory assessment of thyroid function, especially TSH, varies with age,3–5 sex, 6 ethnicity,1,5 time of day collection, 6 and type of used assay. 7 Therefore, reference values of these tests should be established for every population and every laboratory based on an adult population free from any thyroid disease or other medical conditions that may affect thyroid function tests.
In clinical practice, RI are essential for evaluating the results of the thyroid function tests, including the levels of TSH, FT4, FT3, and TT3. The RI are established by considering the 2.5th and 97.5th percentiles of the values obtained in a reference population. Two approaches exist to determine the RI. The first one is called the direct method. It is the most commonly used, and is based on the recruitment and selection of control subjects. Although expensive, this method is more accurate because it relies on strict exclusion criteria. Several such studies have been carried out in different countries.1,8–10 The company Roche also established their own RI. 11 Another so-called indirect method has been adopted in France 12 and China 13 in order to determine the RI of thyroid function tests. This method is based on laboratory archive values for outpatients. It is a retrospective, inexpensive method that can be performed on a large population.
Most of the clinical laboratories use the RI proposed by the manufacturer, which are mainly based on data from Western populations. The National Academy of Clinical Biochemistry argued that each laboratory and population should establish its own RI.14,15
In Lebanon, the determination of RI for thyroid function tests has been the subject of a single study carried out in the pediatric population. In that study, 5% of the Lebanese pediatric population had a TSH > 5 mIU/L, and the mean TSH values were higher compared to the reference values provided by the manufacturer. 16
The purpose of this cross-sectional study was to determine the RI of TSH, FT4, FT3, and TT3 in the Lebanese adult population using the Roche Cobas e411 assay.
Materials and methods
Population
This is a cross-sectional study carried out on a sample of healthy volunteers aged between 18 and 65 years. Blood samples were taken at the Hôtel-Dieu de France laboratory between October 2020 and January 2021 among healthy hospital visitors and employees. • Data were recorded through both an interview and a questionnaire. Exclusion criteria were the following: age < 18 years old or > 65 years old; pregnancy, childbirth less than a year ago, or breastfeeding; history of thyroid disease such as thyroid dysfunction, thyroid nodule or cancer, goiter, or thyroid surgery; and chronic diseases such as chronic renal failure, chronic heart failure, chronic liver failure, cancer, autoimmune or inflammatory diseases, or psychiatric diseases. Subjects taking a drug that can affect thyroid tests such as thionamides, levothyroxine, amiodarone, lithium, anticonvulsants, beta blockers, glucocorticoids, salicylates, nonsteroidal anti-inflammatory drugs, heparin, furosemide, contraceptive pill, or biotin were also excluded from the study. The use of iodinated contrast media during the last month, current hospitalization, hospitalization during the last month, daily alcohol consumption, or excessive alcohol consumption were also exclusion criteria. • On the day of collection, participants’ weight and height were collected. Body mass index (BMI) was calculated using the formula weight/(height)2, with weight expressed in kilograms and height in meters. The weight was taken on the same scale, with light clothing, and the height was measured without shoes. BMI was divided into three subclasses: underweight for BMI < 18 kg/m2, normal weight for BMI between 18 and 25 kg/m2, overweight for BMI between 25 and 30 kg/m2, and obese for a BMI superior to 30 kg/m2. An informed consent was signed by each participant. The study had the approval of the ethics committee of Hôtel-Dieu de France hospital (CEHDF1524).
Biological analysis
Fasting blood samples were taken from all subjects between 6 a.m. and 1 p.m. Centrifugation of the blood samples was performed on the day of collection, and the serum was then frozen at −20°C for a maximum of 2 months and analyzed in January 2021. The serum TSH, FT4, TT3, FT3, thyroperoxidase antibodies (TPOAb), and thyroglobulin antibodies (TGAb) were assayed on the Cobas Roche automated electrochemiluminescent immunoassay analyzers e411 (ECLIA, Roche Diagnostics, Mannheim, Germany). The RI provided by the manufacturer for the TSH assay was from 0.27 to 4.2 mIU/L, and the functional sensitivity was 0.014 mIU/L. The RI provided by the manufacturer were 12–22 pmol/L for FT4, 1.3–3.1 nmol/L for TT3, and 3.1–6.8 pmol/L for FT3.
TPOAb and TGAb were measured by a competitive technique. The respective normal values provided by the manufacturer are less than 34 and 115 IU/mL and the respective lower limits of detection are 5 and 10 IU/mL.
Reliability of all the measurement results was regularly checked through the assessment of appropriate controls and application of internal quality control principles. The respective coefficient of variation (CV) of TSH, FT4, TT3, and FT3 were 5.2%, 5.4%, 5.1%, and 3.5%.
Statistical analysis
The variables were entered in an Excel file. Statistical analysis was performed using IBM SPSS (IBM Corp; SPSS Statistics for Windows v26.1, Armonk, NY, USA). The distribution of biological values (TSH, FT4, TT3, FT3, TPOAb, and TGAb) was verified using the Shapiro–Wilk (SW) tests, with an additional visual inspection of the quartilequartile (QQ) charts. Native variables with a non-normal distribution were expressed as the median with its interquartile range (quartile 1 to quartile 3), and percentiles, 2.5% and 97.5%, using the weighted definition R6 of Hyndman and Fan. 17 95% confidence intervals for reference ranges were calculated on the log-transformed variables (for TSH, FT4, TT3, and FT3) using the t-distribution with the appropriate degrees of freedom, and then transformed back to the native variables. 18 The correlations between the variables were estimated using the Spearman correlation coefficient, and its 95% confidence intervals were built by bootstrapping (n = 10,000). The differences between the reference ranges and the external references were assessed based on the position of the latter relative to the 95% CI. The differences between the reference ranges between different categories within the current study were judged by inspecting the overlapping (or its absence) of the respective 95% CIs
The t-test was used to compare the normally distributed variables, while the MannWhitney U test was used to compare variables not normally distributed. The chi-squared test was used to compare proportions. The TPOAb and TGAb values initially reported as < 5 IU/ml and < 10 IU/ml, respectively, were considered to be 4IU/ml and 9 IU/ml, respectively.
Results
General population
The population consisted of 301 subjects aged between 18 and 65 (103 men (34.2%) and 198 women (65.8%)). The mean age was 39.0 ± 13.3 years (39.1 ± 13.6 for men and 39.0 ± 13.1 for women) with no significant difference according to sex (p = 0.95). The median BMI was 24.61 [21.76–28.41] kg/m2, with higher values in men than women (26.53 [23.67–29.38] vs 23.71 [21.16–27.89 kg/m2, p < 0.001) with 43.7% of them being overweight.
Establishment of the reference population
The determination of the reference population was carried out after exclusion of subjects having a positivity for at least one of the two autoantibodies, TPOAb and TGAb. A total of 39 volunteers tested positive for at least one of these two autoantibodies. The reference population was therefore made up of 262 subjects (166 women and 96 men). The respective prevalence of TPOAb and TGAb positivity in our population is 8% and 10% (24 and 30 subjects, respectively). Only 15 volunteers were tested positive for both autoantibodies (11 women and 4 men).
Distribution of the different biological parameters in the reference population
Values of TSH, FT4, TT3, and FT3 in the total population and according to the presence or absence of TPOAb and TGAb (Reference population).
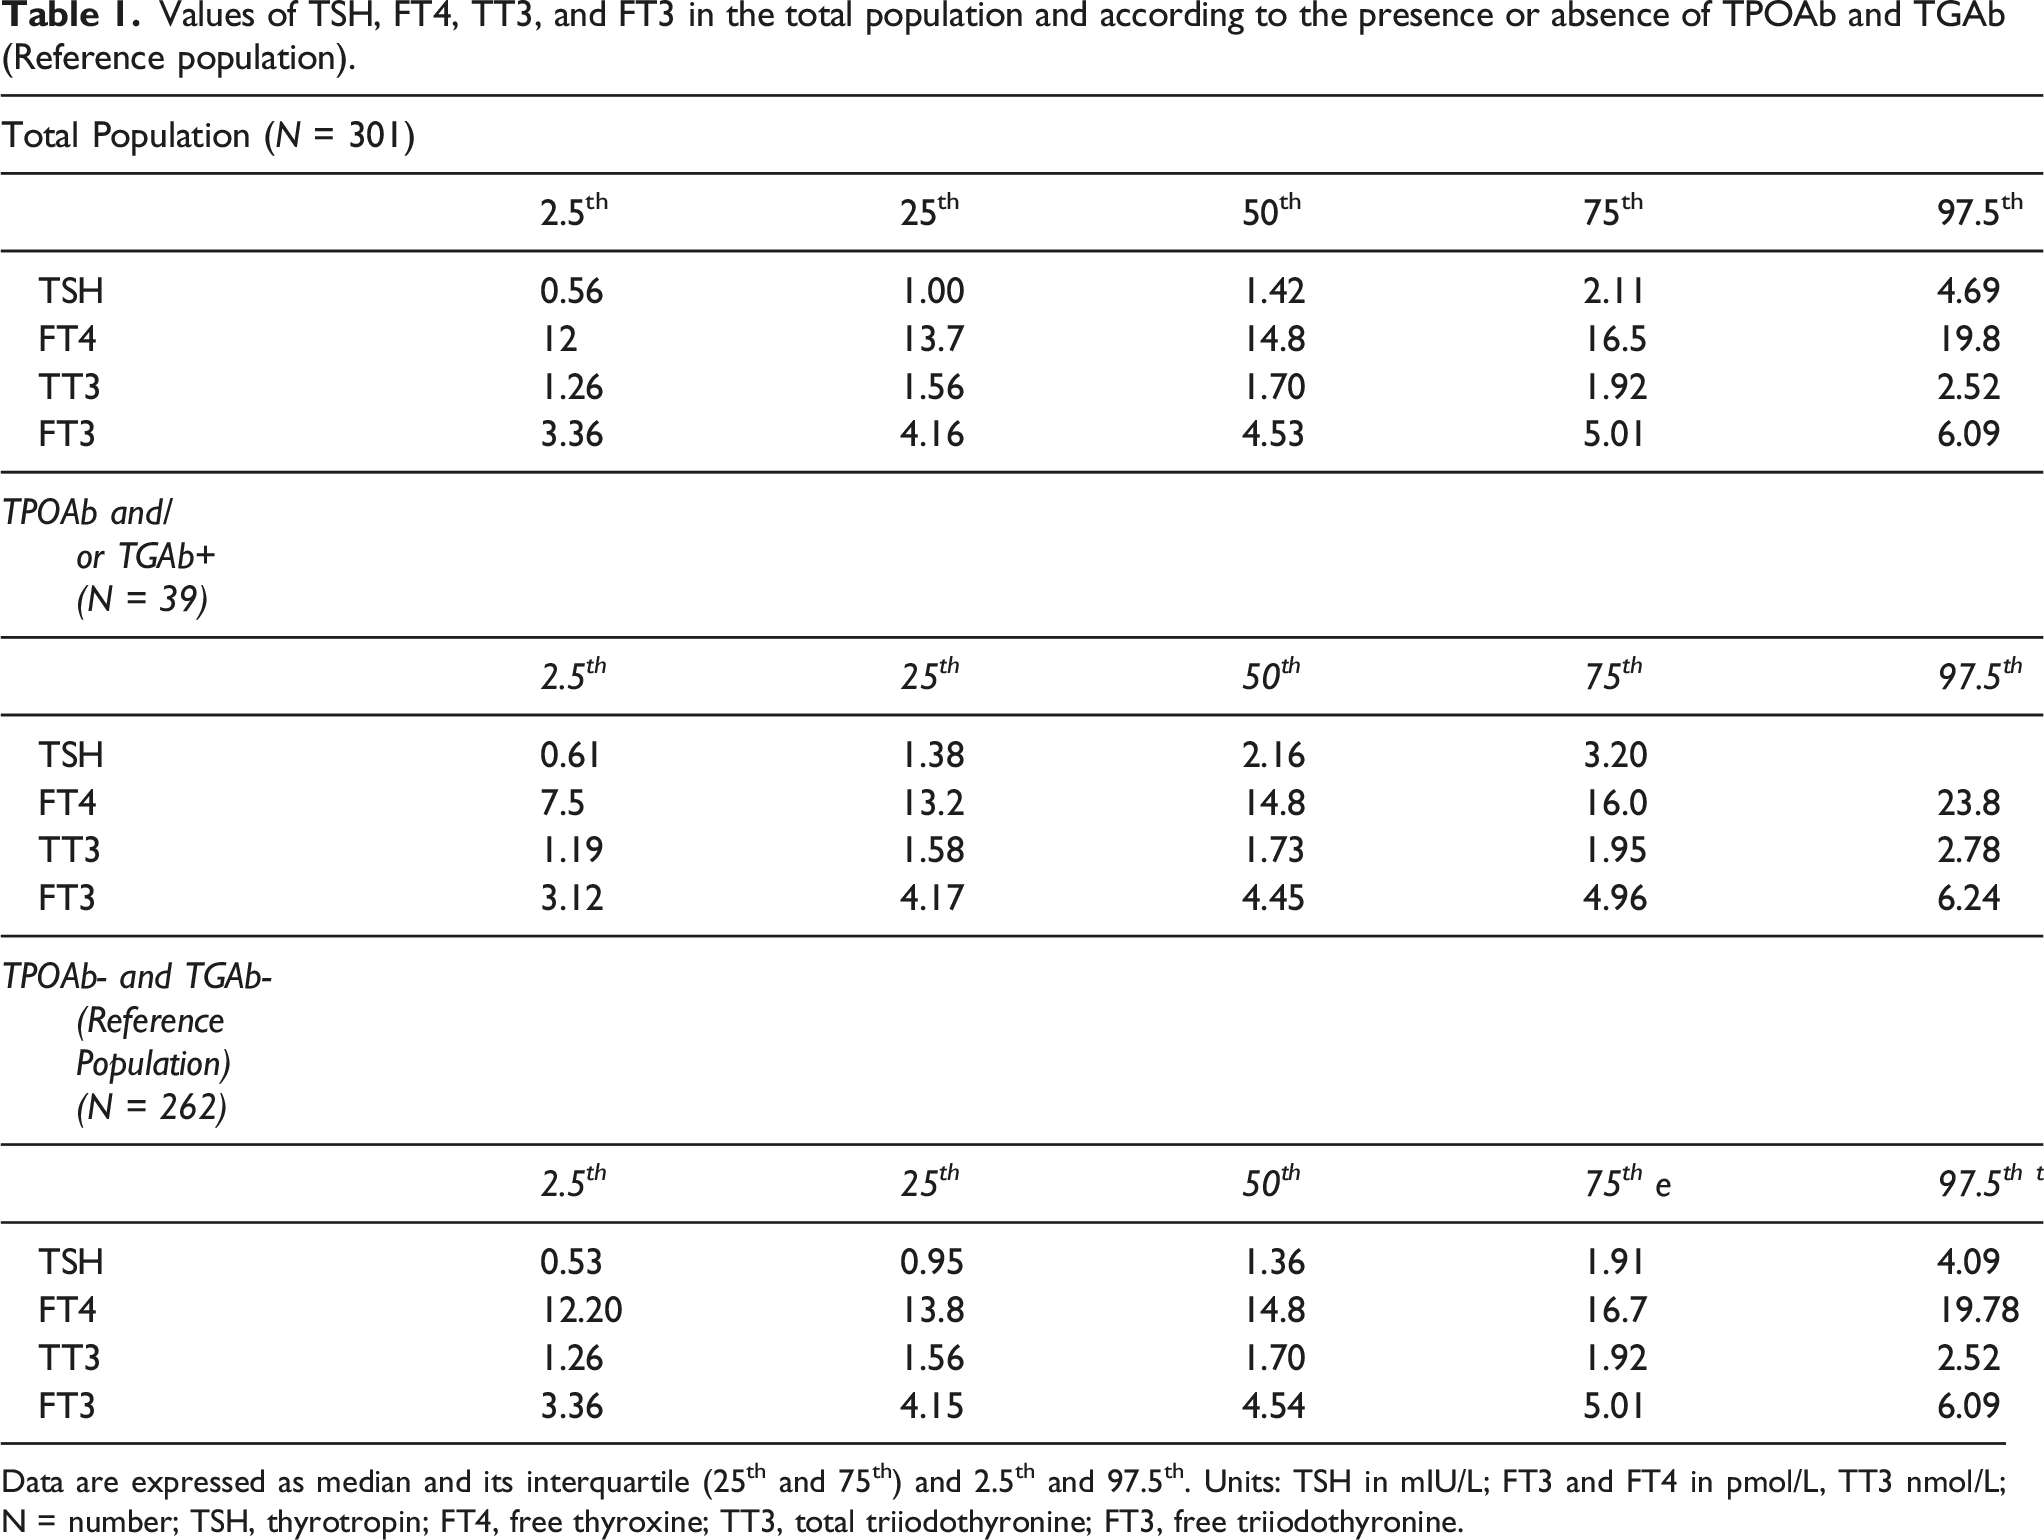
Data are expressed as median and its interquartile (25th and 75th) and 2.5th and 97.5th. Units: TSH in mIU/L; FT3 and FT4 in pmol/L, TT3 nmol/L; N = number; TSH, thyrotropin; FT4, free thyroxine; TT3, total triiodothyronine; FT3, free triiodothyronine.
The TSH RI was 0.53 (95% CI: 0.50–0.56) to 4.09 (95% CI: 3.85–4.35) mIU/L with a median of 1.36 mIU/L. Six cases were reported above the upper limit of RI and 6 cases below. The FT4-RI was 12.20 (95% CI: 12.01–12.39) to 19.78 (95% CI: 19.47–20.08) pmol/L with a median of 14.81 pmol/L. The respective RI of TT3 and FT3 were 1.26 (95% CI: 1.24–1.29) to 2.48 (95% CI: 2.47–2.57) nmol/L and 3.36 (95% CI: 3.30–3.42) to 6.07 (95% CI: 5.98–6.20) pmol/L (respective median, 1.70 nmol/L and 4.54 pmol/L).
Distribution of thyroid function tests according to gender, age categories, and BMI categories
Thyroid parameters according to gender.
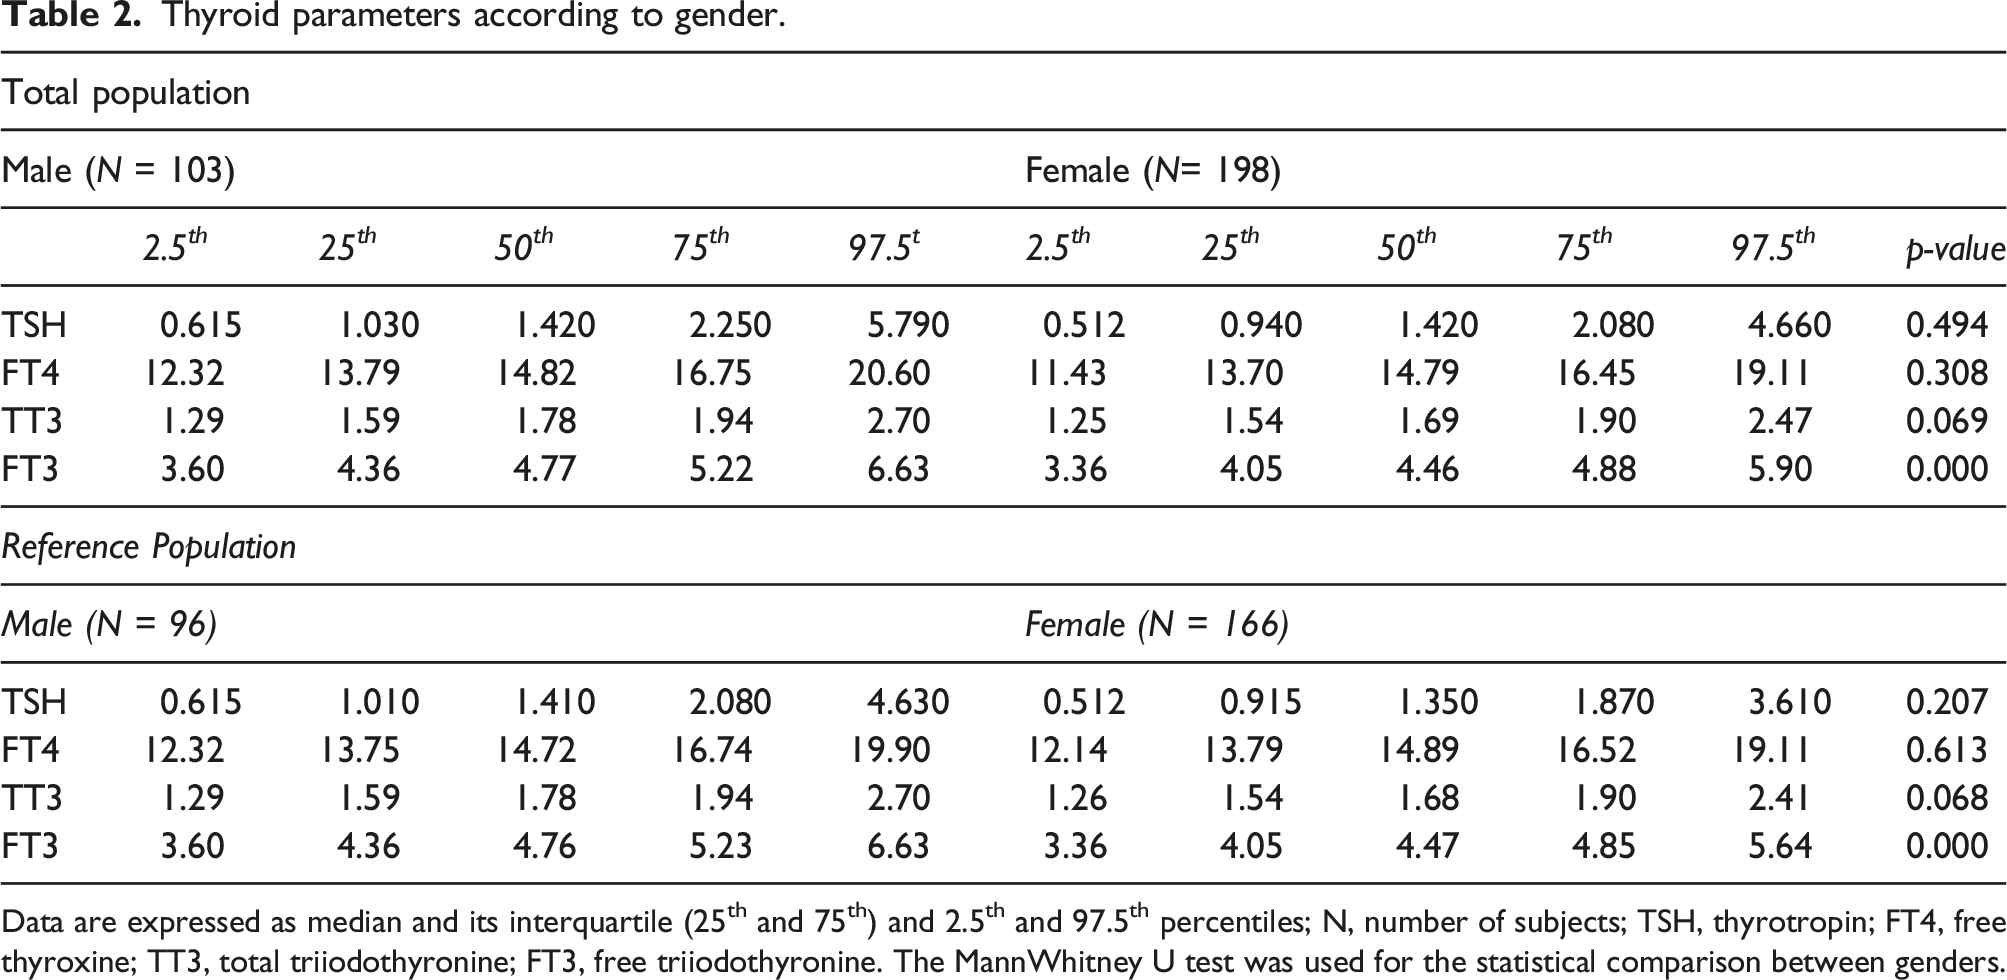
Data are expressed as median and its interquartile (25th and 75th) and 2.5th and 97.5th percentiles; N, number of subjects; TSH, thyrotropin; FT4, free thyroxine; TT3, total triiodothyronine; FT3, free triiodothyronine. The MannWhitney U test was used for the statistical comparison between genders.
Thyroid parameters according to age groups for the reference population.
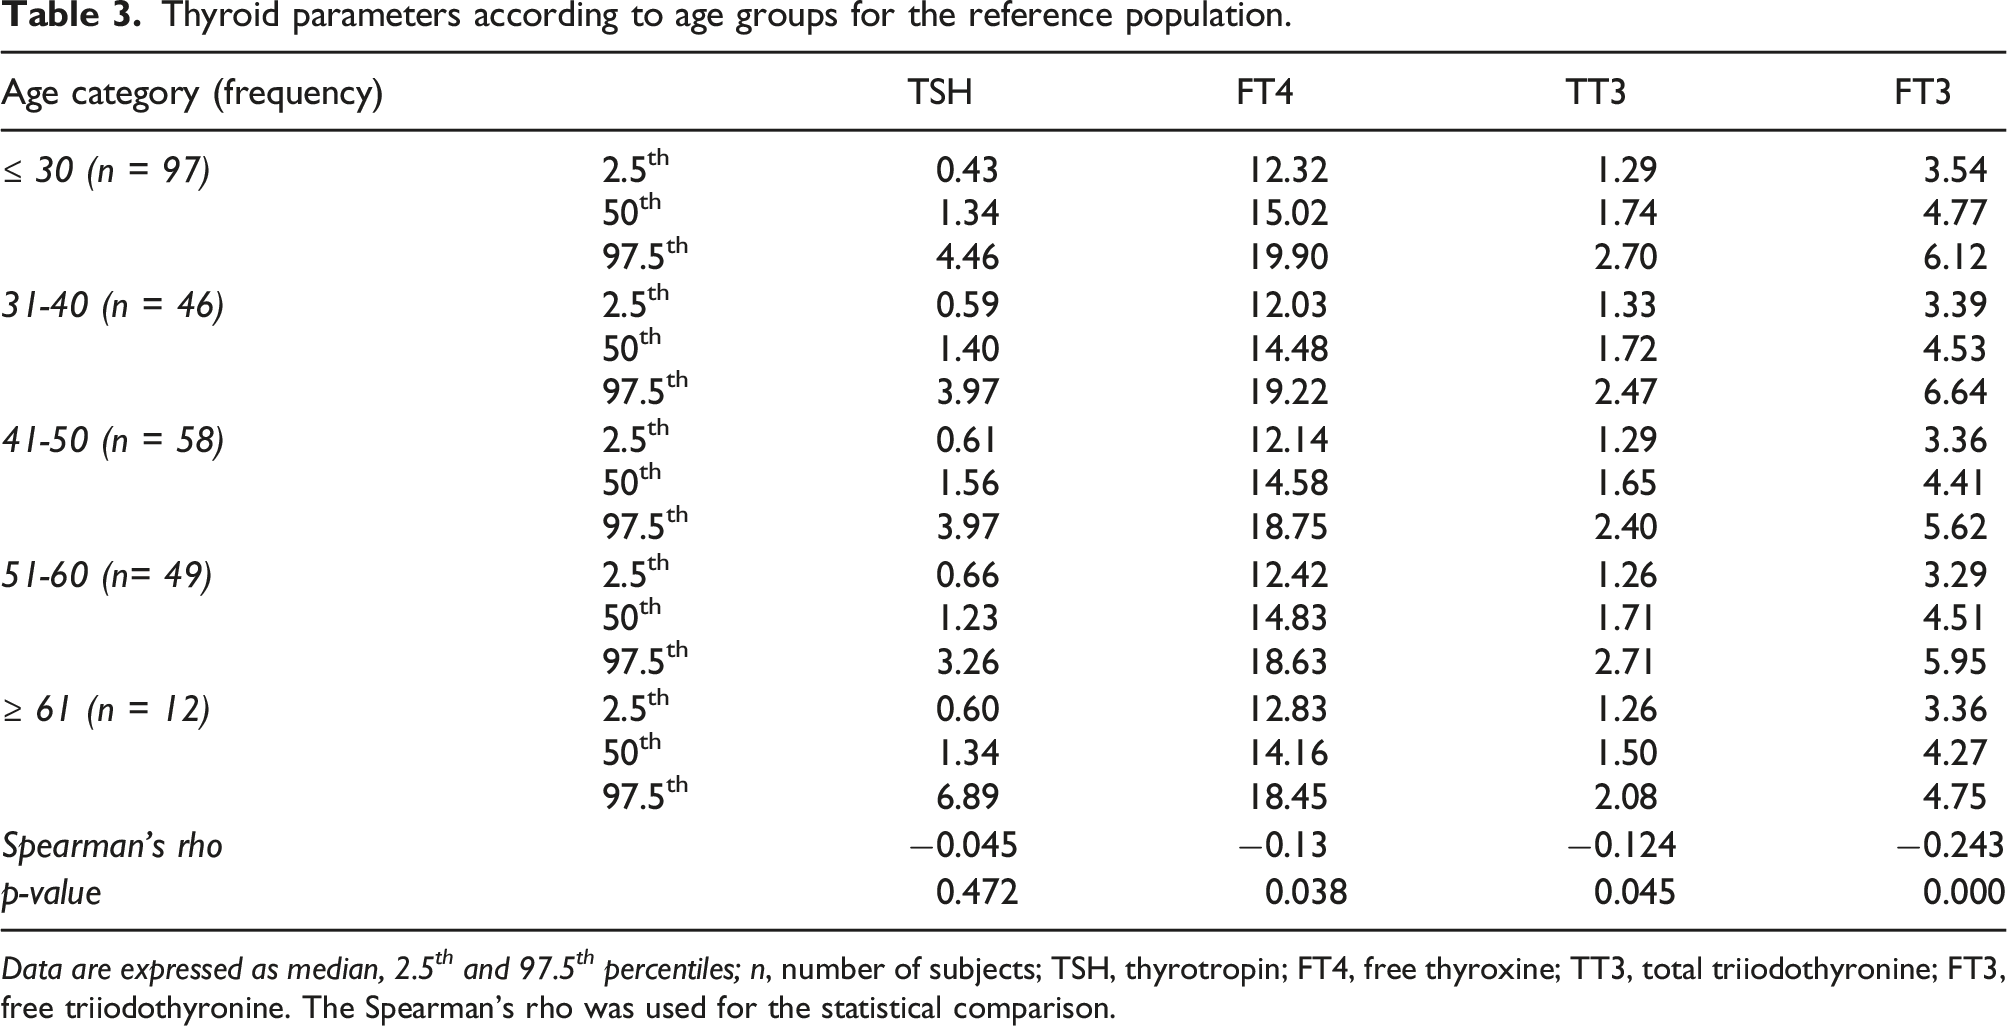
Data are expressed as median, 2.5 th and 97.5 th percentiles; n, number of subjects; TSH, thyrotropin; FT4, free thyroxine; TT3, total triiodothyronine; FT3, free triiodothyronine. The Spearman’s rho was used for the statistical comparison.
Values of TSH, FT4, TT3, and FT3 in the total and reference population by BMI category.
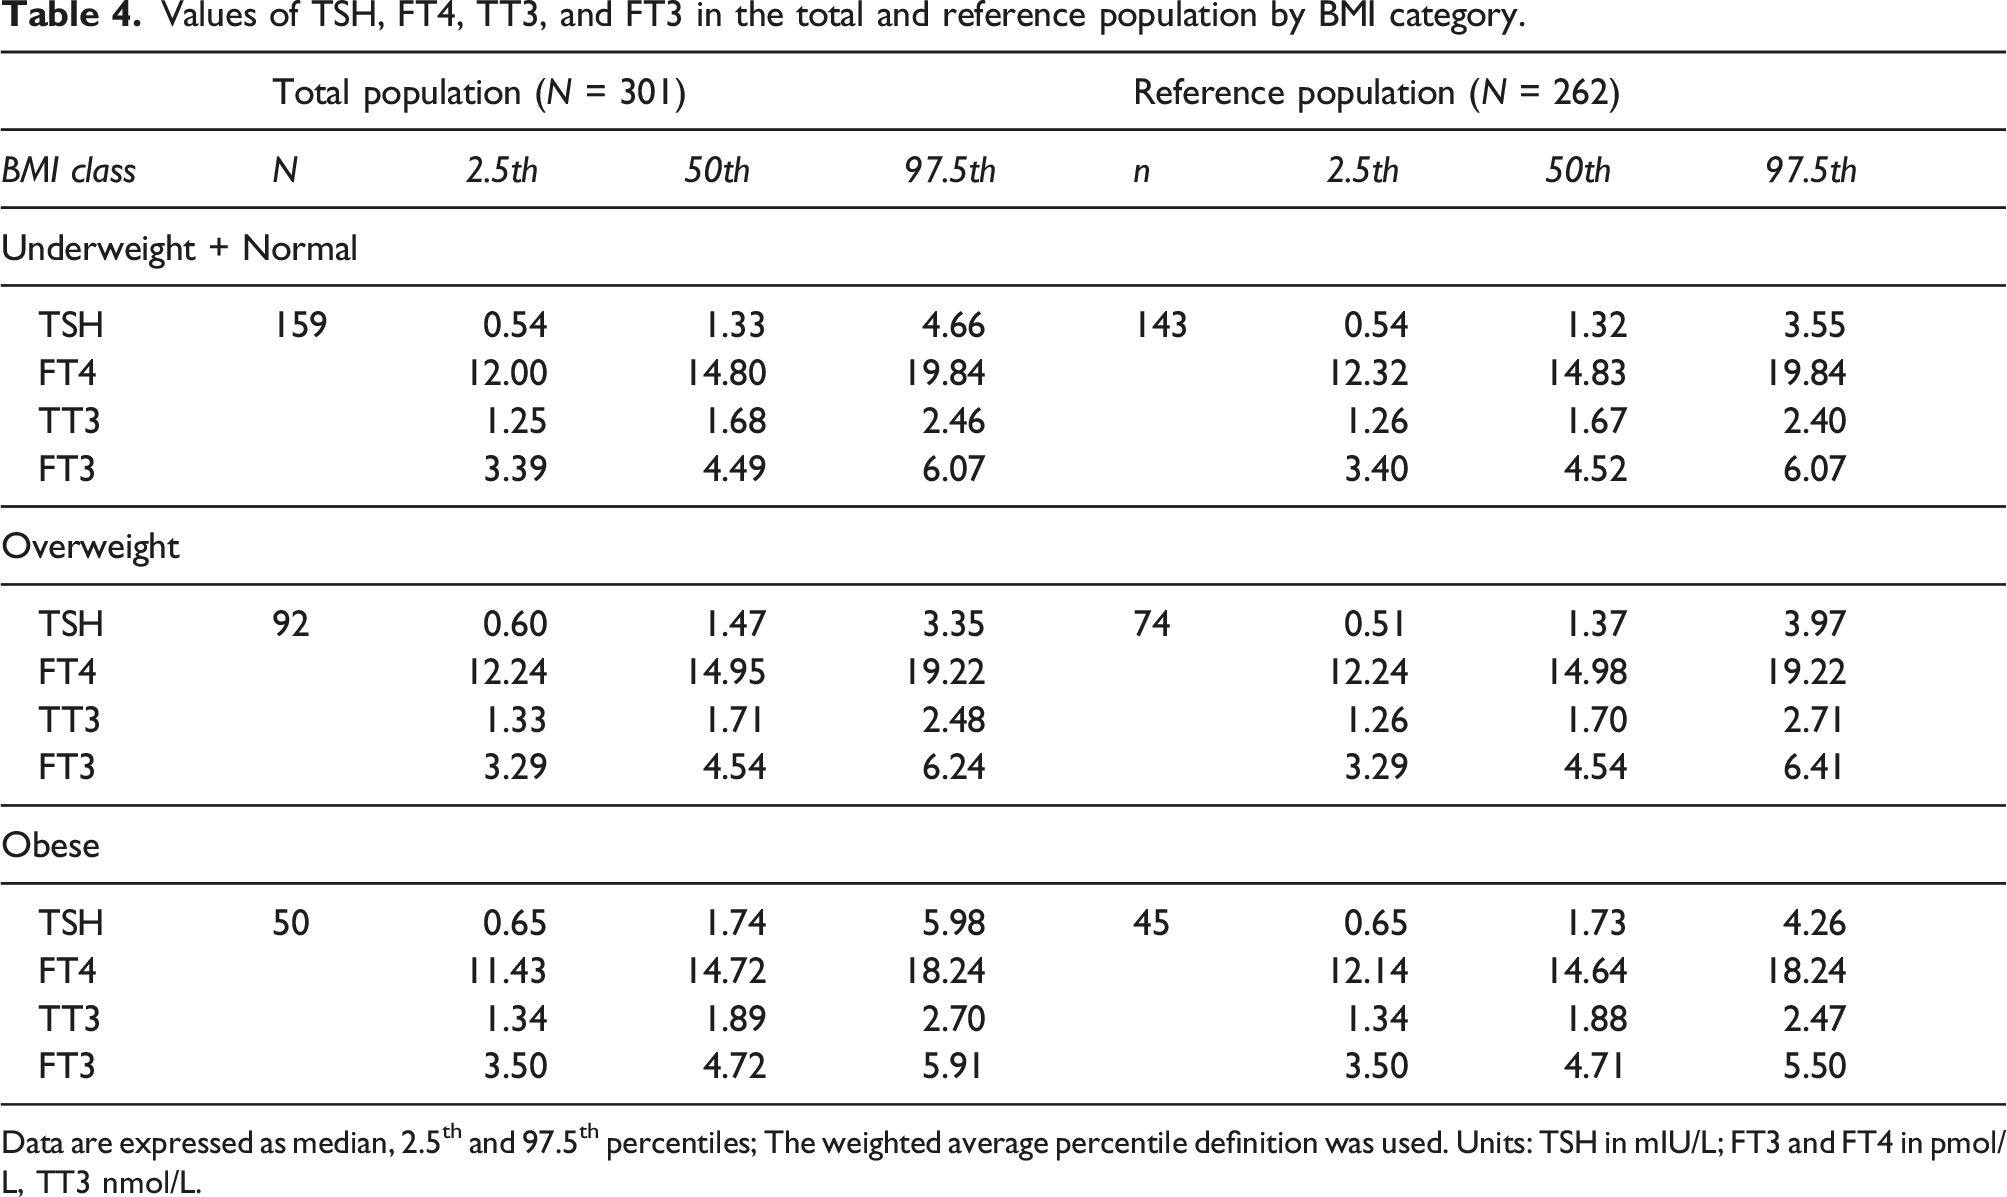
Data are expressed as median, 2.5th and 97.5th percentiles; The weighted average percentile definition was used. Units: TSH in mIU/L; FT3 and FT4 in pmol/L, TT3 nmol/L.
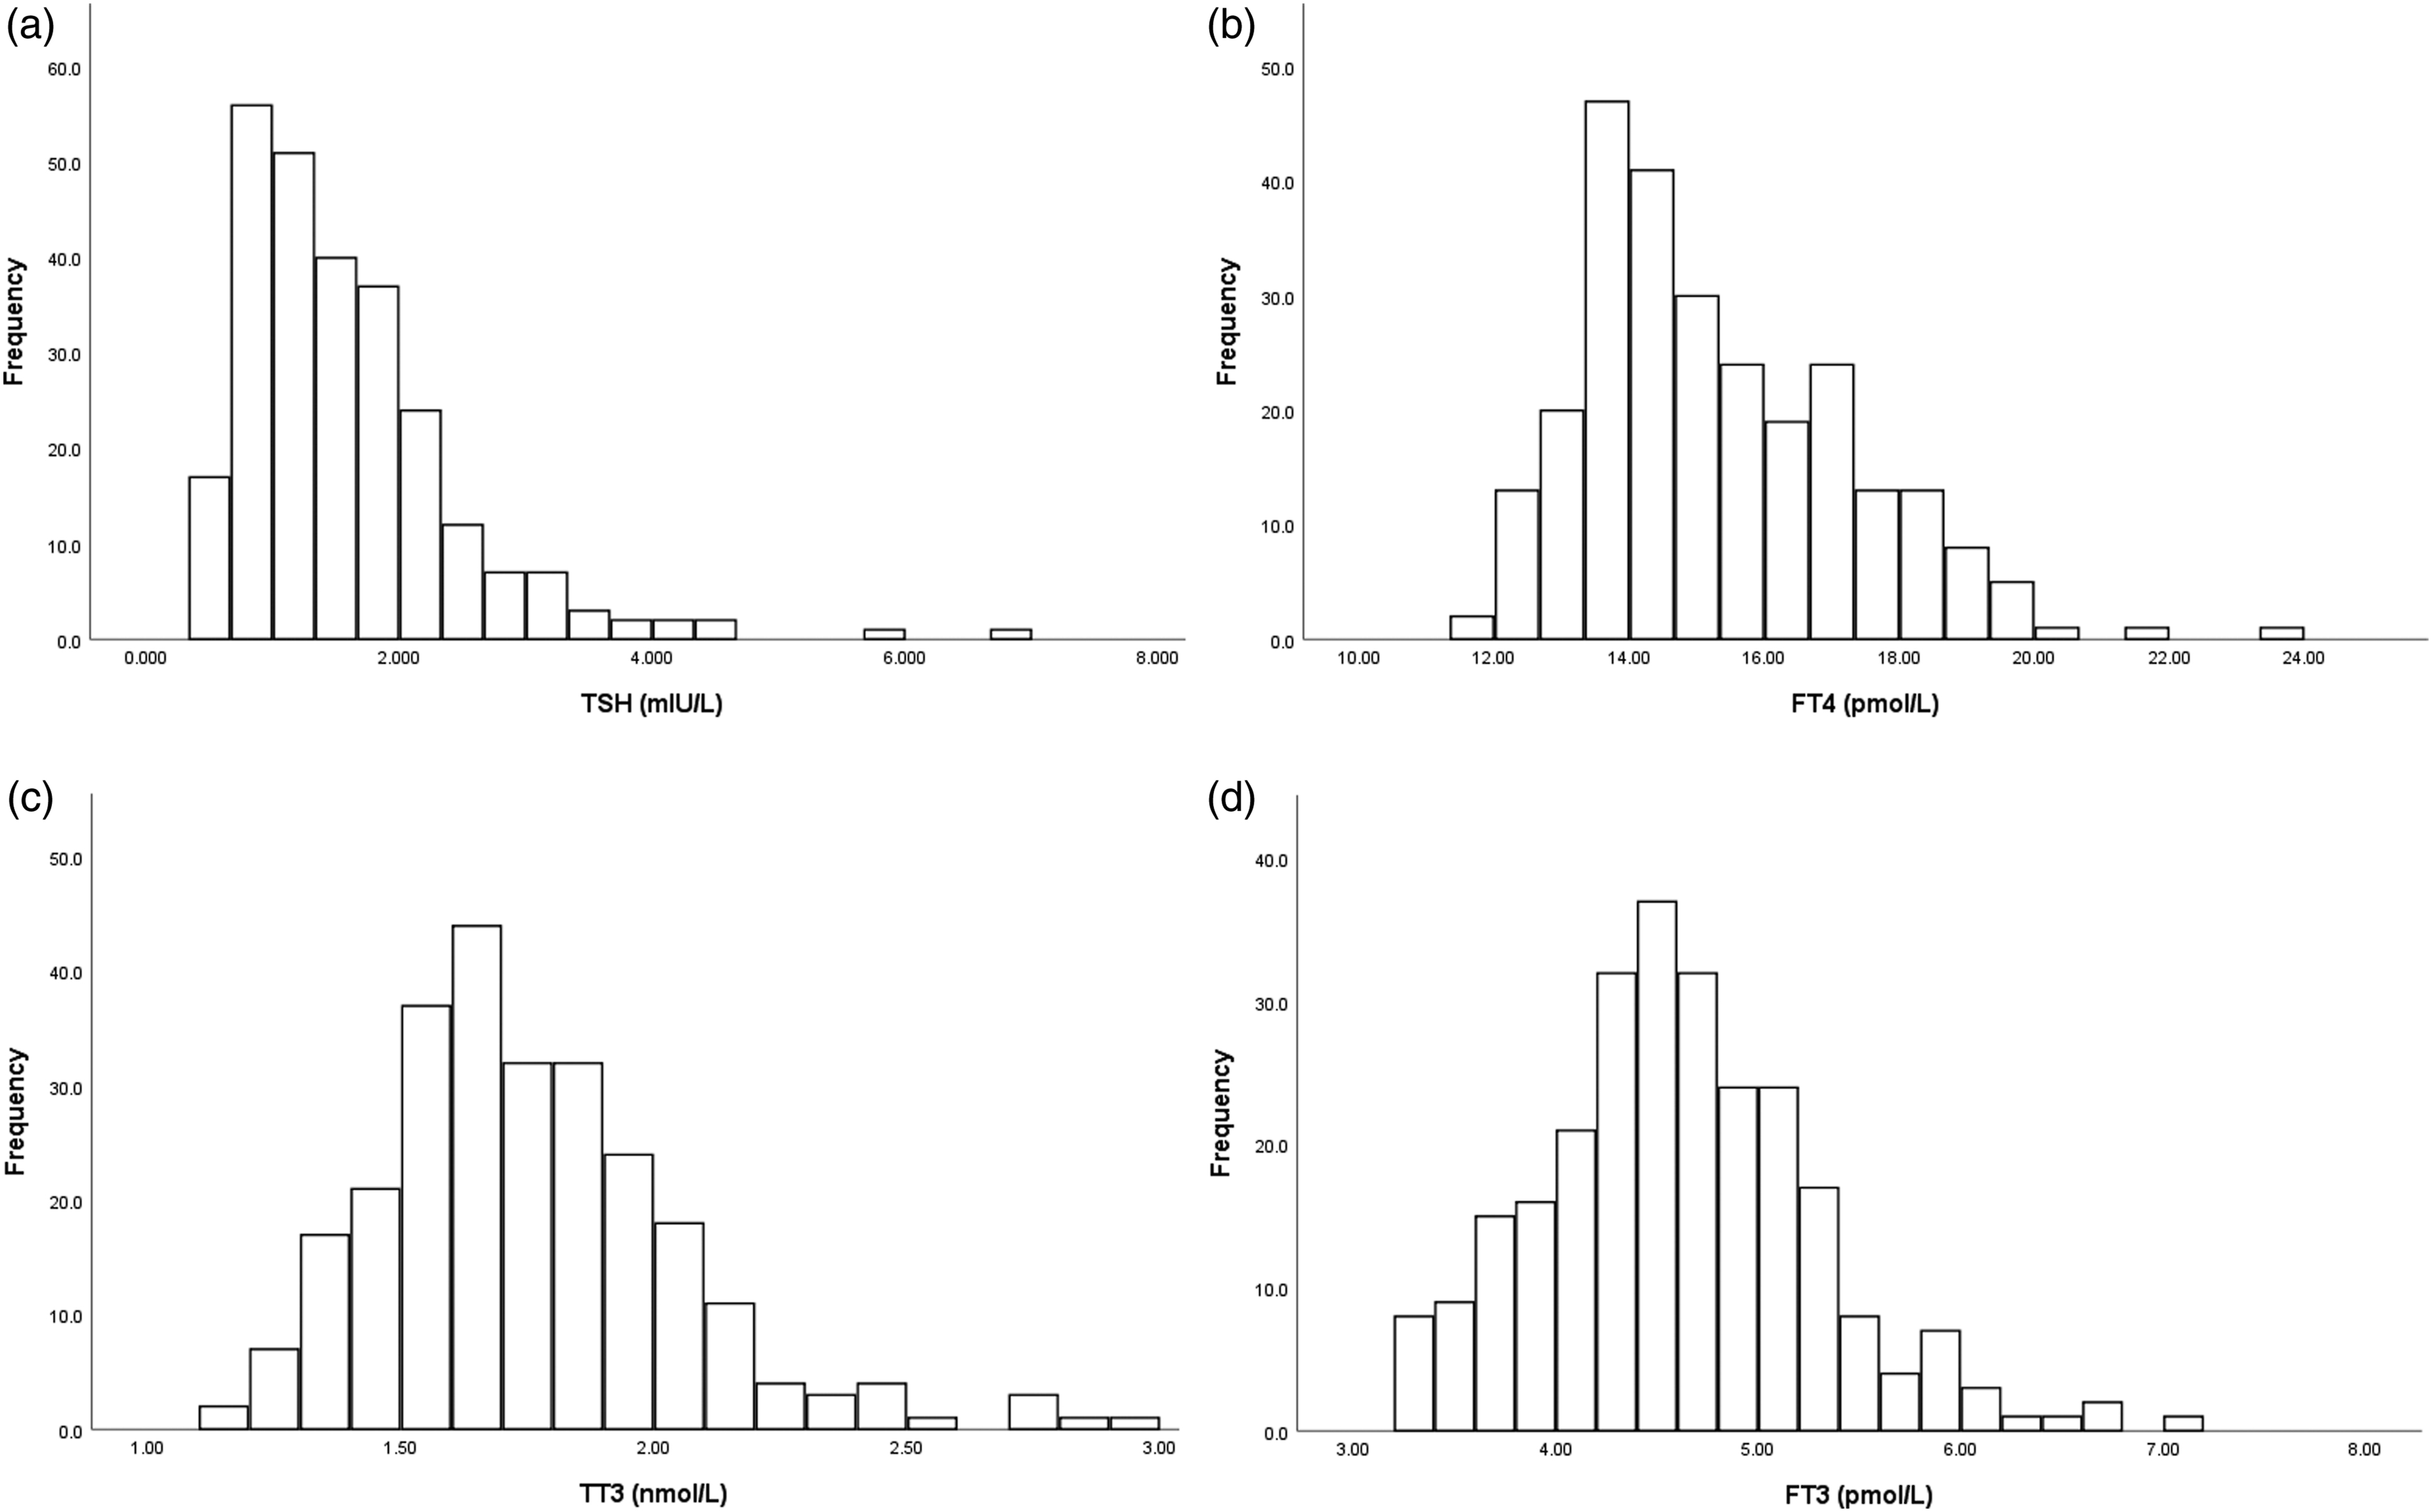
Distribution of TSH, FT4, TT3, and FT3.
Discussion
The current study has established the reference values for TSH, FT4, FT3, and TT3 in a sample of the Lebanese population aged between 18 and 65 years, free from any thyroid pathology or condition that could affect thyroid function tests. Subjects with positive TPOAb and/or TGAb were subsequently excluded from the reference population since the positivity of these antibodies has been shown to affect TSH RIs. 19
The strength of our study relies on the exclusion of extreme ages and on the application of exhaustive exclusion criteria to avoid most confounding factors. In fact, the sample was chosen in line with the National Academy of Clinical Biochemistry (NACB) recommendations.14,15 Blood sampling was taken in the morning, which eliminates the bias associated with variations in the TSH circadian rhythm 20 that reaches its peak at night and its nadir in the afternoon. Recruitment was also done between October 2020 and January 2021, which reduces the impact of season on TSH levels. 21
The RI obtained in our population was then compared to the one provided by the manufacturer’s assay. To determine the RI of the Roche assay, the reference population was constituted by a total of 870 German blood donors aged 18 to 60 with quite similar inclusion criteria. 11 Compared to the value provided by Roche, we noted in our reference population, an increase in the 2.5th percentile of TSH from 0.27 to 0.53 (95% CI: 0.50–0.56) mIU/L. Similarly, in the Chinese 10 and NHANES US populations, 1 the 2.5th percentiles were higher compared to the manufacturer’s values (respectively, 0.71 instead of 0.45 mIU/L and 0.45 instead of 0.39 mIU/L). On the other hand, the Finnish study 21 did not show any changes in the lower RI which is 0.43 mIU/L compared to the manufacturer’s one. For the 97.5th percentile, our RI did not change significantly compared to the manufacturer (4.09 (95% CI: 3.85–4.35) vs 4.2 mIU/L). In the literature, a downward trend in the upper limit of RI compared to that of the manufacturer was observed in the US, Chinese, and Finnish populations (respectively, 4.12 vs 4.6 mIU/L, 4.87 vs 5.33 mIU/L, and 3.37 vs 4.43 mIU/L). By comparing our TSH RI with those found in different studies, we noticed that our upper limit RI was close to the one determined by the NHANES study (4.09 vs 4.12 mIU/L). It was however lower than the one established in the Chinese study which is of 4.87 mIU/L 14 and to the one found in the only study performed on the Arab population which is of 4.32 mIU/L. 22 Opposingly, our upper RI is higher than the ones established in the Finnish, 8 German, 9 and Norwegian populations 22 which were, respectively, 3.4, 3.63, and 3.4 mIU/L. Our TSH RI lower limit which is 0.52 was comparable to those found in the American (0.45 mIU/L) 1 and Finnish (0.43 mIU/L) study, 9 but remained lower than the one established by the Chinese national study 10 (0.71 mIU/L) and higher than the one established in the Arab population (0.3 mIU/L). Providing explanations for the differences observed in our data and those observed in the literature is a complex task that cannot be mastered given the variability of the inclusion and exclusion criteria adopted in each of the studies and the different assays used. In addition, none of the studies were able to assess the iodine status of the studied population. This underscores the importance of establishing laboratory-specific TSH RI. Our results confirm, however, that at least for the TSH value, our reference values were higher for the 2.5th percentile and unchanged for the 97.5th percentile compared to the ones provided by the kit.
For the FT4 assay, a tendency toward a lower upper limit RI was noted compared to those determined by the manufacturer (19.78 (95% CI: 19.47–20.08) vs. 22 pmol/L), while the lower limit RI was almost unchanged (12.20 vs 12.00 pmol/L). Lower FT4 values were also found in the Arab population 23 on the Abbott Architect i2000 controller, with a reference range between 9.8 and 18.6 pmol/L. Similarly, for both TT3 and FT3, our results showed a decrease in the 97.5th percentile (respectively, for TT3 from 3.1 to 2.52 nmol/L and for FT3 from 6.80 to 6.10 pmol/L). The drop in the 97.5th percentile of FT4 and both TT3 and FT3 could be related to extra-thyroid factors such as certain drug intake, chronic diseases, or recent hospitalization. However, the strict exclusion criteria in our recruitment eliminate these confounding factors. Iodine deficiency can also reduce the production of T4 and T3 which induces an increase in TSH to restore the level of peripheral hormones. Although the upper limit of TSH established in our reference population is not high, the role of iodine deficiency remains possible, since iodine deficiency was previously demonstrated in the Lebanese pediatric population. 24 Finally, ethnicity could explain the lower values of FT4 and FT3, and again, this underlines the importance of establishing reference values specific to each population.
Lastly, we did not show any significant gender difference in RI for TSH and FT4; however, FT3 and TT3 values were higher in men compared to women, although the difference was at the limit of significance for TT3. In addition, we found a significant decrease in FT3 and FT4 with age categories. Two previous studies showed quite similar results. In the first one from Serbia, higher FT4 and FT3 values were observed in men as well as a significant difference in TSH and FT3 values between different age groups. 25 Similarly, in the second study from China, females and older adults have lower FT3 values and lower FT3/FT4 ratios, while the FT4 values remain stable. 26 The reason why TSH does not increase with age categories in our study is probably the age limit of 65 of our population. In addition, the explanation for the gender difference observed in FT4 and FT3 could be a greater hepatic conversion of T4 to T3 in males. In fact, a lower concentration of 5′-deiodinase was observed in female mice compared to males, 27 and administration of testosterone to orchidectomized male and oophorectomized female mice is followed by an increase in T3 values. 27
Our study has several limitations. First, participants' iodine status was not assessed. In fact, it has been demonstrated that Lebanese children are iodine deficient probably due to inadequately iodized salt 24 ; iodine deficiency was also observed in several Middle Eastern populations, 28 and this may affect thyroid function tests. Second, the RI vary according to the manufacturers' assays, and the RI in our study was only established using the Roche assay. In addition, we do not have previous reference values for TPOAb and TGAb in the Lebanese population. The positivity threshold adopted for these autoantibodies were those provided by the manufacturer and can vary according to the used assays. Third, a thyroid ultrasound was not performed on our population as opposed to the Chinese study. 10 Therefore, subjects with unrecognized goiter or thyroid nodule were not excluded from the reference population. Finally, recruitment was done on a voluntary basis without a sampling method, which can increase selection bias and affect the representativeness of the sample.
In conclusion, this study allowed us to adapt the RI of thyroid function tests to the Lebanese adult population. Our results showed that there is a need to raise the 2.5th percentile reference value for TSH and to lower the 97.5th for the FT4 measurement. Adopting these new RI to the Lebanese population, particularly those of TSH and FT4, will therefore have an impact on our current practice since we will identify more commonly subjects with undiagnosed thyrotoxicosis. Therefore, changing the RI values in our laboratories will allow a more accurate diagnosis of a thyroid dysfunction.
Footnotes
Declaration of conflicting interests
The author(s) declared no potential conflicts of interest with respect to the research, authorship, and/or publication of this article.
Funding
The author(s) disclosed receipt of the following financial support for the research, authorship, and/or publication of this article: This study is supported by Conseil de l'Universite Saint-Joseph (FM406).
Ethical approval
The study had the approval of the ethics committee of Hôtel-Dieu de France hospital (CEHDF1524). All participants signed a written informed consent to participate in the study.
Guarantor
MHGY.
Contributorship
CS and AA and JB has performed the recruitment of volunteers and has contributed to the redaction of the manuscript, GS perform the statistical analysis and MHGY has conceived and designed the study, and wrote the manuscript. All the authors approved the final version of the paper.