
Abstract
Background
Accumulating evidence shows that contamination of blood samples by atmospheric ammonia affects blood ammonia test levels; however, reports on the effect of ammonia contamination of assay reagents are limited. Here, we aimed to clarify the effect of ammonia contamination of assay reagents, particularly the therapeutic drug monitoring (TDM) reagents, on the detection levels of blood ammonia using enzymatic assays.
Methods
Ammonia gas was measured in the refrigerator compartment of the automatic analyser and the reaction tank water, probe wash water and drain outlets connected to the automatic analyser. At different time points following the closure of the cold storage, ammonia levels in quality control plasma samples were measured using three commercial assay reagents to evaluate the effect of air contamination. The distribution of evaporated ammonia in the reagent was measured using the CicaLiquid NH3 assay kit containing the assay reagent most affected by air contamination.
Results
It was confirmed that ammonia gas was generated in the cold storage of the automatic analyser. More than half of the reagents detected >0.25 ppm ammonia, and the highest concentration was detected in the TDM reagent. The ammonia levels obtained using all three reagents increased significantly after 3 h of air contamination. The effect was resolved by measuring a ‘dummy’ sample or mixing the reagents by inversion.
Conclusions
We demonstrated that air contamination by TDM reagents placed in cold storage could result in significantly falsely high ammonia measurements. Preventing this effect would improve the accuracy of ammonia measurements.
Introduction
Ammonia is a neurotoxic agent primarily generated in the intestine and detoxified in the liver. 1 Circulating ammonia levels can be elevated owing to various factors, including inherited metabolism disorders, such as urea cycle defects and organic acidurias, hepatic dysfunction and urinary tract infections.1–3 Irrespective of the aetiology, delayed diagnosis and treatment of hyperammonaemia can lead to neurological damage and potential lethality. Therefore, it is important to diagnose hyperammonaemia to promptly prevent the development of neurologic damage. 4
Commercially available analysers based on enzymatic detection methods are widely used to measure plasma ammonia levels in clinical laboratories worldwide. Enzymatic assay reagents allow for the rapid and highly sensitive detection of ammonia levels in several clinical specimens. 5 Reportedly, pre-analytical and analytical factors, including elapsed time between collection and testing, sample storage temperature, haemolysis in the test tube and contamination by atmospheric ammonia, can result in false positives in enzymatic ammonia measurements if blood samples are not collected carefully.6–9 Therefore, it is critical to minimise artifacts caused by pre-analytical and analytical factors, given the importance of this biochemical marker for patient diagnosis and treatment. 6
A previous study has shown specimens being contaminated by atmospheric ammonia
7
; however, the possibility of contamination of assay reagents by ammonia in the atmosphere has not been explored. In a preliminary study, we found that the contamination of ammonia detection assay reagents by vaporised gas could result in false positives (data not shown). Therefore, we hypothesised that vaporised gas in the cold storage component of an automatic analyser could cause false positive plasma ammonia levels (Figure 1). Therefore, the present study aimed to examine air contamination, which could lead to falsely high enzymatic ammonia measurements and establish conditions to avoid such contamination. Flowchart of the hypothesised mechanism leading to false high ammonia levels due to air contamination.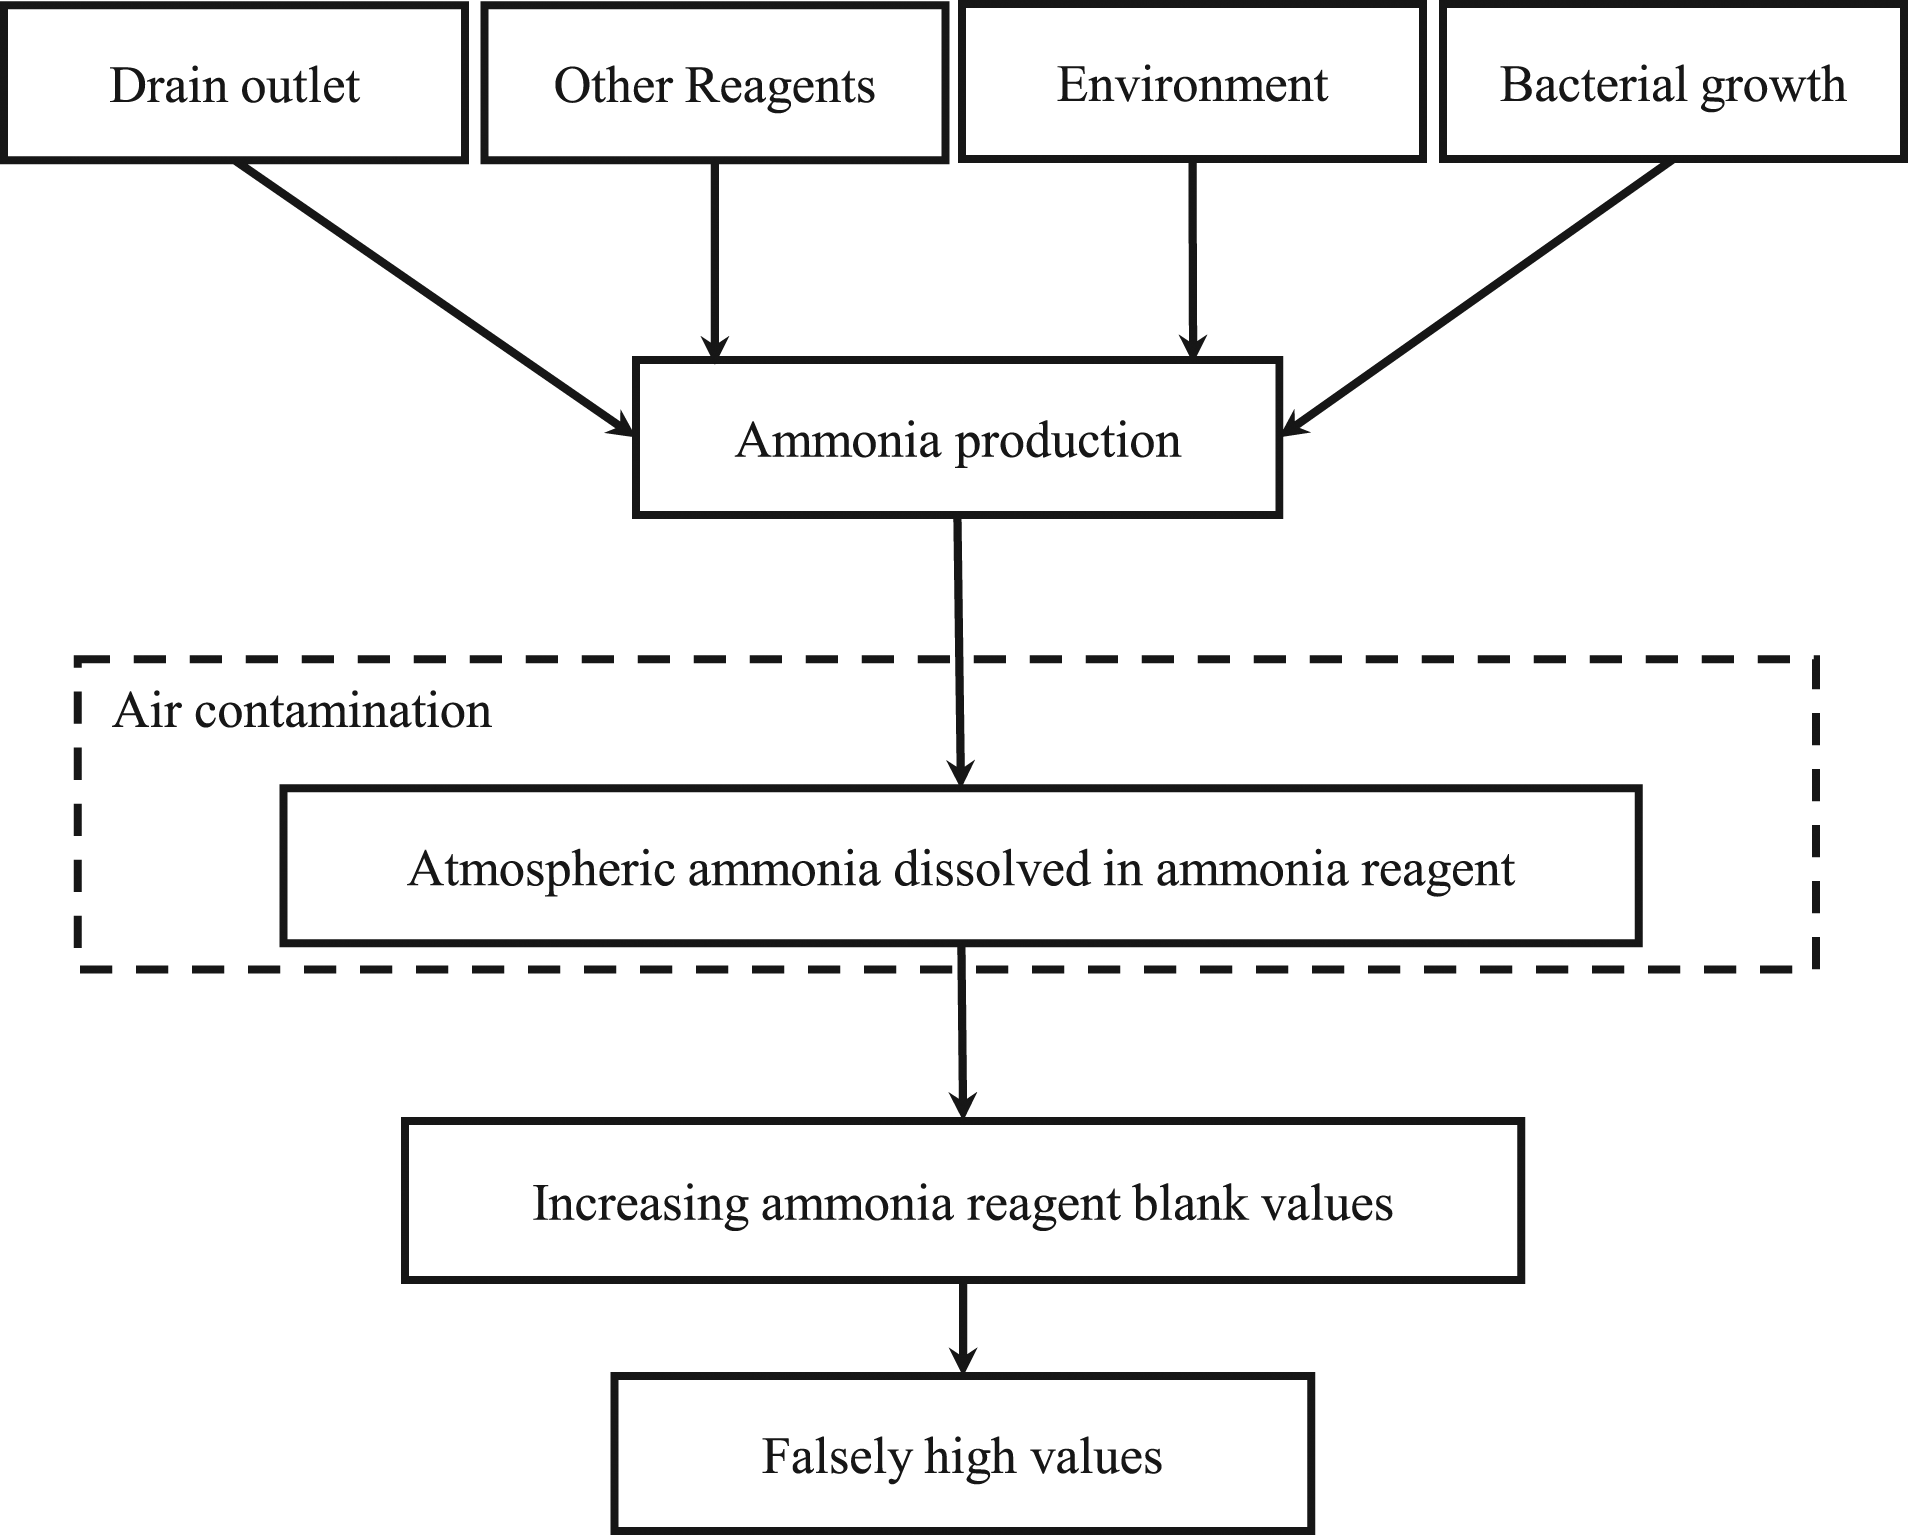
We investigated (1) whether ammonia gas was generated in the cold storage of the automatic analyser, (2) whether the generated gas was caused by detection reagents used for other clinical parameters also present in the cold storage and (3) the effect of ammonia gas on ammonia assay reagents.
Materials and methods
Ammonia in vaporised gas
Effect of other reagents in the cold storage on ammonia measurements.
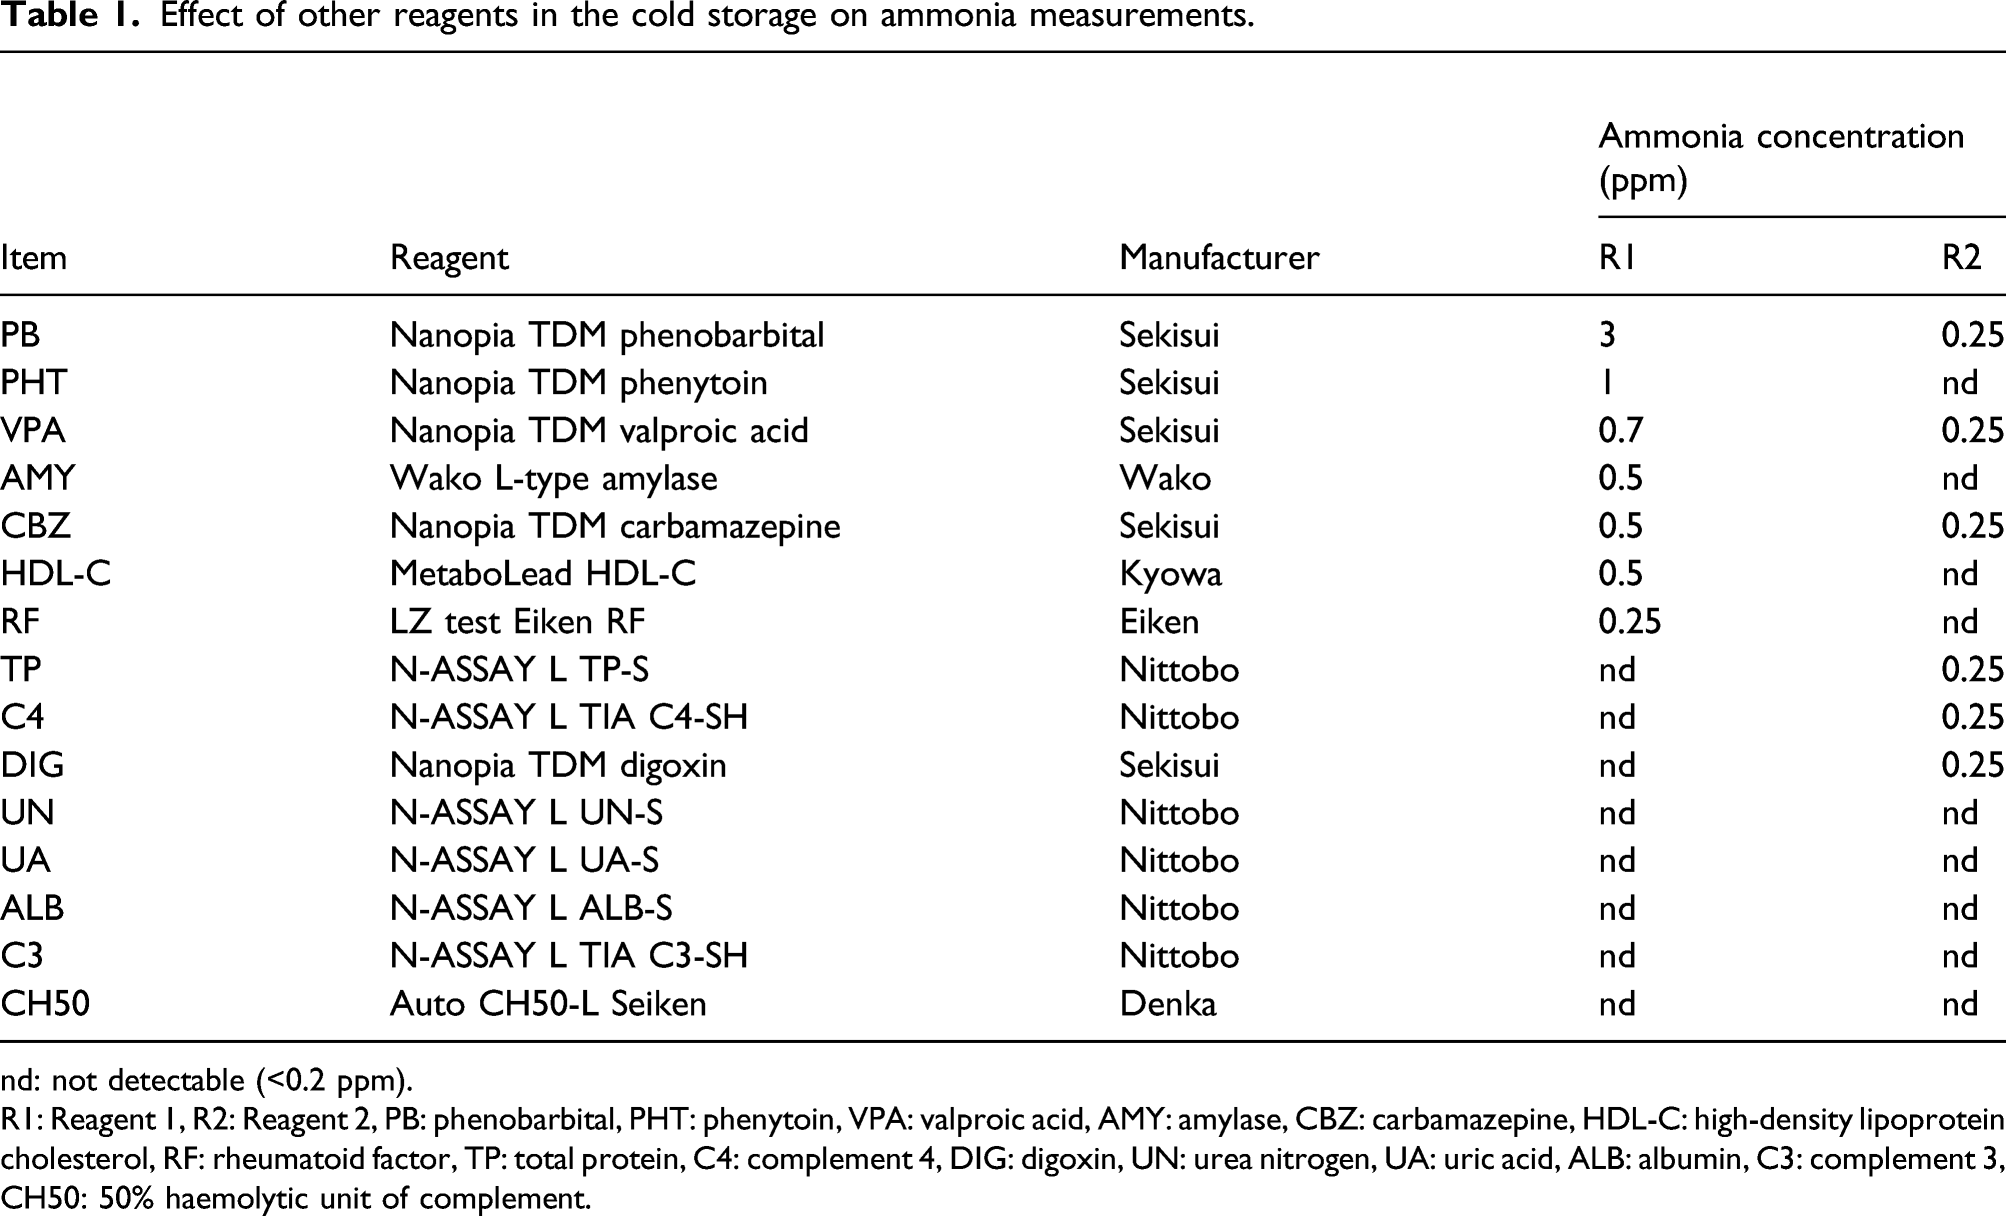
nd: not detectable (<0.2 ppm).
R1: Reagent 1, R2: Reagent 2, PB: phenobarbital, PHT: phenytoin, VPA: valproic acid, AMY: amylase, CBZ: carbamazepine, HDL-C: high-density lipoprotein cholesterol, RF: rheumatoid factor, TP: total protein, C4: complement 4, DIG: digoxin, UN: urea nitrogen, UA: uric acid, ALB: albumin, C3: complement 3, CH50: 50% haemolytic unit of complement.
Bacterial and fungal culture
To confirm the presence of bacteria and fungi in the cold storage, probe wash water and reaction tank water, the samples collected from the cold storages and the liquid waste outlets of each reagent were cultured. Briefly, specimens from these sources were obtained with sterile swabs and were placed in a tube containing 2.0 mL 0.9% NaCl and centrifuged at 1700 × g for 20 min; the upper liquid phase (1.5 mL) was discarded, and the lower phase (0.5 mL) was retained for further use. One hundred microlitres of the dense phase were then inoculated onto plates containing Drigalski agar (BTB) (Nippon Becton Dickinson Co. Ltd., Tokyo, Japan) and chocolate agar (Nippon Becton Dickinson Co. Ltd.) and cultured at 35°C for 72 h in an aerobic chamber. Similarly, same amount of the dense phase was cultured on Sabouraud agar media (Kyokuto Pharmaceutical Co., Tokyo, Japan) in an O2/CO2 incubator at 35°C for 72 h. Afterwards, the colony formation was investigated, and the colony-forming specimens were marked as positive for bacterial/fungal translocation.
Ammonia levels in plasma samples
Commercial plasma samples for quality control (QC) – ammonia quality control (Kanto Chemical Co., Inc., Tokyo, Japan), NH3 quality control 100 (Serotec Co., Ltd., Hokkaido, Japan) and NH3 quality control I (Nittobo Medical Co., Ltd., Tokyo, Japan) – obtained from the respective ammonia detection reagent manufacturers were used for the ammonia detection. All plasma samples were analysed by a JCA-BM8040 automated analyser (JEOL Ltd., Tokyo, Japan) using one of the following three enzymatic assay kits: CicaLiquid NH3 (Kanto Chemical Co., Inc.), Serotec ammonia-L (Serotec Co., Ltd.) and N-test L NH3 (Nittobo Medical Co., Ltd.). All kits contained Reagent 1 (R1) and Reagent 2 (R2).
Effect of stored reagents on the ammonia assay. Ammonia measurement values were compared between conditions with and without other reagents being placed in the cold storage. Air contamination of the ammonia assay reagent by vaporised ammonia in cold storage was assessed by closing the lid of the cold storage and leaving the ammonia assay reagent in that storage for 3 h. The reagents assessed are listed in Table 1. QC samples were measured at 0 and 3 h after closing the cold storage.
Effect of ammonia gas contamination on the ammonia assay. First, the rates of ammonia level changes in QC samples were measured using the three ammonia assay kits at 0 and 3 h after closing the cold storage. Next, only R1 or R2 reagents from each manufacturer were exposed to air in the cold storage for 3 h. For this, either the R1 or R2 bottles caps were tightened during air contamination for 3 h and then opened again for use. The QC samples were then measured using these reagents. In each experiment, the analyser was not operated for a certain period depending on the conditions of the experiment after the ammonia reagent was placed in the cold storage and calibrated. Therefore, the reagent solution was not stirred for 3 h.
In addition, to avoid the effect of ammonia contamination, the following experiments were conducted. First, ammonia levels in QC samples were measured three times with the ammonia reagent from KNT at 0, 3, 6 and 12 h after the cold storage was closed. After that, ammonia levels in the QC samples were measured using the ammonia reagent of KNT, with both R1 and R2 mixed by inversion after air contamination.
Statistical analyses
Data were expressed as the mean ± SD. The significance of differences in mean values within and between multiple groups was evaluated using ANOVA followed by the Bonferroni test. Welch’s t-test or Student’s t-test was used to evaluate the statistical significance of differences between two groups. A p-value <0.05 was considered statistically significant. Statistical calculations were performed with JSTAT for Windows, version 22.0, Japan.
Results
Estimation of ammonia levels in the analyser
Ammonia concentration in the cold storage was <0.2 ppm at 12 h after the storage was closed. The ammonia levels in the air of the waste liquid outlet were also <0.2 ppm (Supplementary Table 1). No bacterium or fungus was detected in reaction tank water, probe wash water and drain outlets connected to the automatic analyser (Supplementary Table 2). Ammonia levels >0.25 ppm were detected from 10 of 15 reagents, and ammonia levels evaporated from R1 reagents were higher than those from R2 reagents (Table 1). The highest levels of ammonia (3.0 ppm) were detected from R1 of the Nanopia Therapeutic Drug Monitoring (TDM) Phenobarbital Kit (Sekisui Medical Co., Kyoto, Japan), followed by that from R1 (1.0 ppm) of Nanopia TDM Phenytoin Kit (Sekisui Medical Co.).
Effect of air contamination on enzymatic ammonia assays
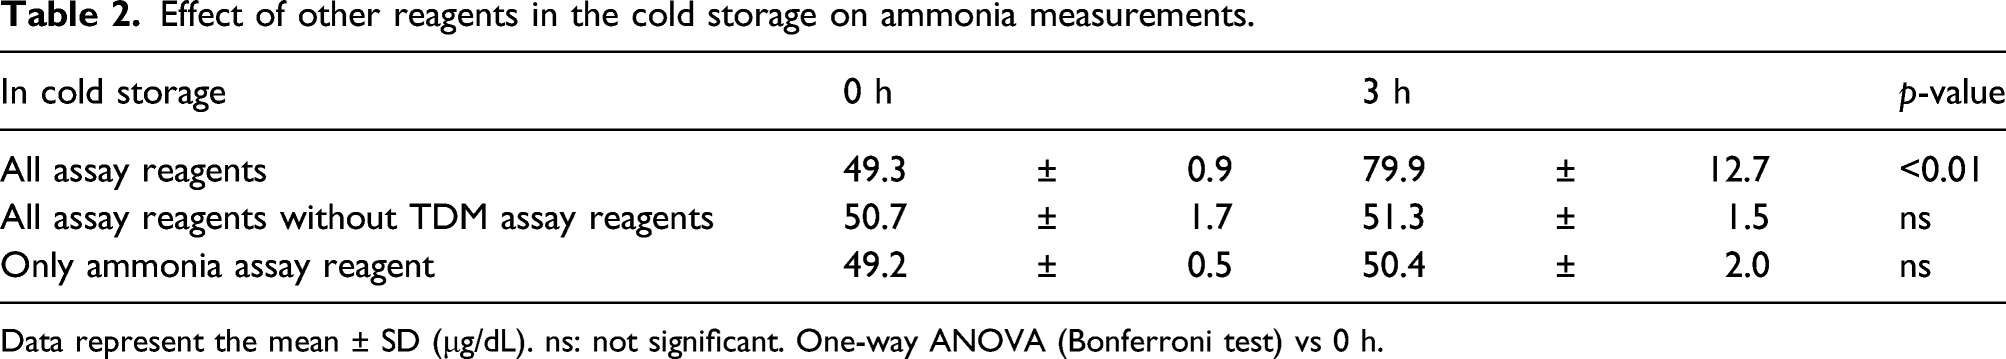
Changes in the measurement values obtained for each reagent at 3 h compared with those at 0 h are shown in Figure 2(a). Significant increases in ammonia levels were observed with all three assays at 3 h. The KNT assay showed a 29.7% increase, which was higher than the increase obtained with the SER or NIT assays. Furthermore, the effect of air contamination was suppressed when the lid of R1 was closed (Figure 2(b)). This effect was not observed when the TDM reagents in the reagent storage were removed (Table 2). Comparison of rates of ammonia level change between different conditions for the three enzymatic assay reagents. (a) Quality control (QC) samples were measured at 3 h after ammonia assay reagents (KNT, SER and NIT) were exposed to air in the cold storage for 3 h (n = 6). (b) Only R1 or R2 from the ammonia assay reagent was exposed to air in the cold storage for 3 h. QC samples were then measured (n = 5). Data represent the mean ± SD. *: p < 0.05, †: p < 0.01 with Welch’s t-test, Student’s t-test or one-way ANOVA (Bonferroni test) vs 0 h. Effect of other reagents in the cold storage on ammonia measurements. Data represent the mean ± SD (μg/dL). ns: not significant. One-way ANOVA (Bonferroni test) vs 0 h.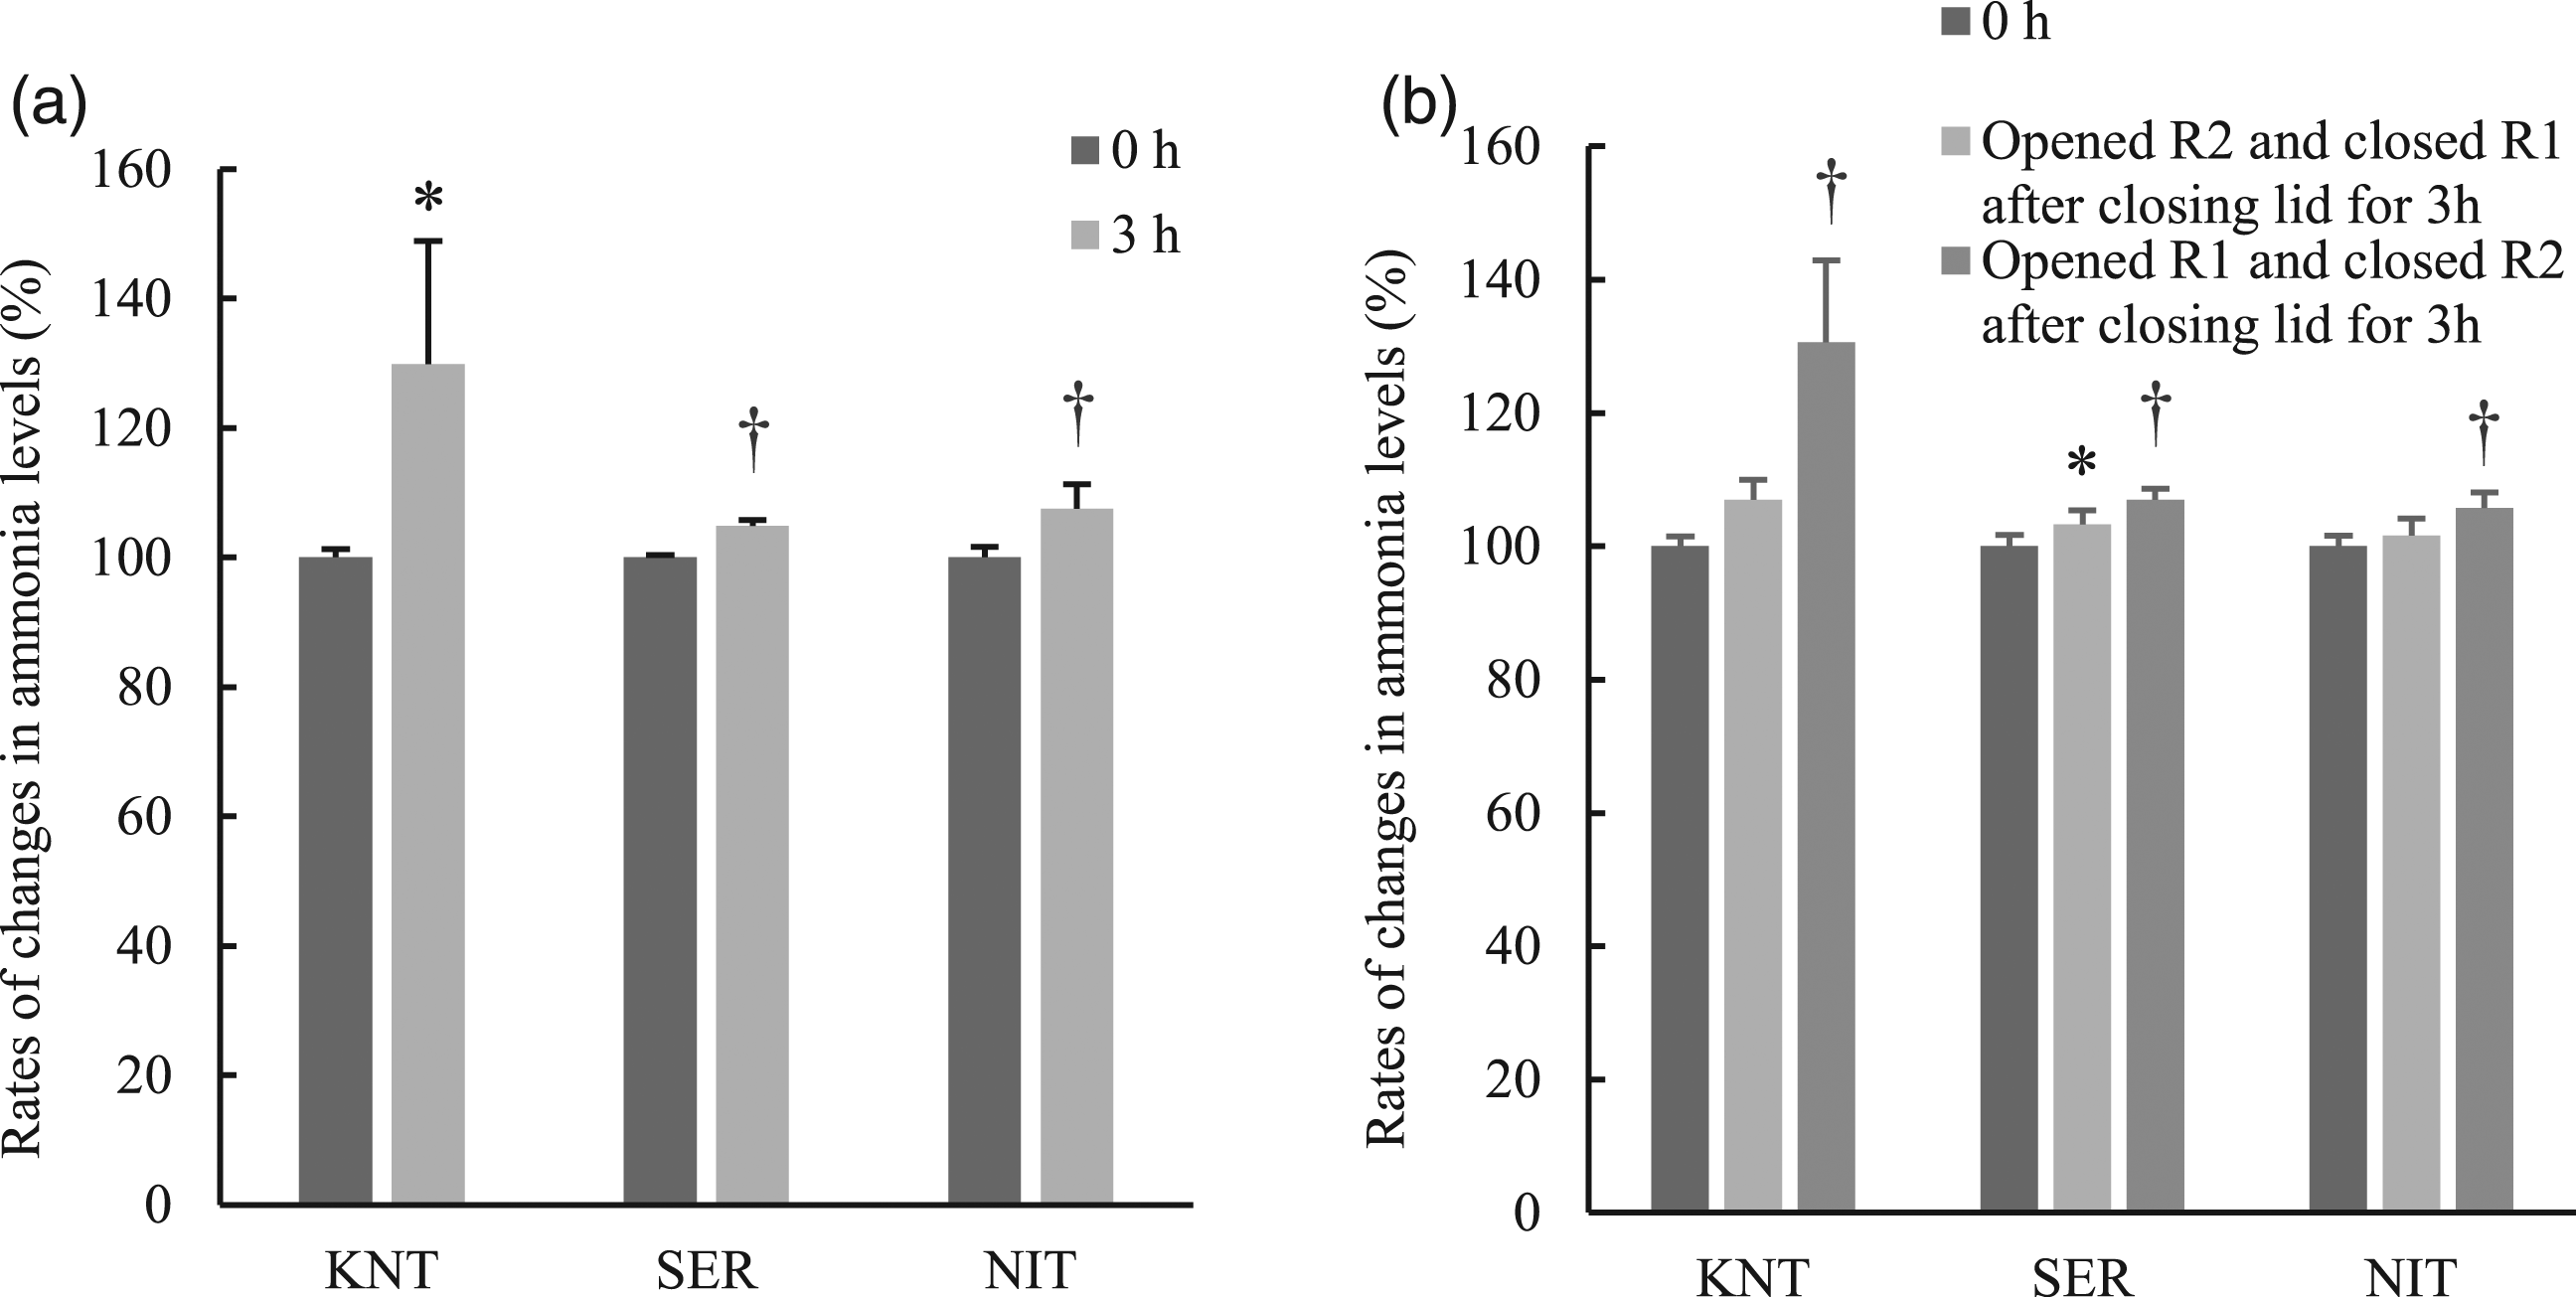
In addition, we performed a detailed experiment with the KNT assay, which demonstrated the highest effect. Ammonia values of QC plasma obtained with the KNT reagent were significantly increased after 3 h of air contamination. Triple measurements at different time points (3, 6 and 12 h) revealed that the first measurement value after contamination was the highest under all conditions. The values gradually approached the baseline after the second measurement. The effects of ammonia contamination at 3 and 6 h were suppressed to 100.7% and 102.8%, respectively, at the third measurement, and the effect at 12 h remained significantly high, at 117.1% (Figure 3(a)). Furthermore, the increase in ammonia values was significantly decreased to within 5% of baseline levels by mixing ammonia reagents through inversion at each time point (Figure 3(b)). Verification and effectiveness of methods for controlling the effects of air contamination. (a) Multiple measurements improve falsely high ammonia measurement values. QC samples were measured three times at each time point, and the values were expressed as ‘first’, ‘second’ and ‘third’ (n = 3). *: p < 0.05, †: p < 0.01 with one-way ANOVA (Bonferroni test) vs baseline. (b) Effect of reagent mixing through inversion on ammonia measurement levels. QC samples were measured at 0, 3, 6 and 12 h with or without mixing the reagent through inversion after ammonia contamination (n = 3). *: p < 0.05, †: p < 0.01 with one-way ANOVA (Bonferroni test) vs at 0 h.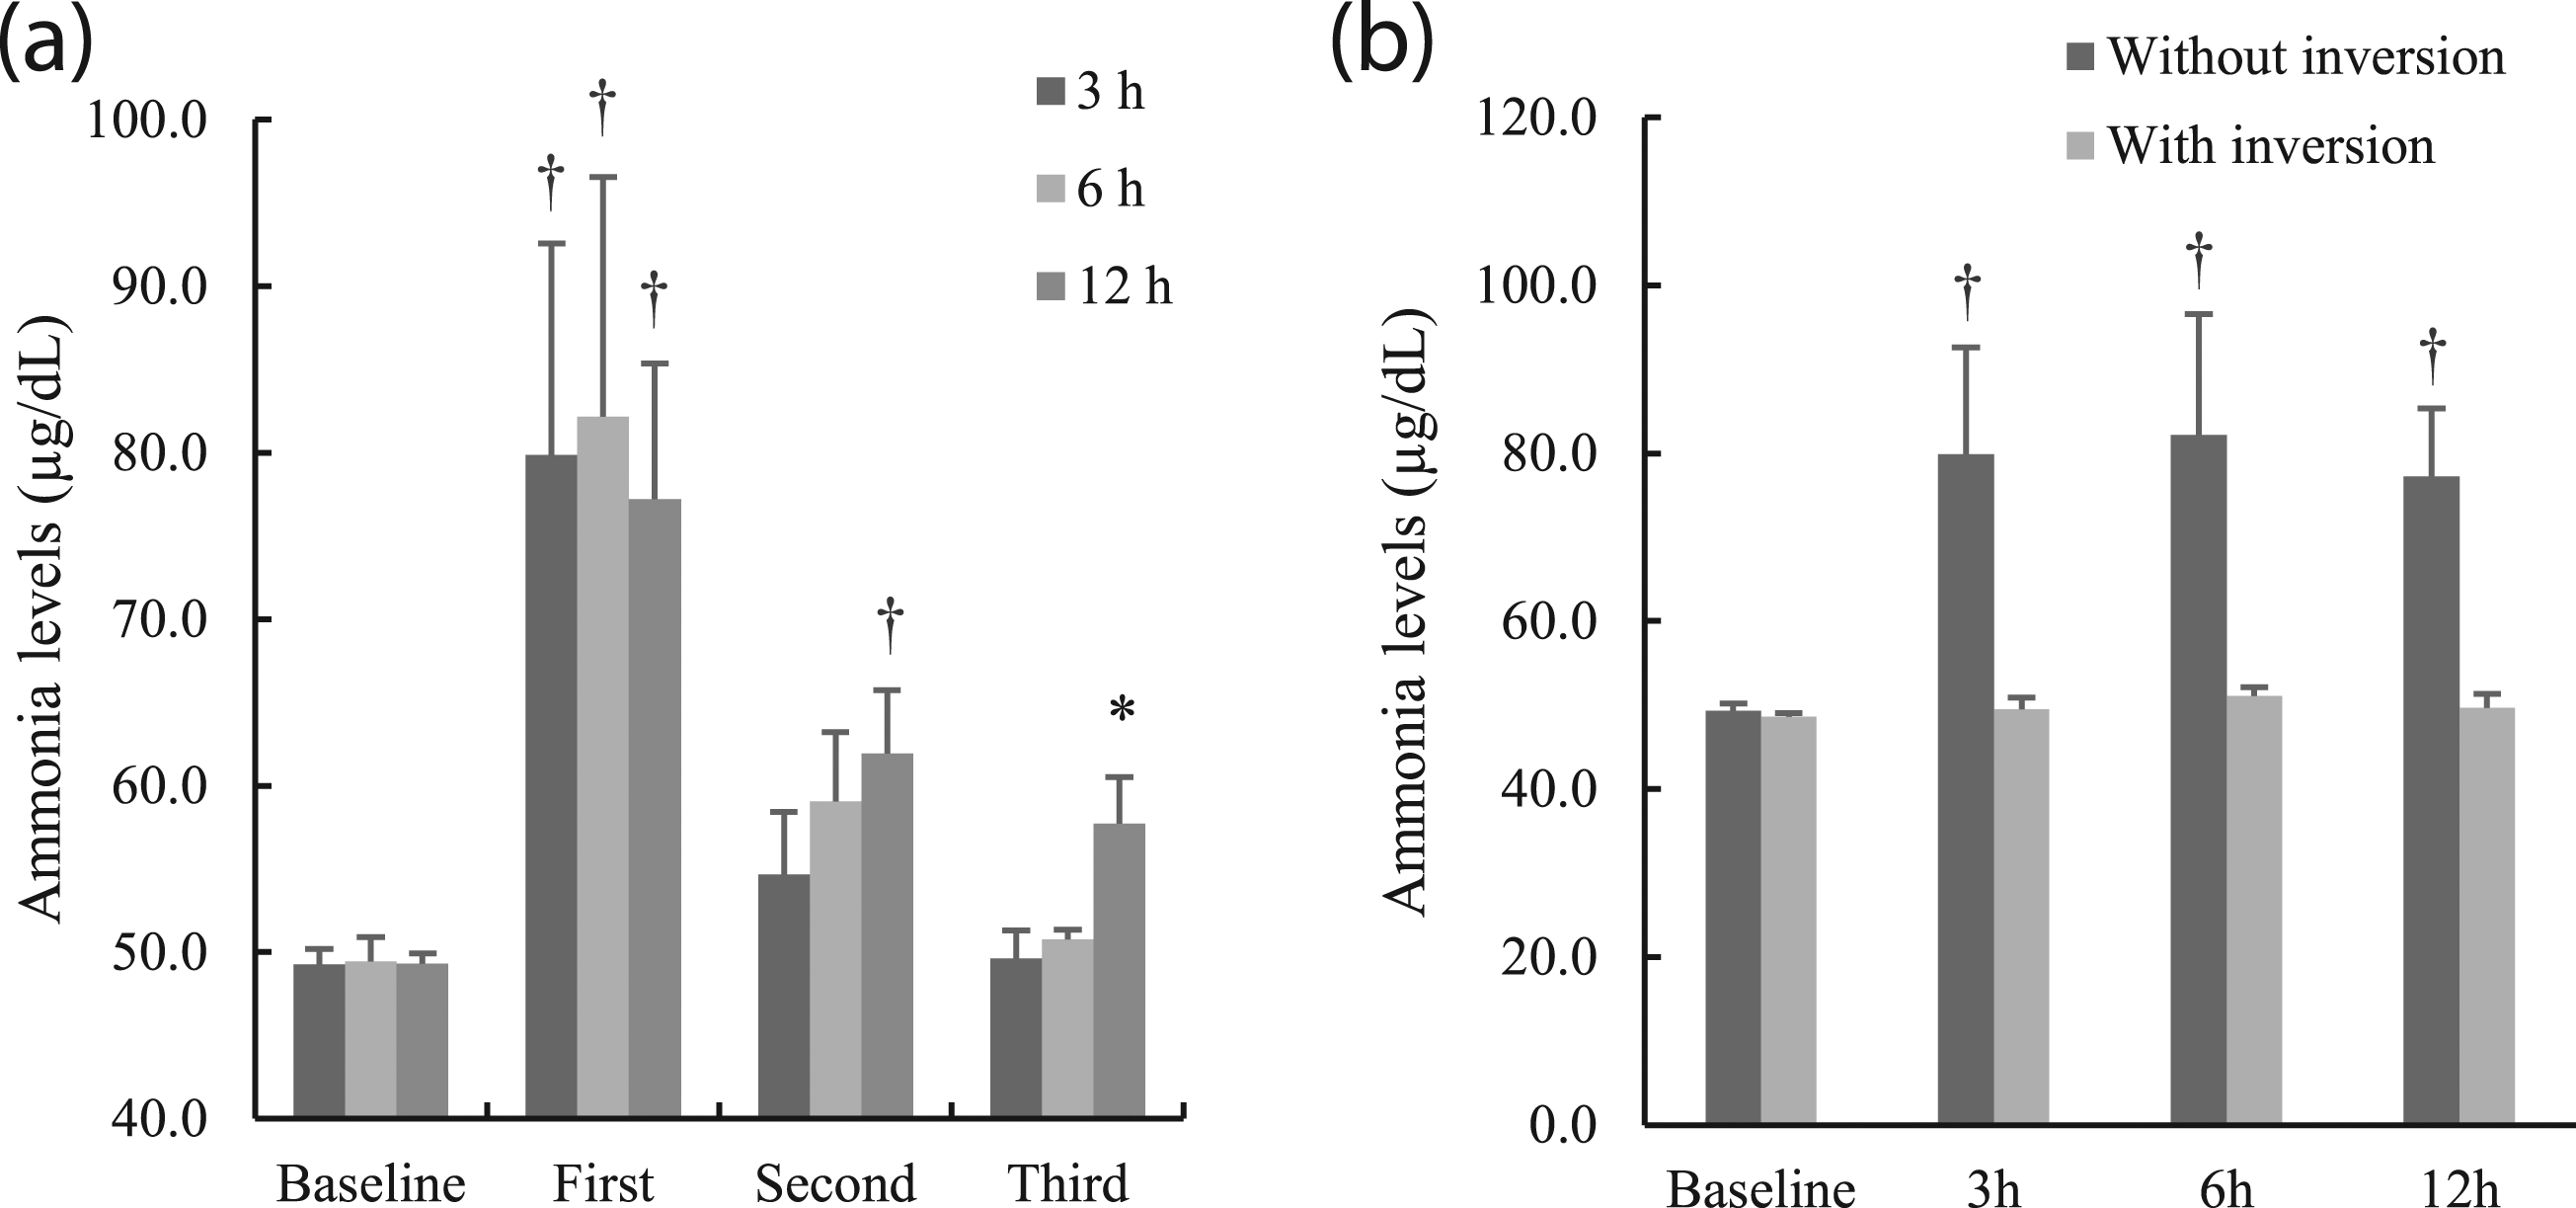
Discussion
Characteristics of the three ammonia assay kits used in this study.
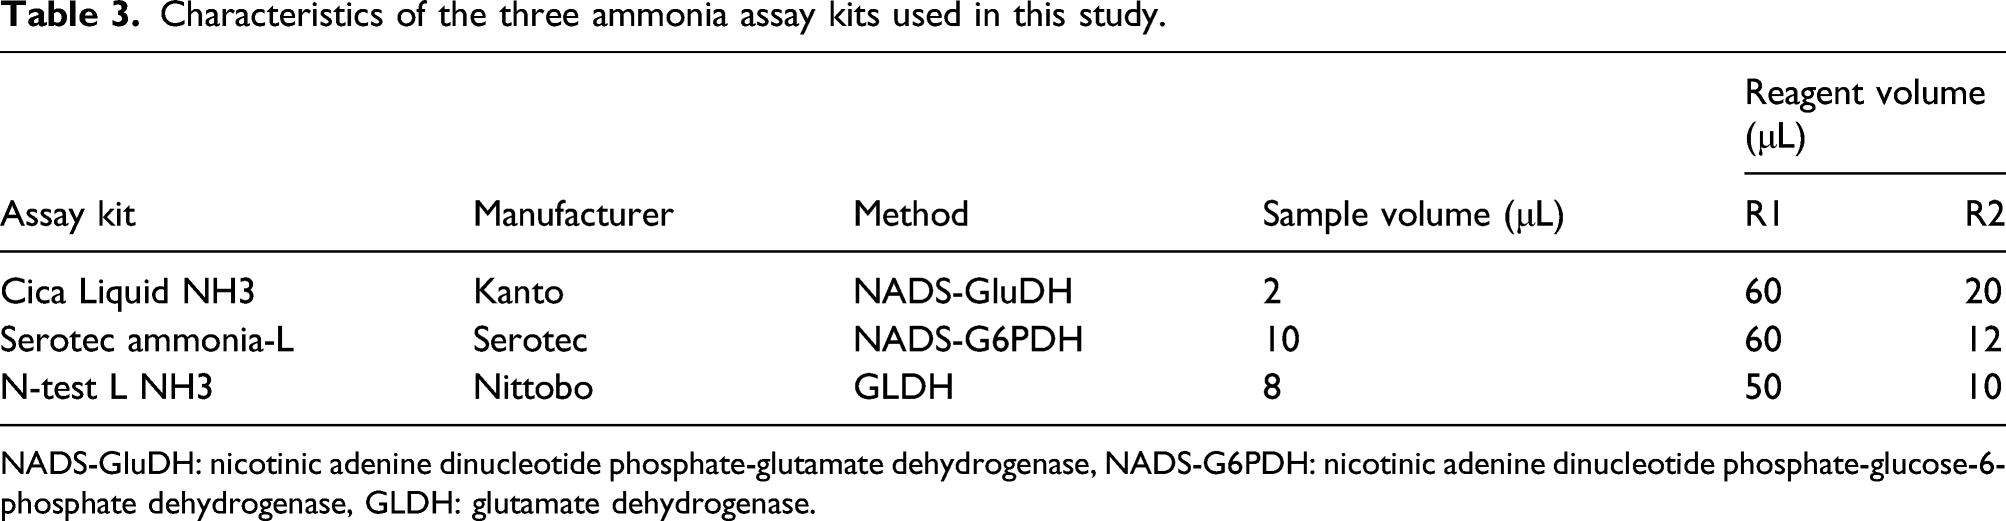
NADS-GluDH: nicotinic adenine dinucleotide phosphate-glutamate dehydrogenase, NADS-G6PDH: nicotinic adenine dinucleotide phosphate-glucose-6-phosphate dehydrogenase, GLDH: glutamate dehydrogenase.
The ammonia level in the cold storage room was equal to that of the laboratory atmosphere, which was used as a control. However, ammonia values in QC plasma were increased only with the use of reagents that had been stored with TDM reagents. In addition, some assay reagents placed in storage also generated ammonia gas. For example, ammonia levels in the evaporative gas were high for both the phenobarbital and phenytoin reagents, which could be due to the presence of Tris buffer containing amino groups in these reagents. It was confirmed that air contamination occurred even when the ammonia concentration in the storage was as low as < 0.2 ppm (ammonia gas level <0.2 ppm was converted to <20 μg/dL). For example, the increase in ammonia level from 49.3 at base level to 79.9 μg/dL at first measurement in 3 h demonstrated accumulating effects over time. The source of this contamination might have been the growth of bacteria of the genus Pseudomonas, which are capable of producing urease, cross-contamination of non-adjacent vials by the sampling needles and evaporation of other reagents in the refrigerator and the waste pipe. However, the present study confirmed no ammonia generation from bacteria or waste pipes. In addition, the probe contamination test between the ammonia reagent and all the measurement reagents stored showed no cross-contamination of non-adjacent vials with sampling needles (data not shown). Taken together, we conjectured that the main cause of ammonia contamination could be TDM assay reagents placed in the cold storage.
Furthermore, we evaluated the distribution of evaporated ammonia in the reagent using the KNT assay kit, which contained the assay reagent most affected by air contamination. The findings demonstrated a decreased effect with repeated measurements using the contaminated reagent, suggesting that the evaporated ammonia could have mainly been absorbed on the surface of the R1 ammonia assay kit reagent and that the dissolved ammonia layer was consumed by sampling (first measurement). This conclusion is also supported by the fact that the pH of the surface layer of the reagent changed to alkaline (6.91 ± 0.03 to 6.99 ± 0.04, p < 0.005, data not shown). Further, ammonia levels in the control sample returned to baseline when the assay reagent was mixed by inversion before being used for measurements. This suggested that the high concentration of ammonia on the surface diffused throughout the reagent by inversion miscibility.
Unfortunately, the reagent blank correction in this study was not effective as we could not accurately measure the reagent blank for correction (it showed variation in measured values). Although air circulation in the refrigerator seemed effective, it was difficult to maintain a constant temperature and humidity in the refrigerator. Therefore, we recommend measuring multiple samples as ‘dummy’ samples or mixing the reagents by inversion to reduce the effects of air contamination. However, the dissolved ammonia in the reagent blank increased over time even after mixing the reagents by inversion (Supplementary Figure 1), suggesting that the measurements should be corrected by regular calibration. Importantly, it was observed that ammonia was generated from numerous reagents in this study. Moreover, the evaporation of reagent components could cause not only direct effects like those described in the present study but also indirect effects, such as an increase in pH and the inhibition of chemical reactions. Therefore, the effect of reagent evaporation on other medical laboratory assays should also be addressed.
Since the analyser was not operated during air contamination in the present study, the effect of ammonia contamination was more significant. In routine diagnostics, the assay reagents are automatically mixed by rotation in the cold storage. Thus, the effect of air contamination could be mitigated considerably. However, the results of this study demonstrated that ammonia values might still become falsely high after the analyser is inactive for over 3 h.
The limitation of the current study is that its findings cannot be extrapolated to other laboratories as the magnitude of falsely high ammonia values depends on the kind of reagents stored in cold storage and the size of the reagent storage.
Conclusions
We demonstrated that air contamination of reagents by vaporised ammonia gas placed in the cold storage could cause significant falsely high values in ammonia measurements. To avoid this, ‘dummy’ samples should be measured beforehand. Alternatively, ammonia reagents should be mixed by inversion when the analyser is restarted after a long period of inactivity. To the best of our knowledge, this is the first study to demonstrate the causes of the false elevation of enzymatically determined ammonia levels, which should be considered carefully to improve the accuracy of ammonia measurements.
Supplemental Material
sj-pdf-1-acb-10.1177_00045632221074508 – Supplemental Material for Air contamination of therapeutic drug monitoring assay reagents results in falsely high plasma ammonia levels
Supplemental Material, sj-pdf-1-acb-10.1177_00045632221074508 for Air contamination of therapeutic drug monitoring assay reagents results in falsely high plasma ammonia levels by Tomoaki Tsukushi, Ryota Shinohara, Yuzuru Adachi, Yoshifumi Kurosaki, Naohito Ishii, Masato Katagiri, Shinichi Munekata and Yuhsaku Kanoh in Annals of Clinical Biochemistry
Footnotes
Acknowledgements
The authors would like to thank the Department of Clinical Laboratory, Kitasato University Hospital, for technical support for the project.
Contributorship
TT: design, collection of data, analyses and interpretation of data, drafting of the manuscript, critical review of the manuscript’s content and approval of the final version submitted for publication; RS and YA: analyses and interpretation of data; YK, NI, MK, SM and YK: interpretation of data, critical review of the manuscript’s content and approval of the final version submitted for publication.
Declaration of conflicting interests
The authors declare no conflict of interest with respect to the research, authorship, and/or publication of this article.
Funding
The author(s) disclosed receipt of the following financial support for the research, authorship, and/or publication of this article: This study is supported by a grant from Kitasato University Hospital (Grant-in-Aid for Research Project, No. 2017-3, No. 2018-1).
Ethical approval
Not applicable.
Guarantor
YK (Yuhsaku Kanoh).
Supplemental material
Supplemental material for this article is available online.
References
Supplementary Material
Please find the following supplemental material available below.
For Open Access articles published under a Creative Commons License, all supplemental material carries the same license as the article it is associated with.
For non-Open Access articles published, all supplemental material carries a non-exclusive license, and permission requests for re-use of supplemental material or any part of supplemental material shall be sent directly to the copyright owner as specified in the copyright notice associated with the article.