
Abstract
Background
The enzymatic method of caeruloplasmin measurement is based on copper-dependent oxidase activity. The advantage of the oxidase determination is that it has a much lower detection limit compared with immunoassay-based methods. It has found its application in both the diagnosis of Wilson’s disease and also in the monitoring of patients’ response to treatment.
Methods
The method previously described in literature was adapted for use on a 96-well plate. Caeruloplasmin oxidase activity results were derived from the equation: caeruloplasmin oxidase activity = (A15−A5) × 185 U/L.
Results
Repeatability (intra-batch) imprecision ranged from 6 to 15% and intermediate (inter-batch) imprecision varied from 7 to 16% for caeruloplasmin oxidative activities of 14, 29, 45 and 99 U/L. Between 3 and 92 U/L, the assay appeared linear with a regression coefficient R2 = 0.9958. The lower limit of quantification was 4 U/L. Samples were stable over a five-week period at 4℃ and for at least four freeze–thaw cycles. There was a statistically significant difference between the areas under ROC curve for copper-to-caeruloplasmin ratios between caeruloplasmin oxidative activity and immunoassay-based methods (P < 0.0171). The reference interval for caeruloplasmin activity was determined to be 12–166 U/L.
Conclusions
Using the oxidative assay provides a cost-effective means of estimating caeruloplasmin concentrations. The method is easily adaptable to a 96-well plate format that facilitates high throughput of samples in a busy laboratory. The enzymatic method is more sensitive and specific for differentiating between Wilson’s and non-Wilson’s when compared with immunoassay-based methods.
Introduction
The determination of serum caeruloplasmin concentration is usually considered the most useful screening test for suspected Wilson’s disease. 1 Caeruloplasmin is an alpha2-globulin, a blue acute-phase protein of Mr = 132,000. 2 The reference interval for caeruloplasmin is approximately 200–600 mg/L (0.2–0.6 g/L) with mean concentrations for men 333 mg/L (SD ± 60.7) and for women 366 mg/L (SD ± 92.8). 1 For comparison, in patients with untreated Wilson’s disease, the concentration can be as low as 63.6 (SD ± 87.6) mg/L. 1 Low serum caeruloplasmin concentrations can also be found in patients with protein-losing enteropathy, nephritic nephrotic syndrome, severe protein calorie malnutrition, severe liver disease or the rare disorder acaeruloplasminaemia.1,3,4 As caeruloplasmin is an acute phase reactant, increases in concentration occur during acute and chronic inflammatory processes. Increases may also be seen in chronic liver disease, pregnancy and treatment with oestrogen.2,4,8 Caeruloplasmin concentrations can be measured by either immunoassay or enzymatically, the latter being based on copper-dependent oxidase activity. Most biochemistry laboratories now use immunological methods as they are readily automated. These assays measure both apocaeruloplasmin and caeruloplasmin.1,5 However, apocaeruloplasmin does not contain copper and has no enzymatic activity. 1 It has been shown that caeruloplasmin concentrations measured by immunoassay are higher than those obtained by an enzymatic method particularly in patients with Wilson’s disease. 1 Additionally, the immunological method can give falsely low (or even negative) calculated values for ‘free’ copper,1,6,7 whereas the values of free copper obtained by an enzymatic method give positive values. Another advantage of measuring caeruloplasmin enzymatically is that the enzymatic method has a much lower detection limit as compared with immunoassay-based methods. 1 Caeruloplasmin oxidative activity has also been shown to be useful in the follow-up of patients with Wilson’s disease. 8
Additional problems with immunoassay-based methods exist due to standardization, with immunoassay measurements that utilize different antibodies giving differing results as observed in External Quality Assurance scheme reports (even using certified reference sera). 9 It has been demonstrated that the caeruloplasmin antibodies of immunoturbidimetric commercial kits recognize both functional holocaeruloplasmin and non-functional fragments of apocaeruloplasmin. 1 This can potentially hinder the diagnostic effectiveness of caeruloplasmin measurement and particularly questions its use in calculating serum-free copper. It is advocated, therefore, that measurement of caeruloplasmin by enzymatic means gives a better measure of the true level of the protein present and may be better in diagnosis and for monitoring response to treatment. 8 Although automated assays have been described in the literature,10,11 a lack of commercially available enzymatic assays has hindered both the evaluation of this type of assay and the introduction into routine use.
The aim of this paper is to develop and evaluate an alternative enzymatic method for caeruloplasmin that would improve the diagnostic accuracy of the assay and to compare the performance of it with an immunoassay-based method.
Methods
Samples
One hundred and seventy-five serum samples were selected randomly from requests received in our laboratory. Of these, 25 had abnormal liver function tests, 31 had a raised C-reactive protein (CRP) concentration (above 5 mg/L), 22 had both impaired liver function tests and raised CRP concentration and 45 had normal CRP concentration and normal liver function tests. All samples were anonymized before further testing. Additionally, we used 52 serum samples from patients with known Wilson’s disease. Caeruloplasmin was measured in all samples by immunoturbidimetry using a Roche Cobas c701/702 analyser (coefficient of variation (CV) = 1.6% at a caeruloplasmin concentration of 0.290 g/L). All samples had serum copper measured by atomic absorption spectrophotometry (SpectrAA 220FS, Agilent Technologies, UK).
Principles of the enzymatic assay
This method, utilizing the oxidase activity of caeruloplasmin, is based on a publication by Schosinsky et al.
12
The method utilizes o-dianisidine dichloride (4,4′-diamino-3,3′-dimethoxy-biphenyl) as substrate (Figure 1). In the presence of oxygen, this is oxidized by caeruloplasmin to an undetermined chromophore which can be measured spectrophotometrically. All measurements were performed in duplicate. Caeruloplasmin oxidase activity results are expressed in U/L (quoted reference interval: 62–140 U/L).
12
Reaction scheme.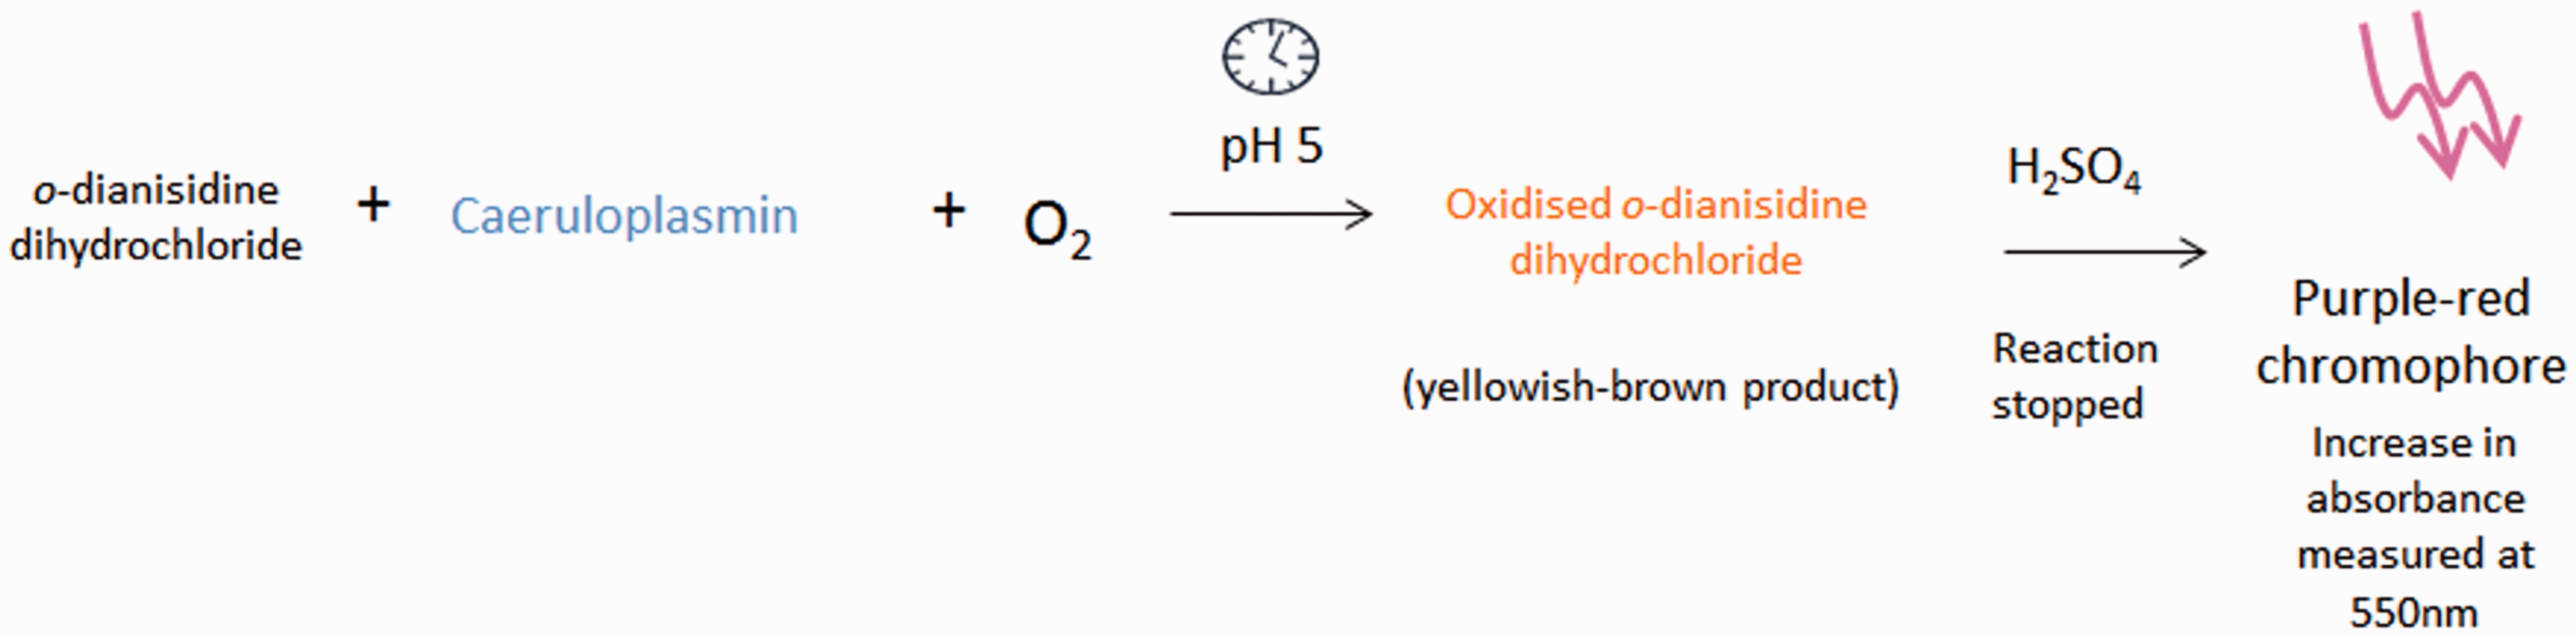
Reagents
Acetate buffer solution: pH 5, ionic strength 0.1; 13.61 g of sodium acetate × 3H2O (Merck, Darmstadt, Germany), 2.6 mL of glacial acetic acid (Baker Chemical Co., Deventer, The Netherlands) were mixed with 990 mL of water in a volumetric flask. The pH was measured with a pH meter and the pH adjusted to 5 by addition of 0.1 mol/L NaOH or glacial acetic acid. It was stored at 4℃.
Sulphuric acid: 9 mol/L. Concentrated sulphuric acid (Baker Chemical Co., Deventer, The Netherlands) of 18 mol/L was added to an equal volume of water to prepare a 9 mol/L solution. o-dianisidine dihydrochloride: 7.88 mmol/L. 50 mg of o-dianisidine dihydrochloride (Sigma-Aldrich, Deisenhofen, Germany) was dissolved in 20 mL of distilled water in a brown glass bottle to protect it from light. It was stored refrigerated at 4℃.
Procedure
Acetate buffer (80 µL) was pipetted into two separate 96-well plates (one marked ‘5 min’ and the other ‘15 min’) followed by the addition of 20 µL of serum sample to each individual well. Both plates were placed in a 30℃ water bath. We allowed 5 min for temperature equilibration before pipetting 25 µL o-dianisidine dihydrochloride reagent (preincubated at 30℃) into each well on both plates. Both ‘5 min’ and ‘15 min’ plates were placed into the water bath and after exactly 5 min, the first plate was taken out from the water bath and 230 µL of the 9 mol/L sulphuric acid was added and mixed immediately. After exactly 15 min, the ‘15 min’ plate was taken out and 230 µL of 9 mol/L sulphuric acid was added and mixed immediately. The absorbances of the purplish-red solutions (oxidized o-dianisidine dihydrochloride) were measured at 550 nm on a Vmax™ Kinetic Microplate (Molecular Devices Corporation, USA) reader with reference wavelength of 650 nm. Absorbances were measured at fixed time points (5 and 15 min) as the addition of acid is required for chromophore development. The sample wavelength is generally chosen to be near the wavelength of maximum absorption for the chromophore of interest. The reference wavelength is chosen to be a wavelength at which the chromophore (oxidized o-dianisidine dihydrochloride) shows little absorption. Although the absorption maximum of the reaction product is 540 nm, the nearest pre-set wavelength that could be achieved on the plate reader was 550 nm. All plates were maintained at 30℃ during the enzymatic reaction.
Method validation
Repeatibility
We performed repeatability and intermediate precision experiments. Four serum samples with known caeruloplasmin concentration (0.08, 0.15, 0.26 and 0.33 g/L) were analysed in five replicates. Results had corresponding oxidative caeruloplasmin activity: 14, 29, 45 and 99 U/L. Subsequently, the mean, SD and CV were calculated to establish repeatability and intermediate precision. Similarly, the same samples with four different caeruloplasmin activities were used for intermediate precision experiment. The analysis was repeated in five separate runs on different days.
Linearity
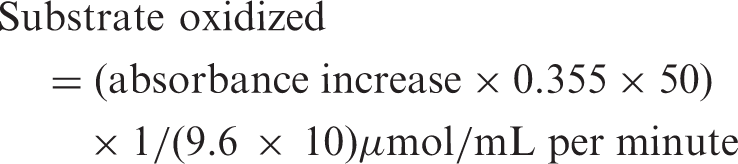
Linearity of caeruloplasmin oxidase assay was assessed using one patient’s sample (caeruloplasmin = 0.44 g/L, 143.2 U/L). We used dilutions: 1 in 2, 1 in 4, 1 in 8, 1 in 16, 1 in 32, 1 in 64, 1 in 128 prepared with physiological saline (0.9%). Measurements were performed in duplicate and the mean absorbance was calculated.
Limit of detection
The limit of detection was defined as the mean of 10 results of a blank ± 3 SDs. 0.9% saline was used as a blank.
Limit of quantification
The lower limit of quantification was defined as the activity at which a CV of ≤20% was given. Serial dilution of a serum sample (caeruloplasmin = 0.44 g/L) was prepared: 1 in 2, 1 in 4, 1 in 8, 1 in 16, 1 in 32, 1 in 64, 1 in 128. All samples were analysed 10 times and, subsequently, the mean, SD and CV were calculated for each individual dilution.
Stability
Ten serum samples with different caeruloplasmin activities were kept in the fridge at 4℃ over 35 days. They were analysed on days 0, 4, 7, 14, 21 and 35 in duplicate. Mean absorbance and SDs were calculated at time points.
Freeze–thaw cycles
Ten serum samples with different caeruloplasmin activities were frozen at −20℃ and subsequently thawed. The freeze–thaw cycle was repeated four times. Mean absorbance and standard deviations for 10 samples were calculated.
Interferences
Haemolytic index: The experiment was performed by using an in-house method of haemolysate preparation. Haemolytic index was calculated based on the haemoglobin concentration: 5 g/L Hb = 500 of haemolytic index. The experiment was performed for two caeruloplasmin activities: 69 U/L and 52 U/L. Lipaemic index: The experiment was performed by preparing a serial dilution of Intralipid (200 g/L = 2.258 mmol/L). We prepared dilutions as follows: 1 in 20, 1 in 40, 1 in 100, 1 in 200, 1 in 400 which approximately corresponded to triglyceride concentrations: 0.113, 0.056, 0.023, 0.0113 and 0.006 mmol/L, respectively. Icteric index: The experiment was performed by adaptation of the World Health Organisation Guidelines on Standard Operating Procedures for Clinical Chemistry.
13
The experiment was repeated for two caeruloplasmin activities: 49 and 94 U/L. Tubes with anticoagulants: Caeruloplasmin activity was measured in a pool of serum samples (0.24 g/L = 75 U/L). Subsequently, the serum was transferred into EDTA, lithium heparin, fluoride oxalate and citrate tubes and mixed thoroughly. Caeruloplasmin concentration was measured by immunoassay and the caeruloplasmin oxidative activity was estimated by the enzymatic method. Samples were analysed in duplicate.
Calculations

9.6 = molar absorptivity of chromophore (oxidized o-dianisidine dihydrochloride) in terms of substrate consumed (mL µmol−1 cm−1) (1); 0.355 mL = correction factor for the final measured solution volume; 50 = correction for serum volume used (0.02 mL); and 10 = incubation time (min); 1 = pathlength of microtitre well.
Results
Samples
The median (range) caeruloplasmin concentration by immunoassay was 0.18 (0–0.44) g/L.
Wavelength
Before we proceeded with the method development work, the reaction product from the enzymatic reaction was scanned between 440 and 640 nm. This showed that there was little difference between absorbances given at 540 and 550 nm (the latter being the nearest pre-set wavelength on the microplate reader).
Precision
The intermediate imprecision (%CV) varied between 7 and 16% for different caeruloplasmin oxidative activities (14, 29, 45 and 99 U/L) using a sample volume of 20 µL. Repeatability (within batch CV) varied between 6 and 15% for different caeruloplasmin oxidative activities and was not activity dependent. Total imprecision varied between 9 and 22%. The uncertainty of measurement varied between 17.6% and 43%.
Linearity
Between 3 and 92 U/L, the assay appeared linear with a regression coefficient R2 = 0.9958. At high activity, the assay appeared to be less linear (Figure 2(a)). The assay was linear at low activity (<25 U/L), R2 = 9414.
Linearity experiment; assay was linear up to 92 U/L (0.11 g/L) as shown in Figure B. R2 = 0.9958. (a) showing assay is curvilinear at caeruloplasmin values of 143 U/L (0.44 g/L); R2 = 0.9958. (a) Linearity up to 143 U/L (b) Linearity up to 92 U/L.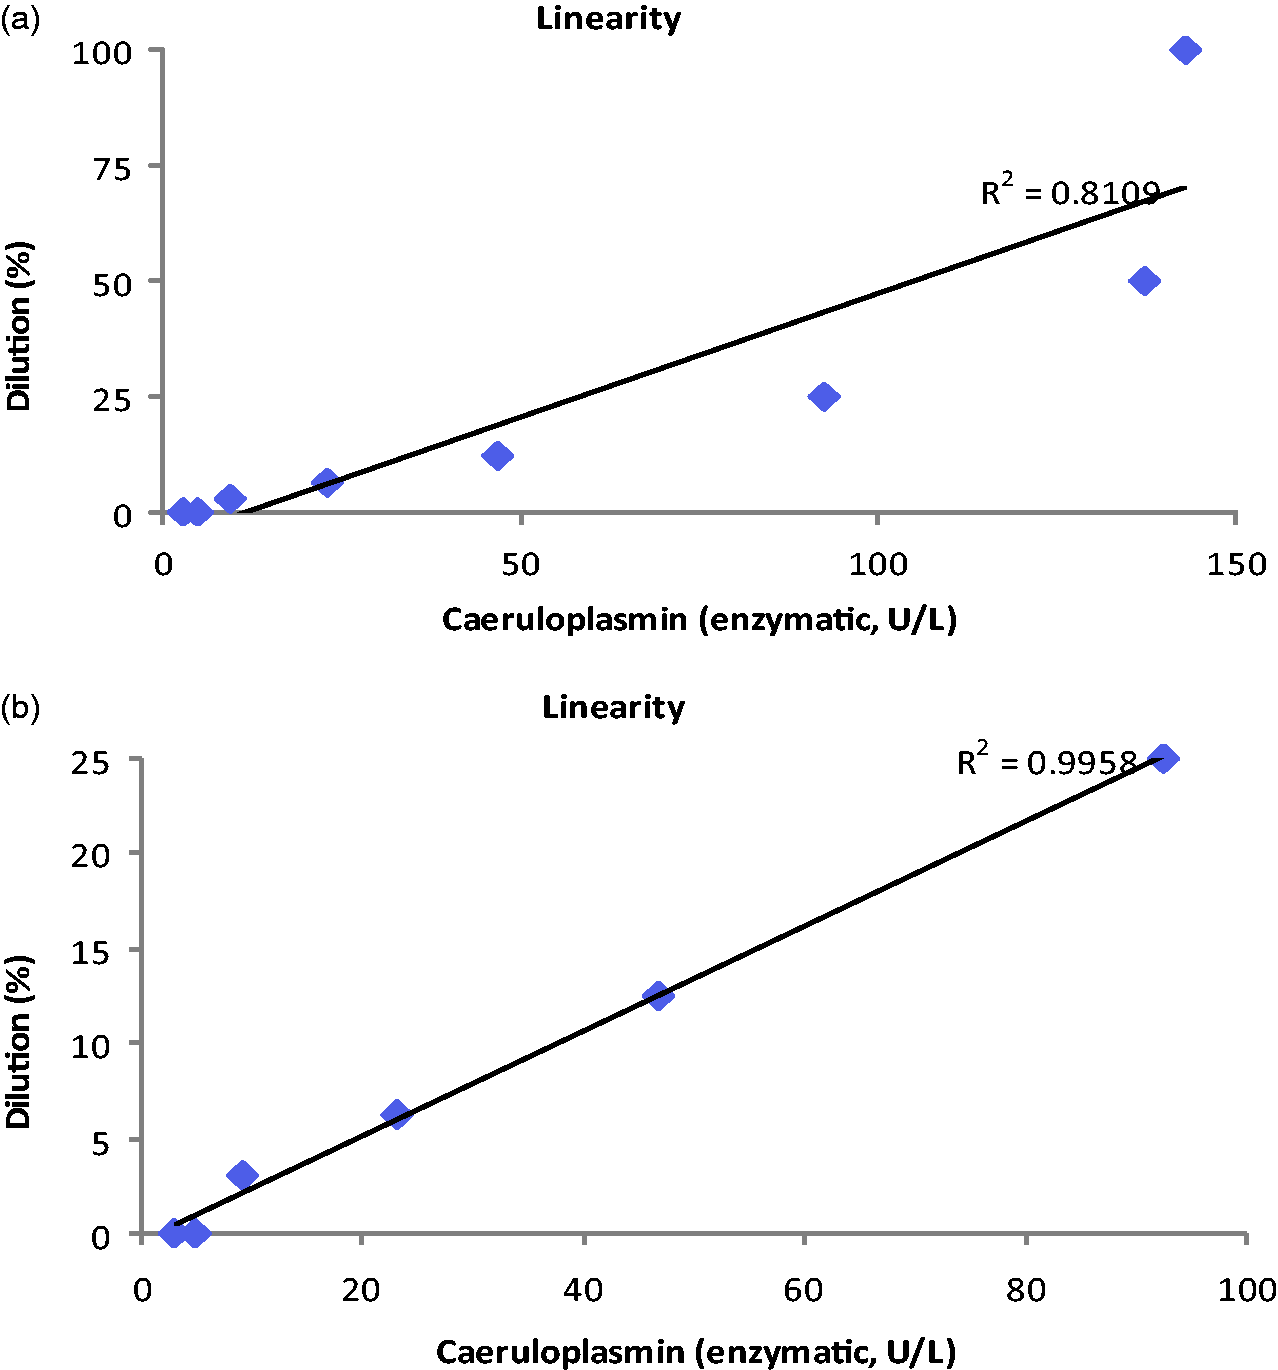
Limit of detection
The limit of detection determined from blank measurement was found to be 0.00563 absorbance units, equivalent to 0.444 U/L.
Limit of quantification
The lower limit of quantification was approximately 4 U/L.
Stability
The stability study showed that there was no significant change in caeruloplasmin activity over a five-week period, suggesting there was little degradation. The range of mean caeruloplasmin oxidative activities was 74 (SD ± 20) to 96 (SD ± 19.5). The mean percentage change over 5 weeks was 1% (P = 0.6913).
Freeze–thaw cycles
The range of caeruloplasmin oxidative activity means was 77 (SD ± 19) to 86 (SD ± 26). The mean percentage difference was 4% (P = 0.0975).
Interferences
Haemolytic index
The Roche Immunoassay kit for caeruloplasmin did not show any significant interference up to 1000 (equivalent to 621 µmol/L haemoglobin). Our experiment confirms this finding for caeruloplasmin oxidative activity.
Lipaemic index
The Roche Immunoassay caeruloplasmin kit does not report any significant interference up to 2.258 mmol/L. This experiment performed by the use of caeruloplasmin oxidative activity did not show any significant interference for lipaemic index up to 11.29 mmol/L.
Icteric index
The Roche immunoassay kit for caeruloplasmin does not indicate any significant interference up to an icteric index of 60 (approximate conjugated and unconjugated bilirubin concentration: 1026 µmol/L [60 mg/dL]). Our experiment examining the effect of unconjugated bilirubin concentration of above 8000 µmol/L did not show any significant changes in caeruloplasmin oxidative activity for the two tested activities: 49 and 94 U/L.
Interference with anticoagulants
Interference of four different anticoagulants in the caeruloplasmin oxidative activity assay with reference to SST sample (SST result equals 100%). Fluoride oxalate decreases it by approximately 24%.
LiHep: lithium heparin; FlOx: fluoride oxidase; EDTA: ethylenediaminetetraacetic acid.
Reference intervals
The reference interval for the enzymatic method determined from 123 non-Wilson’s disease patients was found to be 12–166 U/L.
Correlations
There was a good correlation between caeruloplasmin concentration (g/L) by immunoassay versus caeruloplasmin oxidative activity (U/L) by the enzymatic method (R2 = 0.763) (Figure 3(a)).
Correlation of caeruloplasmin concentration (g/L) by immunoassay versus caeruloplasmin oxidative activity (U/L) by enzymatic method (R2 = 0.763) (Deming method) (a). ROC curve for Wilson’s disease patients compared to non-Wilson’s disease people (three other groups; those with abnormal liver function tests and/or raised CRP and healthy controls). Area under the curve (AUC) for immunoassay was 0.99 (95% CI: 0.98–1.0) and AUC for enzymatic method was 0.99 (95% CI: 0.99–1.0) (b).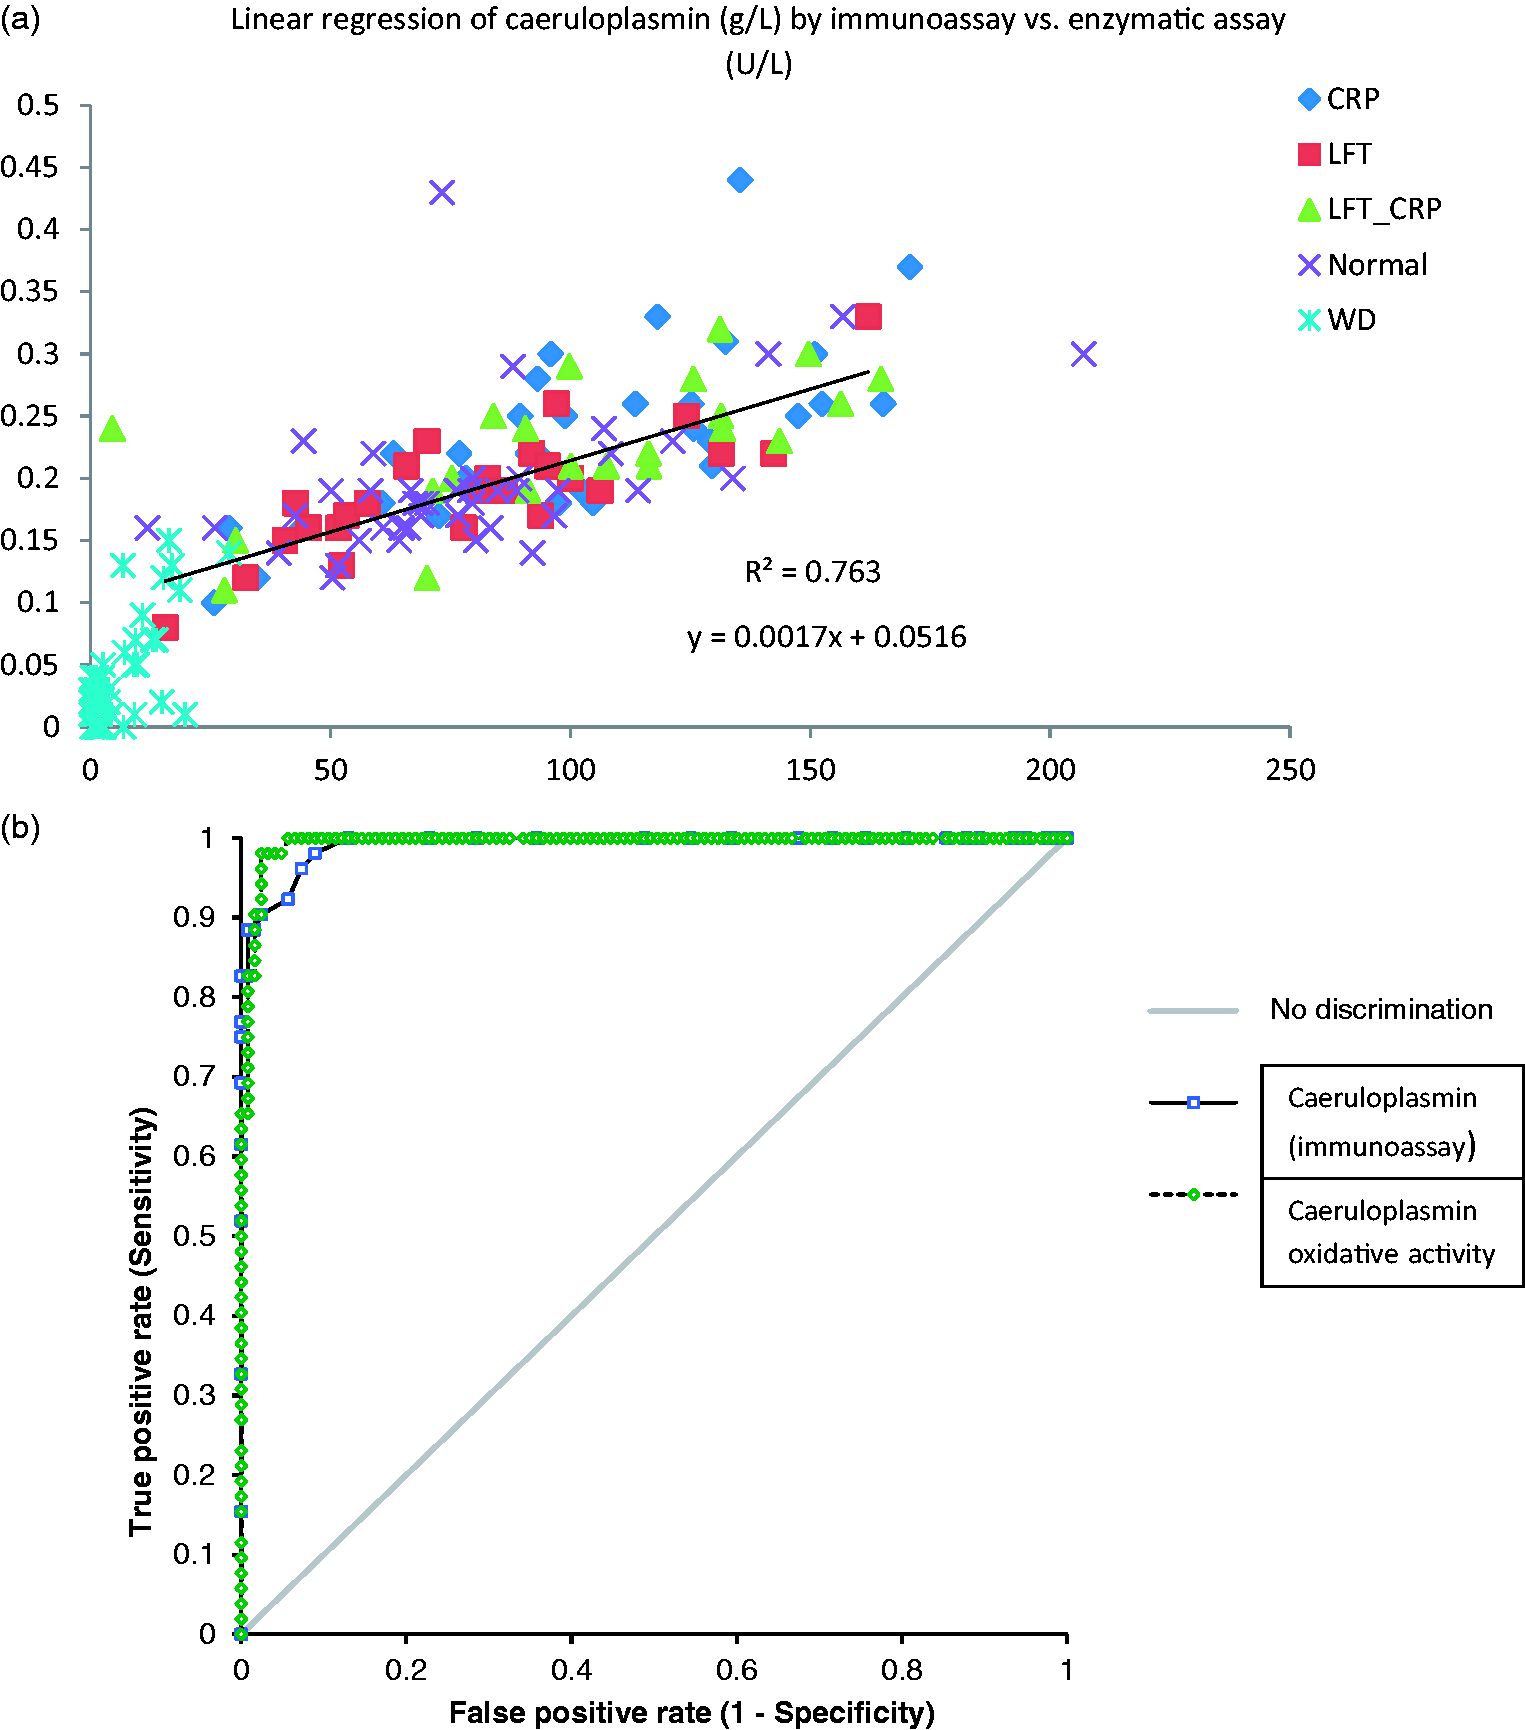
Measuring caeruloplasmin oxidative activity appeared to be more sensitive and more specific in diagnosing Wilson’s disease as shown by the determination of receiver operating characteristic (ROC) curves for both methods for Wilson’s disease versus all other caeruloplasmin results (Figure 3(b)). However, statistical significance was not achieved.
Significant differences were observed in caeruloplasmin oxidative activity (Figure 4(a)) and caeruloplasmin concentration measured by immunoassay (Figure 4(b)) between patients with Wilson’s disease and patients in the three remaining groups: healthy people, those with abnormal liver function tests and raised CRP (P < 0.001). Median serum caeruloplasmin oxidase activity was significantly lower in the serum samples of Wilson’s disease patients (2.035 U/L [IQR: 0.9–9.17]) than in healthy controls (76 U/L [IQR: 60.27–90]), P < 0.0001 and patients with abnormal liver function tests (91 U/L [IQR: 59–123]), P < 0.0001 and compared to patients with raised CRP (100 U/L ([IQR: 76–131]), P < 0.0001 (Figure 4(a)). Serum caeruloplasmin concentration was also significantly lower in serum samples of Wilson’s disease patients (0.02 g/L [IQR: 0.01–0.05]) than in healthy controls (0.19 g/L [IQR: 0.16–0.2]), P < 0.0001, and patients with abnormal liver function tests (0.21 g/L [IQR: 0.17–0.24]), P < 0.0001 and compared to patients with raised CRP (0.23 [IQR: 0.19–0.26]), P < 0.0001 (Figure 4(b)).
Caeruloplasmin oxidative activity (a) and caeruloplasmin concentration measured by immunoassay (b) showing significant difference between patients with Wilson’s disease and the three remaining groups: healthy people, those with abnormal liver function tests and raised CRP. Distribution of data displayed in box and whisker plots: minimum, 25th percentile, median, 75th percentile, maximum.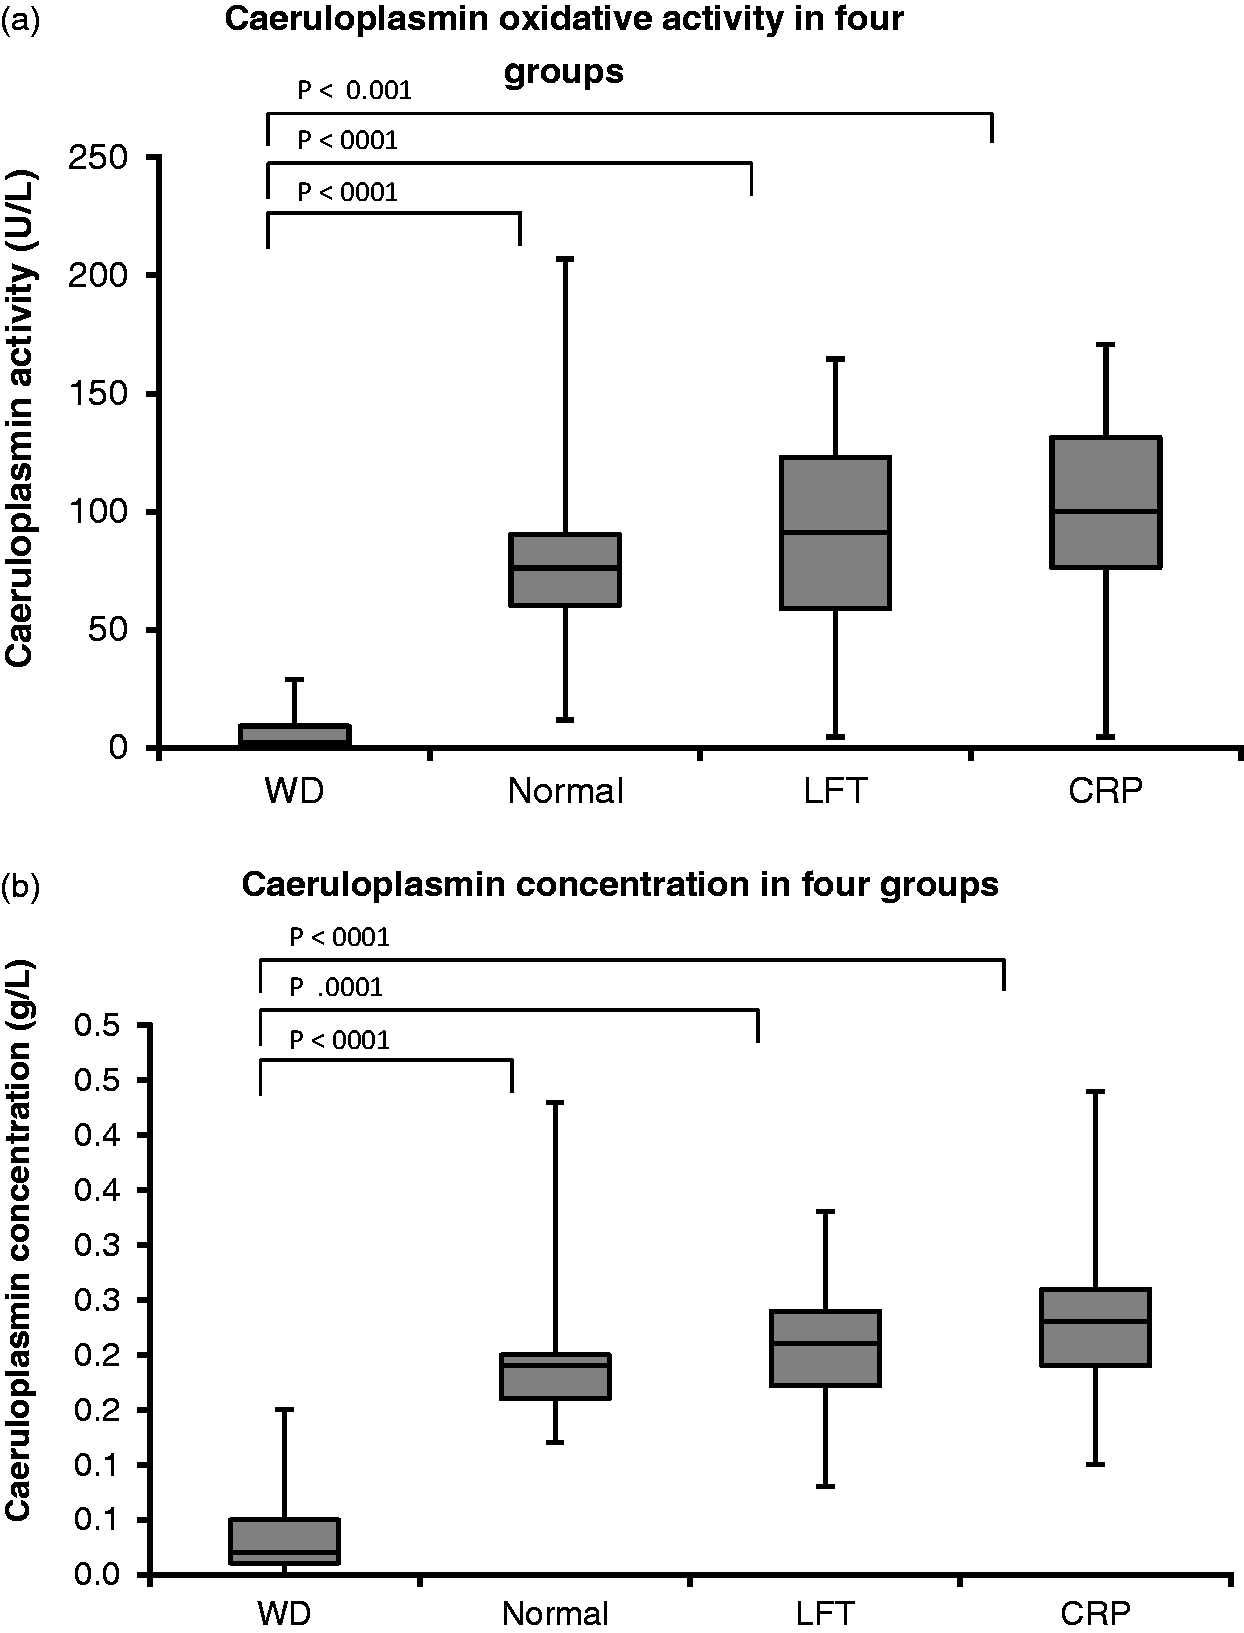
Copper-to-caeruloplasmin ratio
For caeruloplasmin oxidative activity the median of copper-to-caeruloplasmin ratio was 84 (IQR: 76.6–90) whereas for the immunoassay the copper to caeruloplasmin ratio was 0.223 (IQR: 0.177–0.358). The ROC curve for the copper-to-caeruloplasmin ratio by caeruloplasmin oxidative activity had the cut-off value of 0.33 µmol/U (sensitivity 81.8% and specificity 91.8%) and by the immunoassay cut-off value was 75 µmol/g (sensitivity 63.6% and specificity 93.4%). There was a statistically significant difference between areas under ROC curve for copper to caeruloplasmin ratios between caeruloplasmin oxidative activity and immunoassay methods (P < 0.0171) (Figure 5).
ROC curve of copper to caeruloplasmin ratio (Wilson’s disease group vs. non-Wilson’s disease). Area under the curve was 0.69 (95% CI: 0.56–0.83) for Immunoassay and 0.88 (95% CI: 0.80–0.96) for caeruloplasmin oxidative activity (P < 0.0171).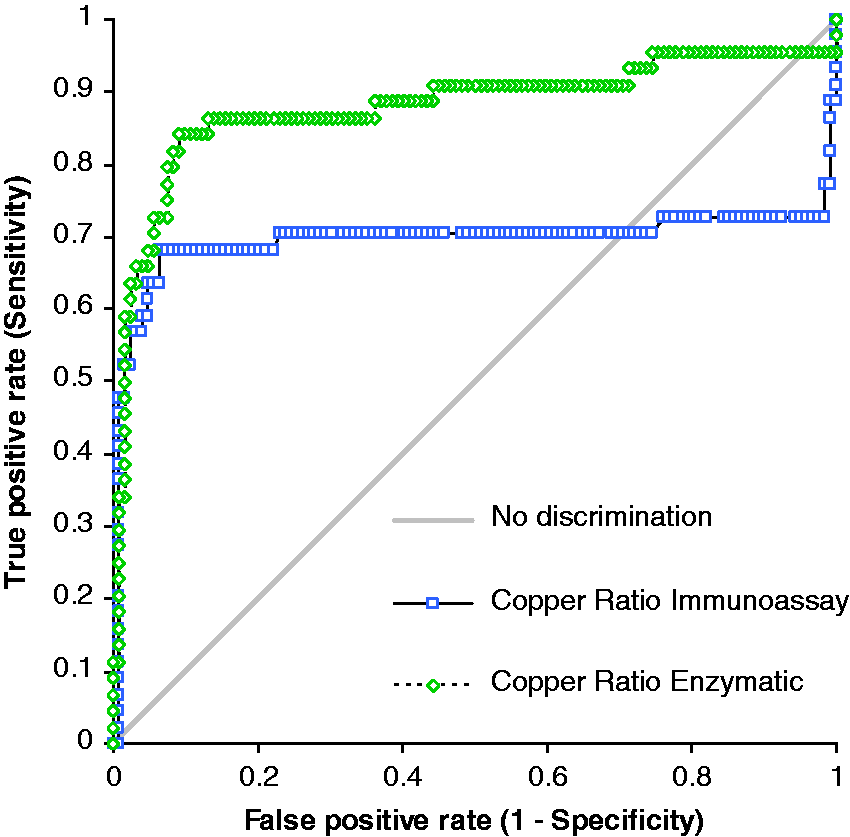
Discussion
This article describes the enzymatic method for the determination of serum caeruloplasmin from its oxidase activity, in which o-dianisidine dihydrochloride is used as a substrate. Importantly, some adjustments have been made to the original method described by Schosinsky et al. 12 Volumes of all reagents have been adjusted: acetate buffer volume was decreased by a factor of 9.4, o-dianisidine dihydrochloride has been reduced in volume by a factor of 8 and sulphuric acid by a factor of 8.7 from that used in the originally described method. The volumes have been adjusted as the method was developed on a 96-well plate with a single well volume of not more than 400 µL. One of the benefits of using a 96-well plate is that the method is easy to perform and has the ability to analyse many samples simultaneously. In addition, reduction of assay volume conserves both sample and reagents and makes it cost-effective. A major advantage of this assay over the method by Schosinsky et al. 12 is the substantial reduction in the time needed for measuring enzyme activity. Whilst the precision is not as good as that of the immunoassay, we nevertheless believe it to be acceptable. We have considered the possibility of automating the method using automatic pipetting or translating the method to an automated analyser. This may improve the precision significantly and improve the throughput of samples.
As o-dianisidine dihydrochloride is a carcinogenic agent, we ensured that all necessary safety precautions had been followed to prevent any direct contact with the chemical. The available literature describes other substrates, e.g. p-phenylenediamine 14 and N, N-dimethyl-p-phenylenediamine (DPPD) monohydrochloride 15 used for determining quantitatively copper oxidase activity of plasma or serum. However, the method described by Schosinsky et al. 12 used o-dianisidine dihydrochloride substrate. We therefore adapted their protocol to minimize any errors. Additionally, o-dianisidine dihydrochloride is not subject to catalytic oxidation by metal ions normally found in serum. 12 In addition, the substrate is stable over a long period of time and the colour is not affected by light. 12 The enzymatic method with the o-dianisidine dihydrochloride is demonstrably more sensitive as compared to the method that uses the other two substrates. 12
Although the immunoassay reference intervals are established for a healthy population, we rarely see caeruloplasmin values higher than 0.45 g/L (e.g. in pregnancy). Notably, the enzymatic assay was only linear up to 92.5 U/L and therefore poor linearity at higher caeruloplasmin concentrations (>0.11 g/L) may affect the upper reference limit. For the diagnosis of Wilson’s disease, the demonstration of low concentrations of caeruloplasmin and/or very low oxidative activity is important. The upper reference limit of caeruloplasmin is not relevant in the diagnosis of Wilson’s disease as clinicians are only interested in low caeruloplasmin values. Finally, variable repeatability resulted in the scattering of results that, in turn, contributed to the poor linearity seen at higher caeruloplasmin activity. The reference interval we derived from 123 non-Wilson’s disease samples (12–166 U/L) is similar to that cited in the literature (62–140 U/L). 12 Notably, the lower reference limit is low, suggesting that some Wilson’s disease patients may remain underdiagnosed.
The data confirm that the enzymatic method is more sensitive and more specific (Figure 3(b)). Those patients with Wilson’s disease and no or reduced incorporation of copper into caeruloplasmin would have little copper oxidase activity but possible measurable caeruloplasmin by immunoassay (as this detects both apo- and holocaeruloplasmin). Theoretically, this should therefore give better discrimination between Wilson’s and non-Wilson’s disease patients.
The copper-to-caeruloplasmin ratio has been previously described as a possible indicator of Wilson’s disease diagnosis. 16 The advantage of using it is that it removes the need to convert units from g/L to U/L. The ROC curve for copper-to-caeruloplasmin ratio by caeruloplasmin oxidative activity had a better sensitivity and specificity than that by the immunoassay (P < 0.0171) (Figure 5).
In terms of interferences, EDTA interference has been described in the literature 12 as lowering caeruloplasmin activity by 19%. Furthermore, oxalate and lithium heparin-coated tubes resulted in 97% and 9% inhibition. 12 Our study showed that EDTA increased caeruloplasmin oxidative activity by approximately 5% and lithium heparin by 6%, values that fall within the repeatability of the assay. These small changes could be accounted for by the imprecision of the method. We have also noted a decrease in caeruloplasmin oxidative activity of 24.3% in serum collected into tubes containing fluoride oxalate, whereas oxidase activity remained stable in samples collected into tubes containing citrate. It remains the limitation of the study that this particular experiment was restricted to one pool of serum samples. For completion, analysis of several paired patient samples in each of the different tubes should be undertaken and results compared.
The method has several other limitations. Firstly, there are no National Institute of Standard and Technology (NIST) reference materials or quality control materials available. We have referred to the method that had been established before7,12 and measured differences in absorbance values and therefore no NIST materials were used. The certified reference material employed in immunoturbidimetric assays (ERM-DA470k/IFCC) has shown a marked non-commutability for combinations of methods. 9 Therefore, the conversion from enzyme activity to mass values may not be accurate and appropriate. Standardization of the enzyme method is relatively straightforward if it was to be a routine method for all laboratories. The enzymatic method seems to be more appropriate when compared to immunoassay in calculation of the free copper index as it gives fewer negative results. 9 Immunoassay also has its limitations due to antibody reactivity. Walshe had demonstrated that the caeruloplasmin concentration values obtained immunologically were consistently higher than the caeruloplasmin oxidase values. 1
Automation of this method may improve assay performance and there is an obvious need to develop a robust reference interval for caeruloplasmin activity in our population of patients.
Footnotes
Acknowledgement
We acknowledge the assistance of Clinical Biochemistry Laboratory staff in Salford for the copper analysis. We would like to thank the Biochemistry Laboratory in Sheffield for providing us with serum samples from patients known to have Wilson’s disease and supplying results.
Declaration of conflicting interests
The author(s) declared no conflict of interest with response to this research, authorship and publication of this article.
Funding
The author(s) received no financial support for the research, authorship, and/or publication of this article.
Ethical approval
Not applicable.
Guarantor
MG.
Contributorship
KMS undertook the research and wrote the first draft. MG was the supervisor throughout the research project and edited the manuscript.