
Abstract
Clinical biochemists often wish to compare two groups of measurements. In order to do so, they must be familiar with Student's t-test. This article provides guidance for the use of the Welch t-test, with subtle but important differences and validity in a broader range of settings: advises the use of the Welch t-test rather than Student's t-test.
Keywords
Introduction
The clinician or scientist is often involved with statistical analysis, and practical guidance can be appreciated. This article covers the situation where two groups are to be compared; for example, biochemical measurements in individuals with and without a particular disease. Do the measurements in the diseased group differ sufficiently, in statistical terms, from those in the non-diseased group? A formal hypothesis test is required. The following considers the practical steps to be taken, with some explanation, but omitting the detail of mathematical theory.
When is a t-test valid?
There are advantages to the use of a t-test rather than a non-parametric test. It has a little more power when it is valid, and the result is easier to interpret. The alternative hypothesis (to the null hypothesis) is more simply stated: specifically that the means of the groups differ.
Technically, the assumption for t-test validity is that the statistical samples come from a normal distribution. The null hypothesis is that the means and standard deviations of the two groups are the same, which gives the same distribution for the two groups. In practice, the t-test is robust against departures from normality as long as the distribution is reasonably symmetric, i.e. the distribution is not skewed. In clinical science, this often comes down to the mean of the distribution being greater than twice the standard deviation, in the case where all measurements are positive (e.g. analyte concentrations). In this situation, the Central Limit Theorem ensures that when the sample size is sufficiently large (in practical terms n ≥ 50), then the means are normally distributed.
So, in short, use a t-test where the data are normally distributed, or where there are at least 50 measurements and the distribution is reasonably symmetric rather than skewed. It is not particularly worthwhile testing for normality with, e.g. the Shapiro-Wilks test: for small samples, the test for normality is not very powerful; for large samples, the t-test is robust provided the distribution is not skewed.
Equal standard deviations
The original Student's t-test requires that the standard deviations (or equivalently the variances) of the two groups/samples to be the same. 1 In practical terms, the test will be robust if the standard deviations are similar. There is, however, a better approach: the Welch t-test. This allows for the standard deviations to be different and has almost as much power as Student’s t-test. (Other names for this are the Scatterthwaite t-test, or the unequal-variances t-test.) 2 With contemporary statistical software, this approach is just as easy to use. The number of degrees of freedom is calculated by the Welch-Scatterthwaite equation; in most cases, this yields a number which is not a whole number. This means that the Welch t-test is easily recognized even if not explicitly declared as such by the statistical software output.
The best statistical practice is not to test for differences in the standard deviations 3 but to proceed immediately with a Welch t-test. If the statistical software used does not offer a Welch t-test, then another statistical package should be sought.
A worked example
Samples were drawn for Group 1 (n = 11), a normal distribution with mean 4.0 and standard deviation 1.0, and for Group 2 (n = 22) with mean 3.0 and standard deviation 1.5. Here, these give sample means of 4.18 and 2.84. Figure 1 provides a boxplot showing the essential details of the sample. The boxplot visualizes the ranges, medians and quartiles and is consistent with measurements being drawn from two normal distributions. Such a visual check is always useful and reassuring.
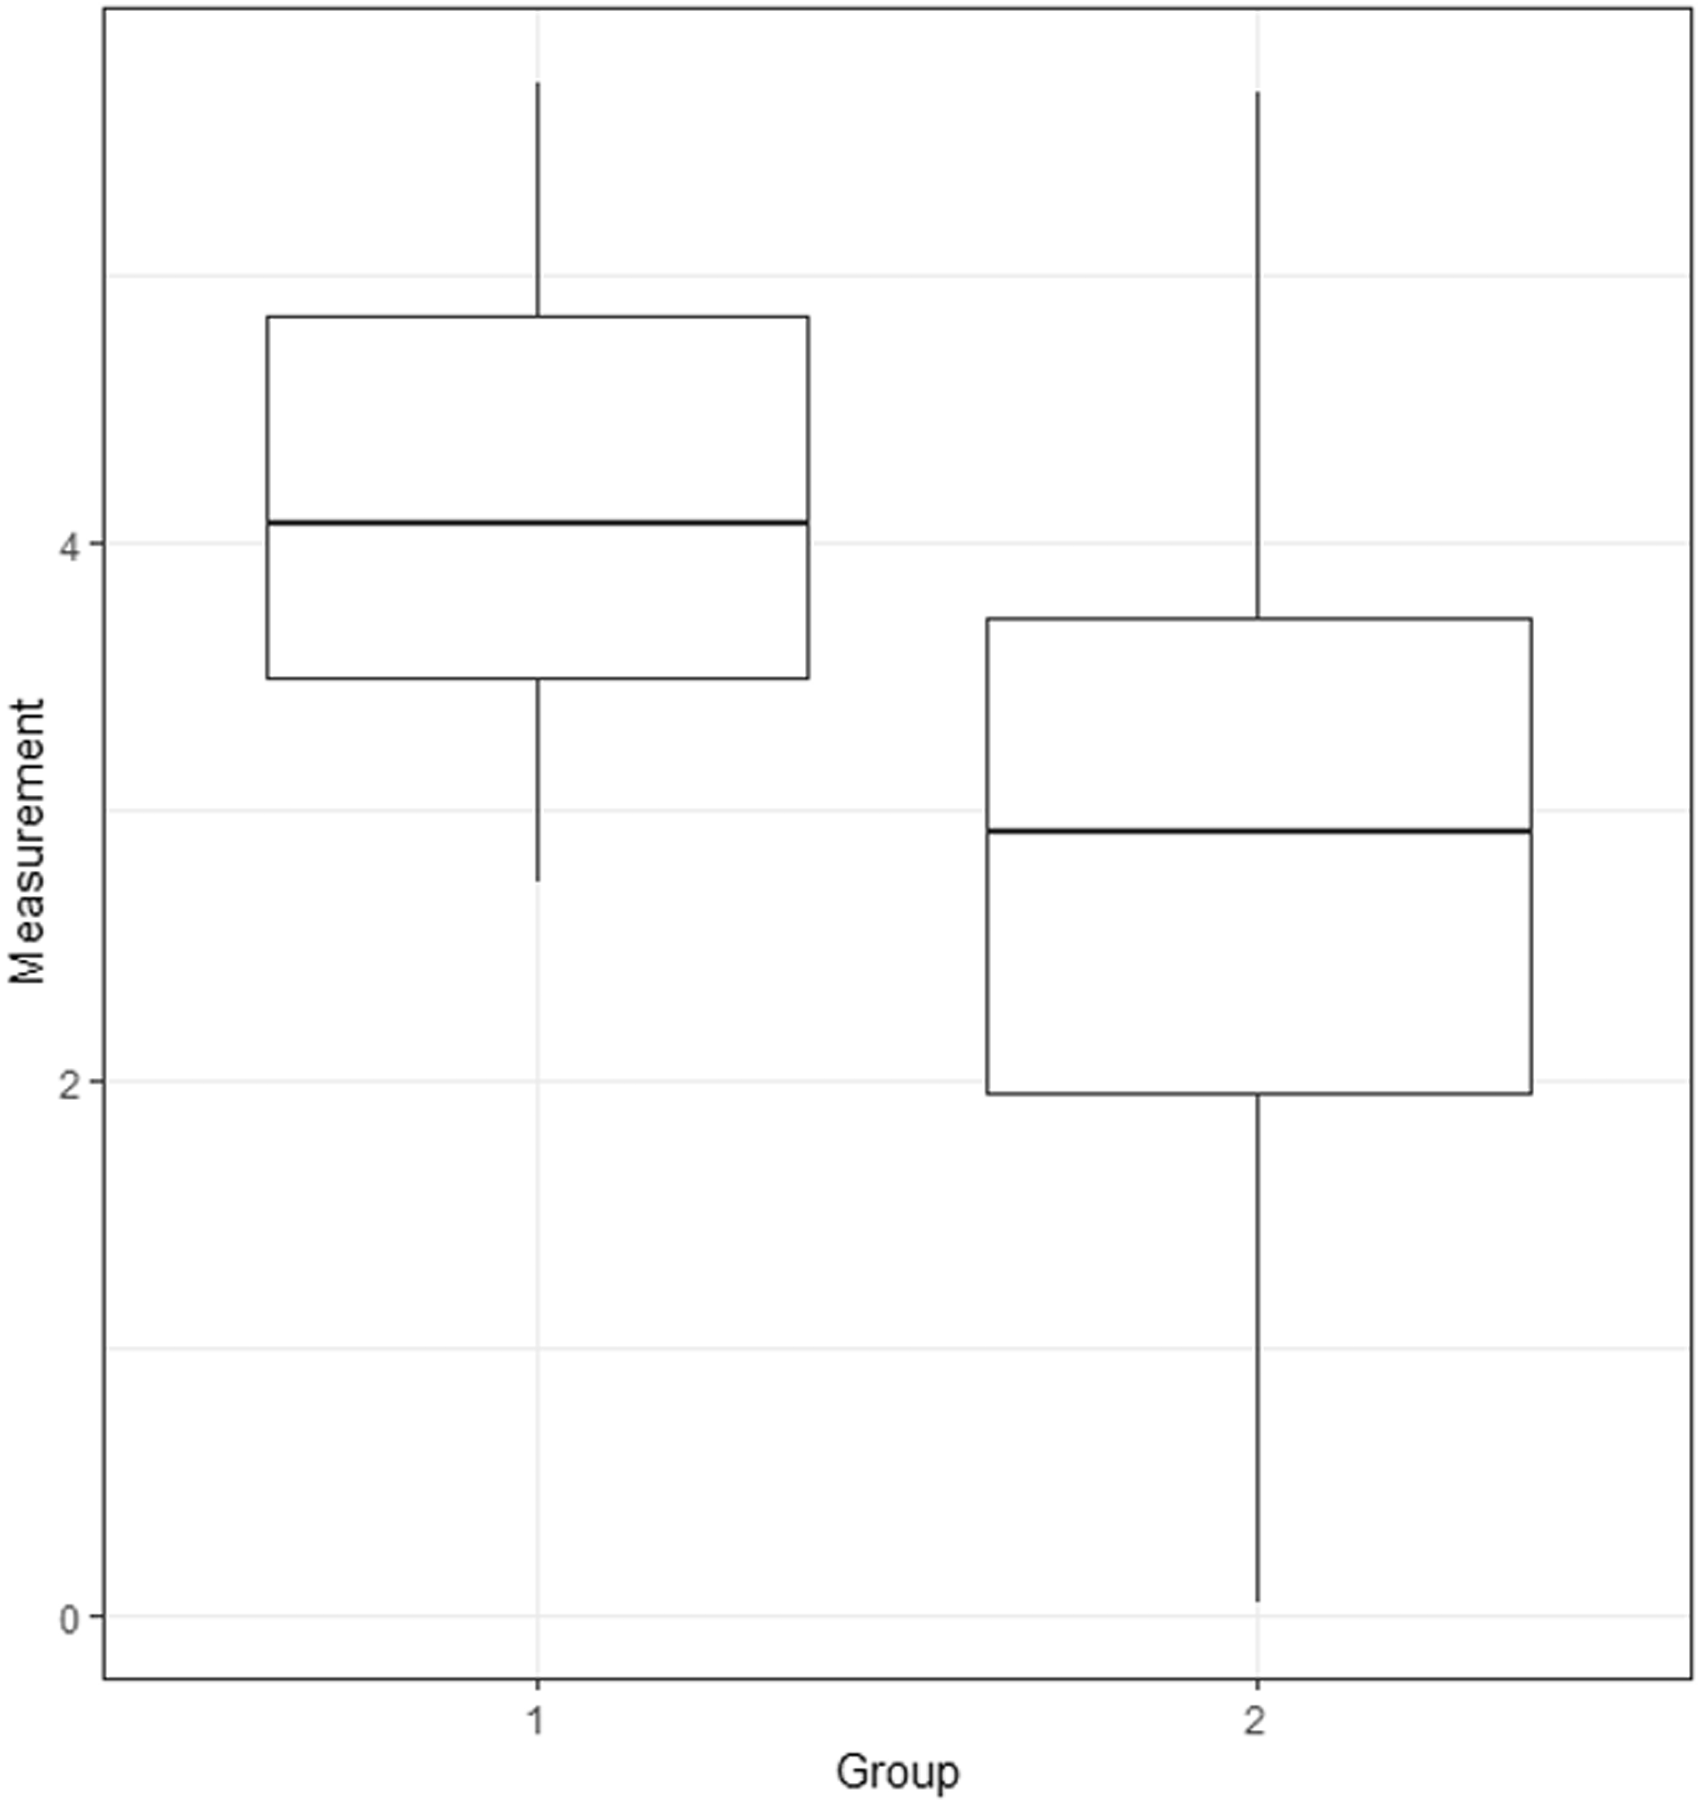
Boxplot for Groups 1 and 2 (see text).
Student's t-test assumes falsely that the standard deviations in each sample are equal, and gives a test statistic t = 2.79, with 31 degrees of freedom, so that P = 0.009. Welch's t-test is valid, and yields t = 3.174 with 27.9 degrees of freedom, so that P = 0.004. Note that for Student's t-test, the degrees of freedom will always be 31 with this sample size, but the calculated degrees of freedom for the Welch t-test will depend upon the sample standard deviations.
The non-parametric test
If there is doubt about the degree of symmetry or lack of normality, then a non-parametric test should be used: the Mann–Whitney U-test, sometimes referred to as the Wilcoxon rank-sum test. This uses ranks rather than the measurements and so is distribution-free. The null hypothesis is that the groups are sampled from the same distribution; the alternative hypothesis is that the groups are sampled from different distributions. It is often assumed that the two distributions are the same apart from a shift. In that case, the null hypothesis is that the medians are equal, and the alternative hypothesis is that the medians are different. In practice, the test is dominated by the shift effect, and so in practical terms, it is a difference in medians that is tested. The user should, however, proceed with caution, should the spread of the two group distributions be large. 4
With the example above, the Mann-Whitney U-test gives P = 0.009. This illustrates the fact that often there is very little difference between test results in terms of statistical significance, and that the Mann–Whitney test is almost as powerful.
Summary
The Welch t-test is preferred to Student’s t-test, whenever the distribution of measurements is close to normal or is symmetric with at least 50 measurements. There is little difference in statistical power. Alternatively, the Mann–Whitney U-test is almost as powerful and has no distributional assumptions. Effectively, the Welch t-test tests for a difference in means and the Mann–Whitney U-test tests for a difference in medians.
Footnotes
Declaration of conflicting interests
The author(s) declared no potential conflicts of interest with respect to the research, authorship, and/or publication of this article.
Funding
The author(s) received no financial support for the research, authorship, and/or publication of this article.
Ethical approval
Not applicable.
Guarantor
RMW.
Contributorship
Sole author.