
Abstract
Background
Calculated globulin fraction is derived from the liver function tests by subtracting albumin from the total protein. Since immunoglobulins comprise the largest component of the serum globulin concentration, increased or decreased calculated globulins and may identify patients with hypogammaglobulinaemia or hypergammaglobulinaemia, respectively.
Methods
A retrospective study of laboratory data over 2.5 years from inpatients at three tertiary hospitals was performed. Patients with paired calculated globulins and immunoglobulin results were identified and clinical details reviewed. The results of serum electrophoresis testing were also assessed where available.
Results
A total of 4035 patients had paired laboratory data available. A calculated globulin ≤20 g/L (<2nd percentile) had a low sensitivity (5.8%) but good positive predictive value (82.5%) for hypogammaglobulinaemia (IgG ≤5.7 g/L), with a positive predictive value of 37.5% for severe hypogammaglobulinaemia (IgG ≤3 g/L). Paraproteins were identified in 123/291 (42.3%) of patients with increased calculated globulins (≥42 g/L) who also had a serum electrophoresis performed. Significantly elevated calculated globulin ≥50 g/L (>4th percentile) were seen in patients with either liver disease (37%), haematological malignancy (36%), autoimmune disease (13%) or infections (9%).
Conclusions
Calculated globulin is an inexpensive and easily available test that assists in the identification of hypogammaglobulinaemia or hypergammaglobulinaemia which may prompt further investigation and reduce diagnostic delays.
Keywords
Introduction
Calculated globulin (CG) is a routinely reported parameter in the liver function test (LFT) which is derived from subtracting the albumin from the plasma total protein. The CG includes all globulin fractions (α1, α2, β and γ-fractions), which include many serum proteins including complement, immunoglobulin and carrier proteins, e.g. haptoglobin and transferrin. Immunoglobulins make up a large proportion of the globulin fraction, and CG has previously been found to have linear association with immunoglobulin G (IgG) concentrations. 1 Reduced or elevated concentrations of CG may therefore reflect hypogammaglobulinaemia or hypergammaglobulinaemia, respectively. The use of CG has been studied as a potential screening tool for identification of antibody deficiency syndromes.1–3 Antibody deficiency syndromes have an estimated diagnostic delay of a median of three to nine years,4–6 leading to significant end-organ damage and effects on quality of life and survival.7,8 Diagnostic delay occurs when there is failure to consider immunodeficiency in patients who have the appropriate presentations, such as patients with recurrent respiratory tract infections, autoimmune disease, granulomatous disease or cytopaenias.9,10 Hence, additional laboratory tools which aid earlier recognition and diagnosis of humoral immunodeficiency associated with hypogammaglobulinaemia may benefit patients by allowing earlier interventions, such as replacement immunoglobulin therapy, and improve outcomes. Conversely, elevated CG may suggest the presence of significant elevations of immunoglobulins. This may be due to polyclonal increases in immunoglobulins (usually related to immune activation associated with infection or autoimmune disease) or monoclonal increases seen in diseases associated with paraprotein production (e.g. multiple myeloma). 11 In a study assessing a clinical decision rule for paraprotein detection, a CG > 41 g/L had the highest predictive value for identifying a paraprotein in comparison to other features including haemoglobin, renal function, calcium concentration and patients age. 12 However, since the globulin fraction includes a large number of other proteins which may be increased (e.g. acute phase proteins in infections) or decreased (e.g. reduced hepatic synthesis of proteins with liver cirrhosis) in disease states, an abnormal CG concentration may not simply reflect abnormal immunoglobulin concentrations, and vice versa, a normal CG may not exclude abnormal immunoglobulin concentrations.
The aim of this study was to assess the correlation between the CG and immunoglobulin concentration in a tertiary hospital in-patient population in Western Australia and to assess its utility in identifying patients with hypogammaglobulinaemia or paraproteinaemia.
Method
Retrospective data were collected from the PathWest laboratory database for in-patient samples collected from three large tertiary hospitals in Western Australia (Fiona Stanley Hospital, Royal Perth Hospital and Sir Charles Gairdner Hospital) between the 1 June 2016 and 31 December 2018. Given the age-dependent variability in normal immunoglobulin concentrations, only patients aged >10 years or over with an IgG reference range of 5.8–13.7 g/L were analysed. Patients below 11 years of age or with incomplete data for the two parameters (LFT or IgG) within this timeframe were excluded. If the same patient had multiple sets of LFT and immunoglobulin concentrations, the chronologically earliest samples was chosen. Testing was performed on either an Architect c8000 or c16000 (Abbott, USA) by biuret method for total protein (TP), by colorimetric bromocresol green method for albumin and by turbidimetry for immunoglobulins (IgG, IgA and IgM). CG results were derived from calculating total protein minus the albumin (locally established reference range of 25–42 g/L). No clinical comment was routinely added to CG results outside the reference range at the time of study. Total immunoglobulin was derived by addition of the IgG, IgA and IgM concentrations. Patients without all immunoglobulin classes (IgG, IgA and IgM) were excluded from total immunoglobulin analysis. Patients with immunoglobulin concentrations below the lower limit of quantitation (IgG 1 g/L; IgA 0.05 g/L; IgM 0.05 g/L) were assigned the lower limit of quantitation value for the purposes of calculations and statistical analysis. Protein electrophoresis was performed on the automated capillary zone electrophoresis (Sebia, France) with immunofixation performed on the Sebia Hydrasys (Sebia, France).
Correlation analysis was performed using Spearman’s correlation coefficient. Receiver operating characteristic (ROC) curve analyses were performed for CG against IgG concentrations and serum electrophoresis to assess discrimination value of CG to detect patients with hypogammaglobulinaemia or paraproteinaemia, respectively. A P-value of <0.05 was considered significant. Statistical analysis was performed using MedCalc v14.8.1 (MedCalc, Belgium). The study was approved by the Fiona Stanley Hospital, Royal Perth Hospital and Sir Charles Gairdner Hospital Princess Margaret Hospital Quality Improvement Committees.
Results
From a total of 10,735 patient samples, after removal of duplicates and samples with incomplete testing, data were available from 4381 patient clinical samples. The median age of patients was 56.3 years (range 11.9–99.2), with 48.3% females (n = 2116) and 51.7% males (n = 2265). The IgG concentration was available for all patients, with IgM concentration available in 96.8% of patients and IgA concentration available in 96.1% of patients. There was a wide spread of CG concentrations seen with a median of 33 g/L, mean of 33.9 g/L with concentrations ranging from 10 to 97 g/L (Figure 1). There was a strong linear relationship between total immunoglobulin concentrations (sum of IgG, IgA and IgM) and CG (Figure 2) (r = 0.897, P < 0.0001) with a good correlation between CG and IgG (r = 0.788, P < 0.0001), a moderate correlation between CG and IgA (r = 0.476, P < 0.0001) and poor correlation between CG and IgM (r = 0.295, P < 0.0001) (Figure 2). Despite the good correlation between the CG and IgG concentrations, there was still a wide variation in IgG concentrations at each CG concentration with a CG of 20 g/L having a mean IgG of 4.7 g/L (range 1.3–8.9); CG of 30 g/L having a mean IgG of 9.6 g/L (range 2.1–14.4); CG of 40 g/L having a mean IgG of 15.4 g/L (range 6.2–23.4) and a CG of 50 g/L having a mean IgG of 22.5 g/L (range 4.5–32.5).
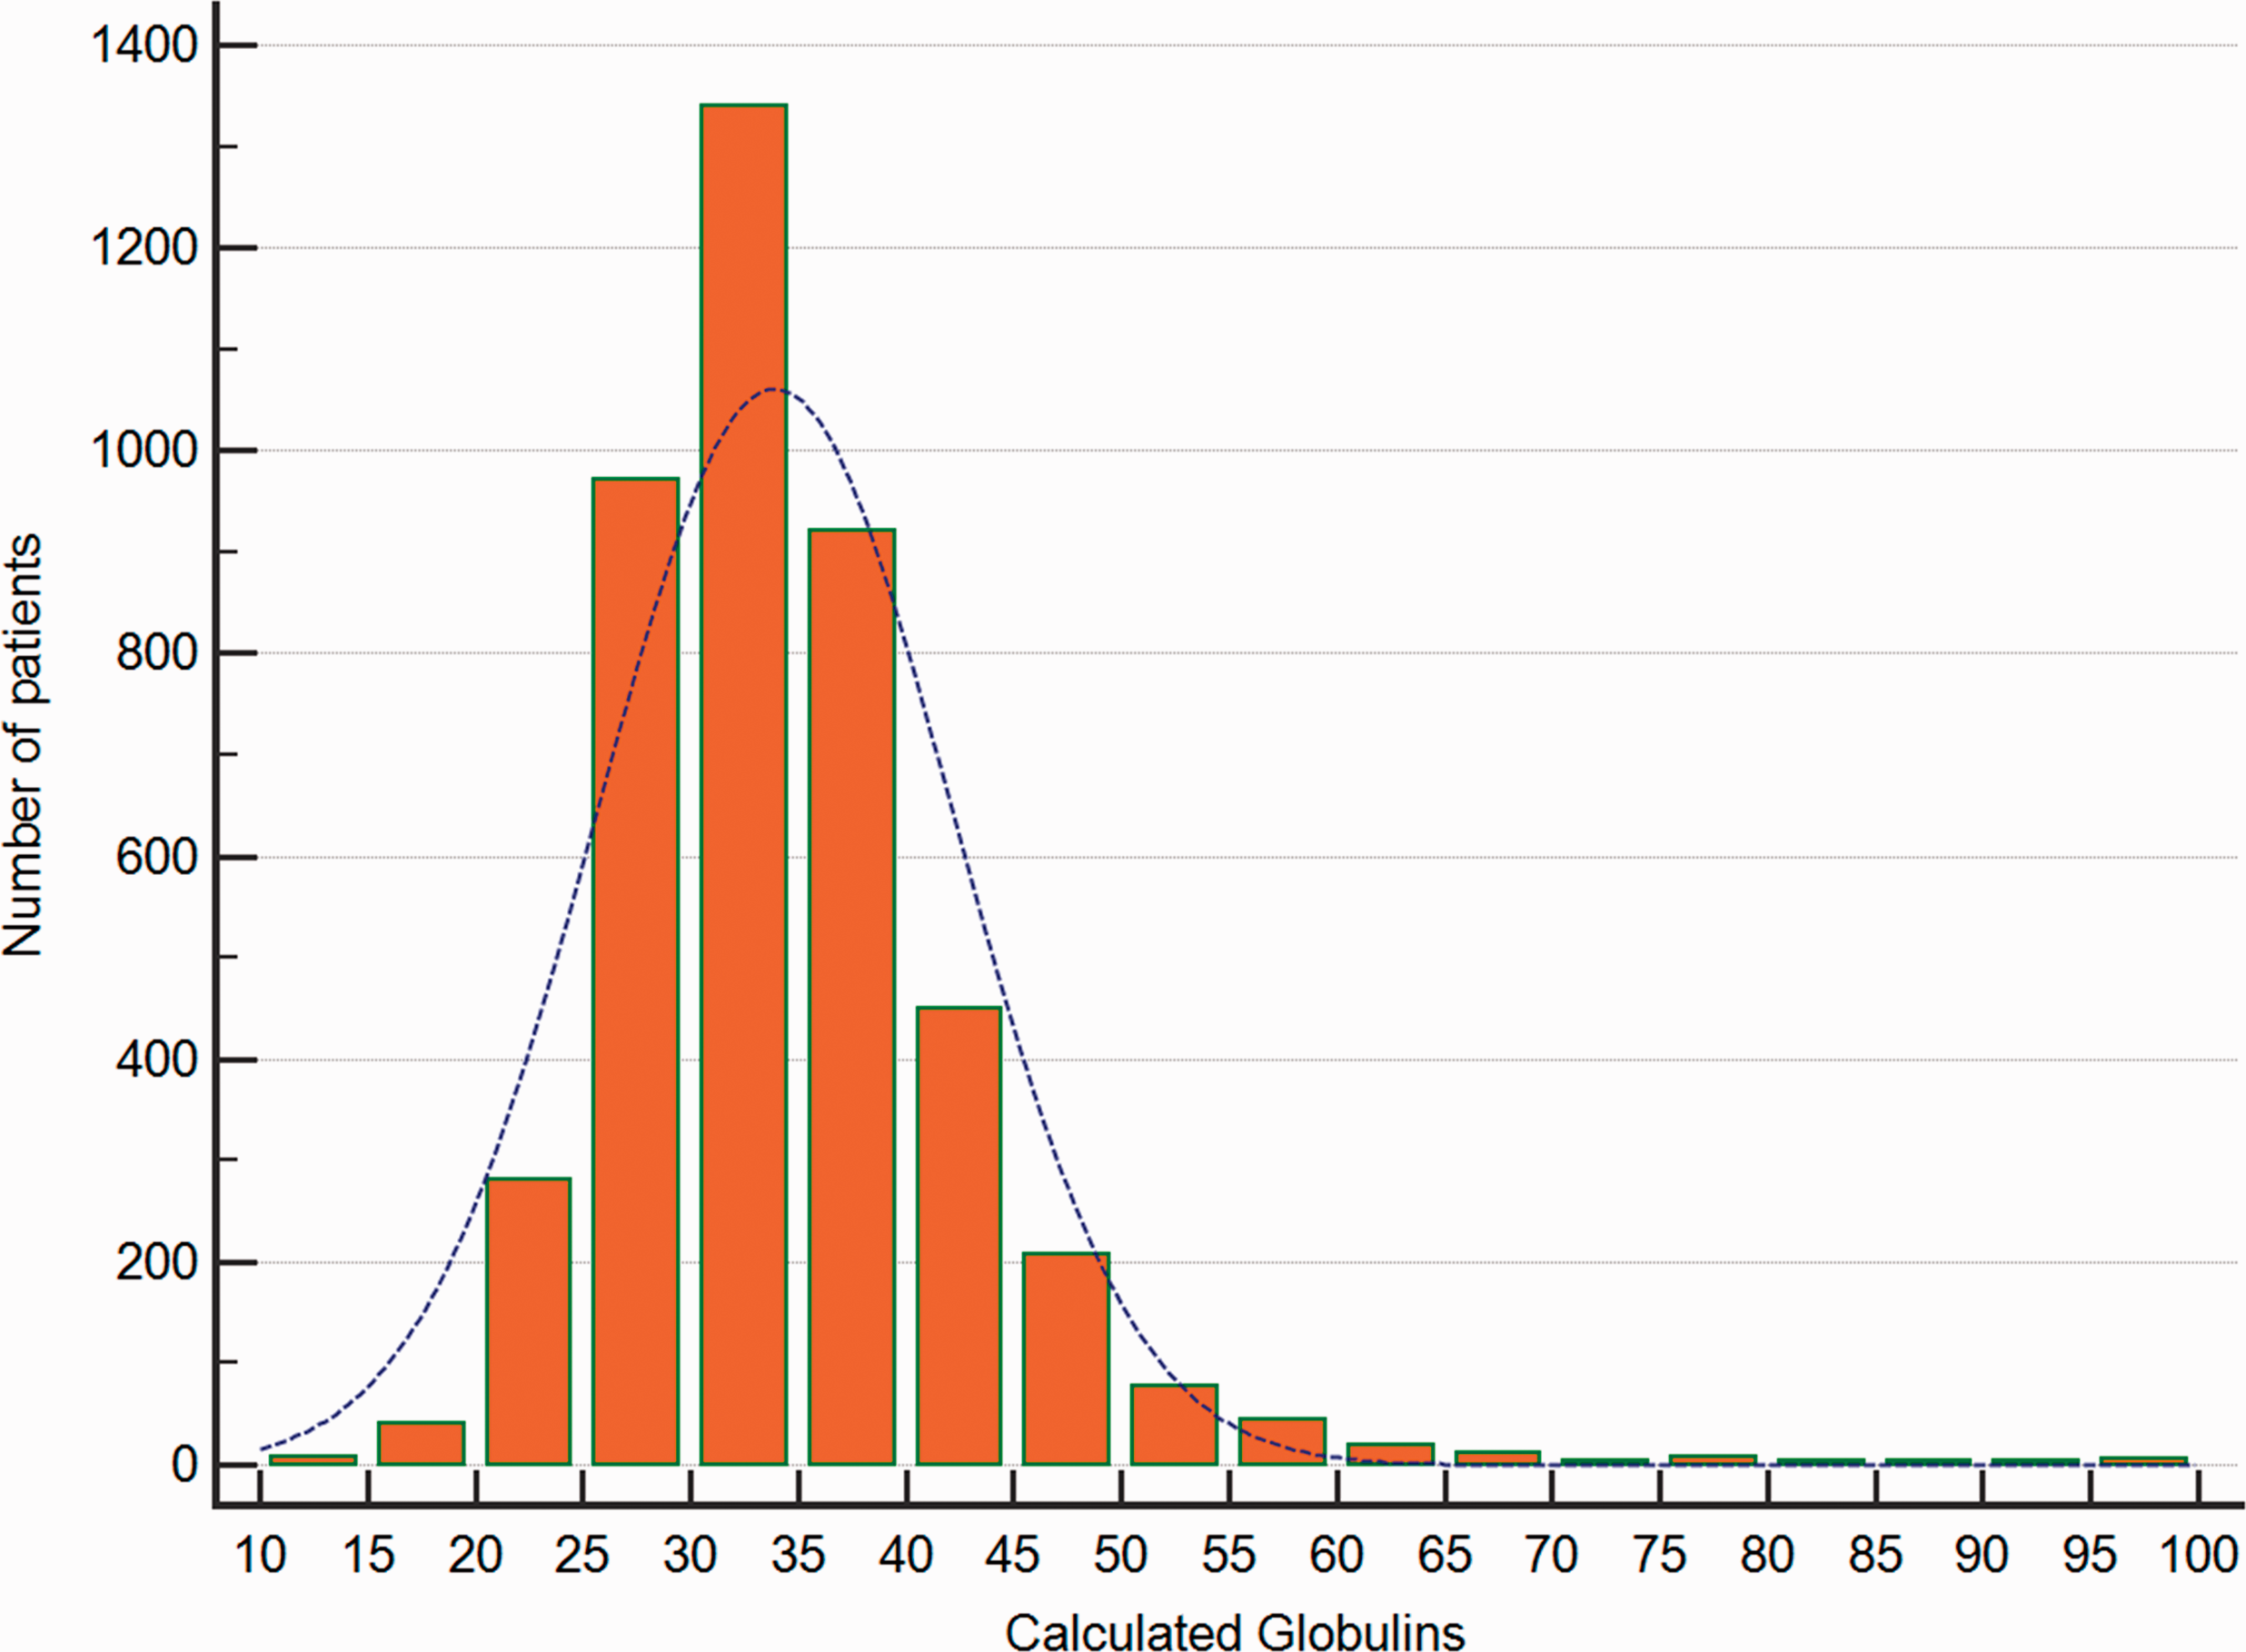
Distribution of patients according to the calculated globulin (CG) concentration.
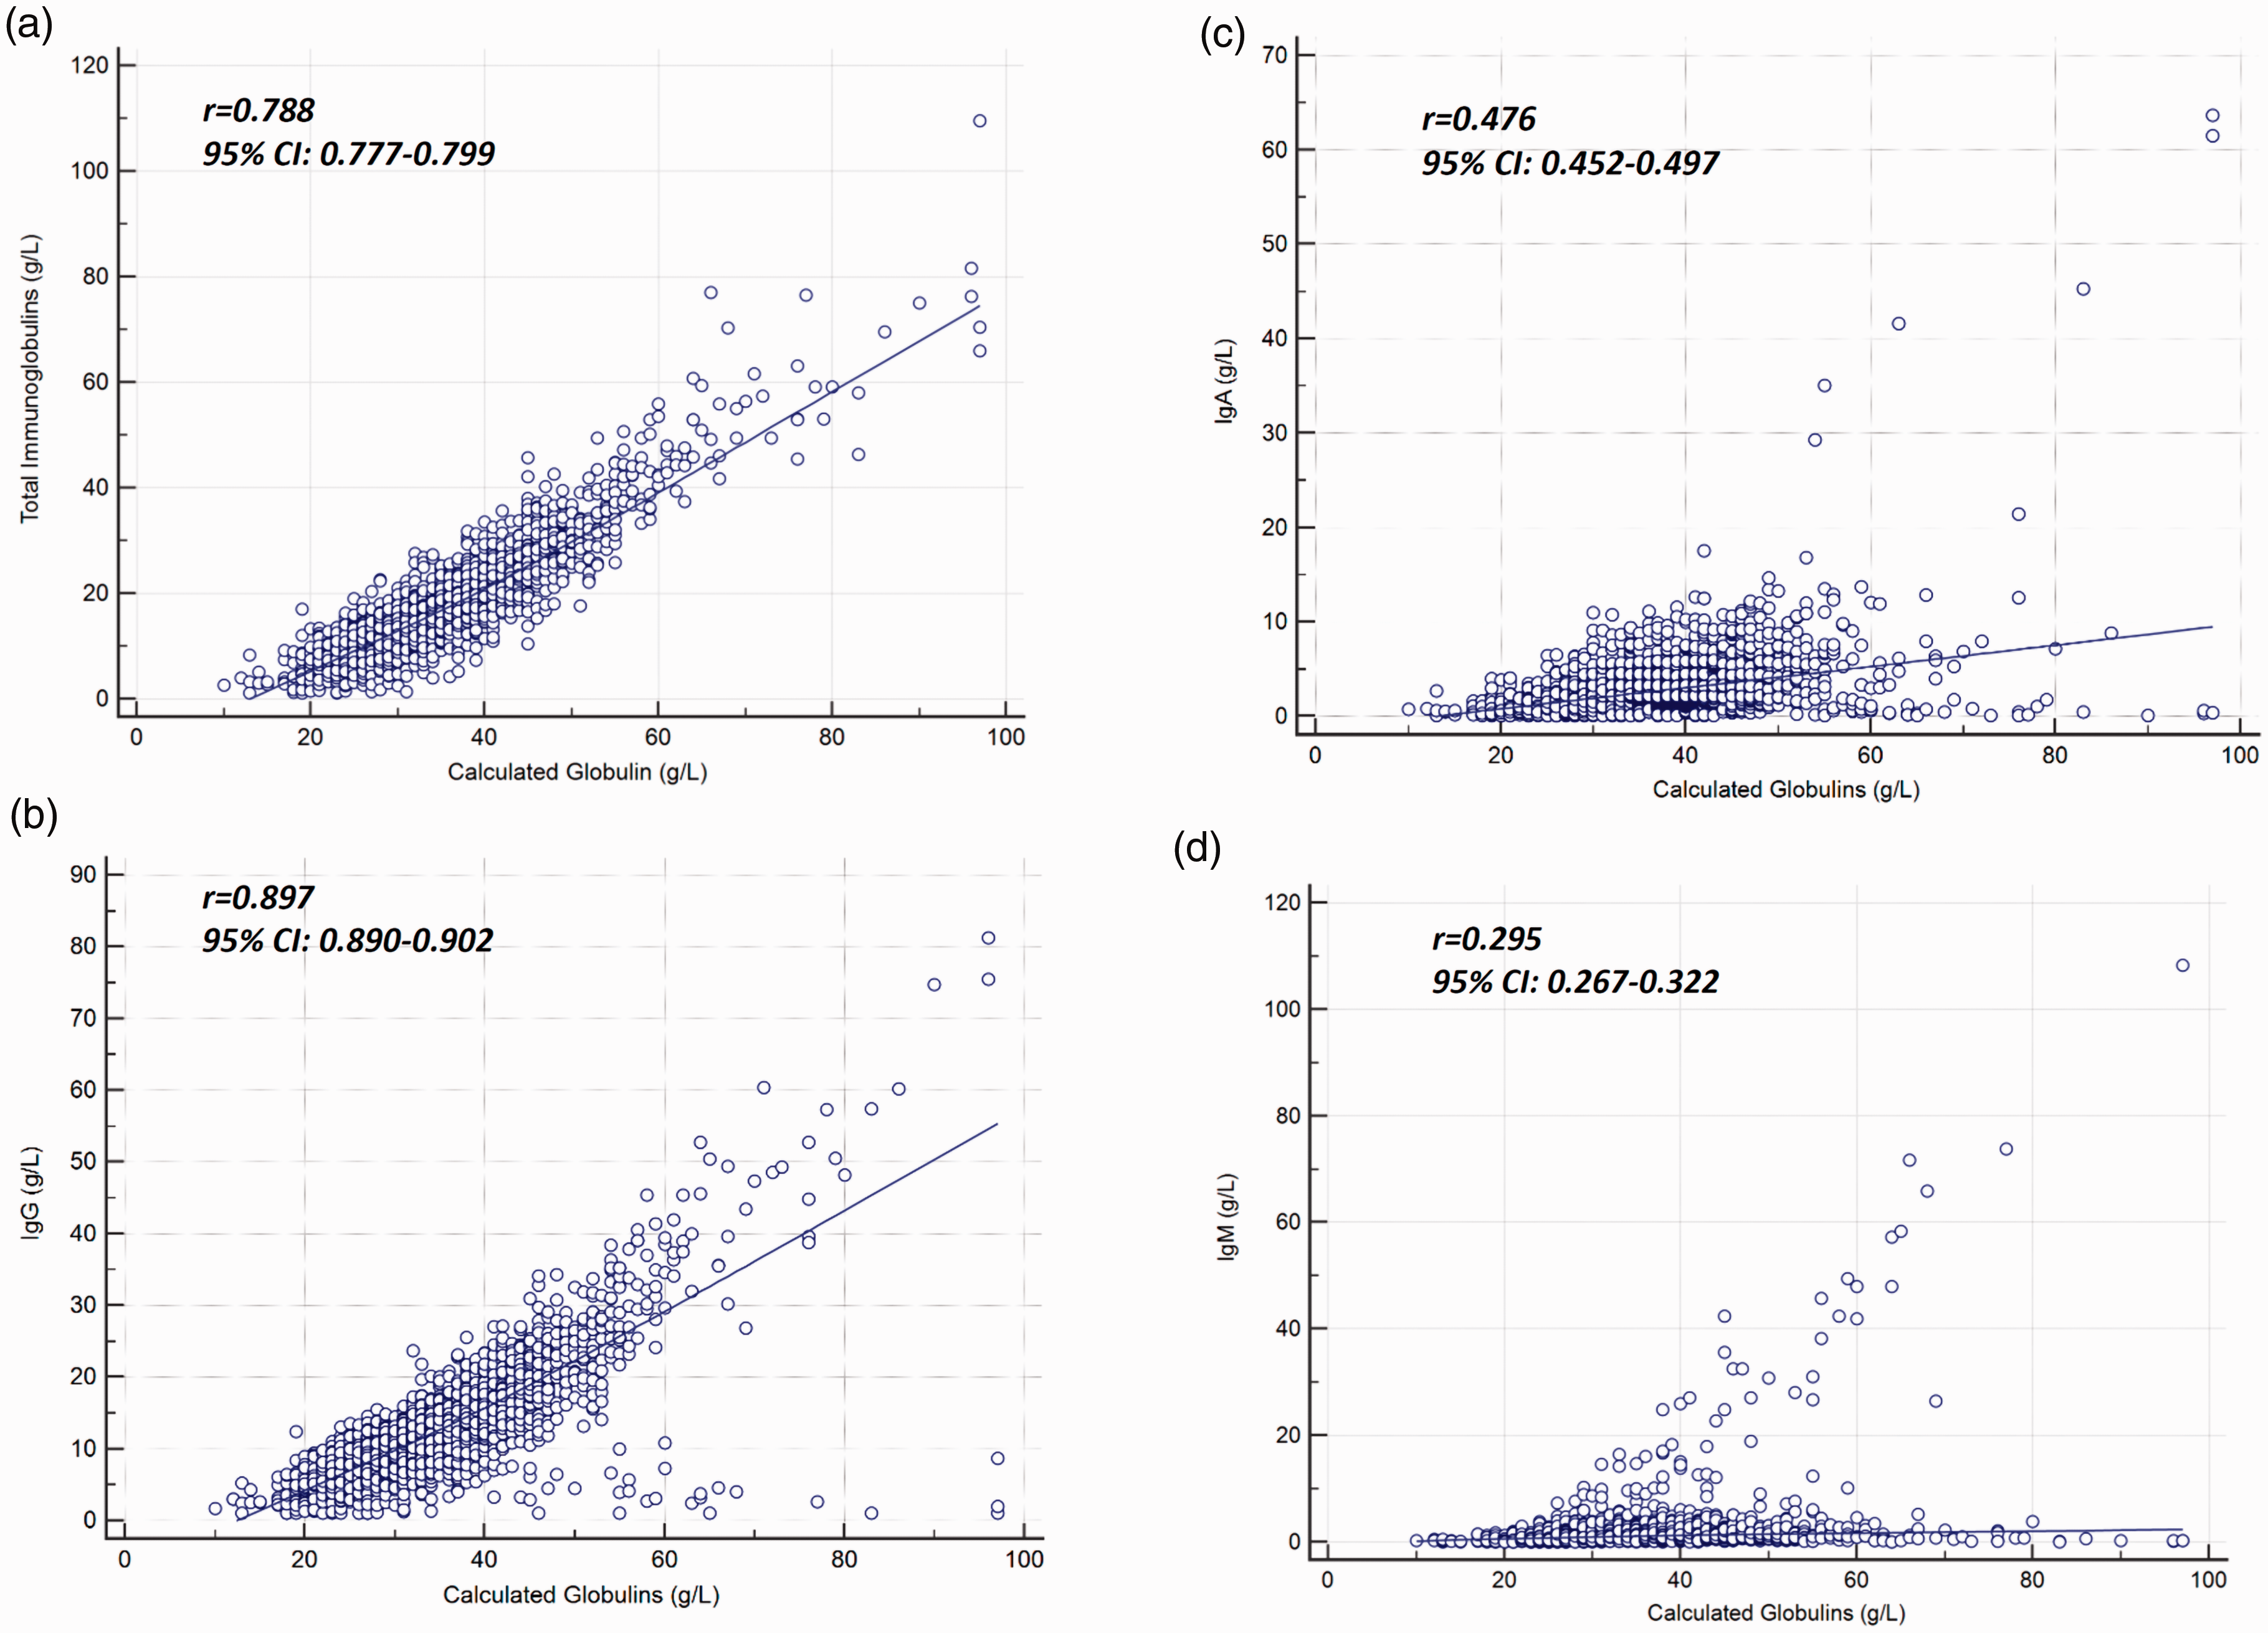
Correlation analyses between calculated globulin (CG) and total immunoglobulin (a), IgG (b), IgA (c) and IgM (d). Strength of the association between the immunoglobulin concentration and CG is shown next to the corresponding graph.
As expected, the highest frequency of hypogammaglobulinaemia was seen in patients with low CG concentrations, with rates of hypogammaglobulinaemia also increased in patients with elevated CG compared with normal CG concentrations (Figure 3). All 22 patients with hypogammaglobulianemia (IgG ≤5.7 g/L) but elevated CG concentrations (>42 g/L) had a clonal B-cell disorder associated with IgM (81%) or IgA (19%) paraproteins (13 Waldenstroms macroglobulinaemia; 4 multiple myeloma; 1 plasmacytosis of uncertain significance, 1 lymphoplasmacytic lymphoma; 1 chronic lymphocytic leukaemia). To assess the discriminative capacity of low CG for hypogammaglobulinaemia, ROC curve analyses were performed on low CG concentrations to segregate patients with hypogammaglobulinaemia at IgG concentrations of ≤3 g/L, ≤4 g/L, ≤5 g/L and ≤5.7 g/L (5.8 g/L is the lower limit of normal for the assay). This showed that CG concentration had independent discriminative capability at all four cut-off concentrations. Area under the ROC curve (AUC) values were 0.812 to detect IgG ≤3 g/L (P < 0.0001), 0.816 to detect IgG ≤4 g/L (P < 0.0001), 0.833 to detect IgG ≤5 g/L (P < 0.0001) and 0.851 to detect IgG ≤5.7 g/L (P < 0.0001) (Supplemental File 1). The sensitivity, specificity, positive and negative predictive values of a range of low CG concentrations (≤25 g/L) against each of the IgG concentration cut-offs are shown in Table 1. A low CG showed a low sensitivity but high specificity for identifying hypogammaglobulinaemia. The sensitivity decreased with age with an IgG ≤18 g/L having a sensitivity for hypogammaglobulinaemia (IgG ≤5.7 g/L) of 37%, 18%, 16% and 11% for patients aged 11–30 years, 31 to 50 years, 51 to 70 years and >71 years, respectively, although there was no significant change in specificity (all > 99.6%). At the lowest value of CG of ≤18 g/L, the positive predictive value was 61.5%, 73.1%, 80.8% and 88.5% for identifying hypogammaglobulinaemia at ≤3 g/L, ≤4 g/L, ≤5 g/L and ≤5.7 g/L, respectively.
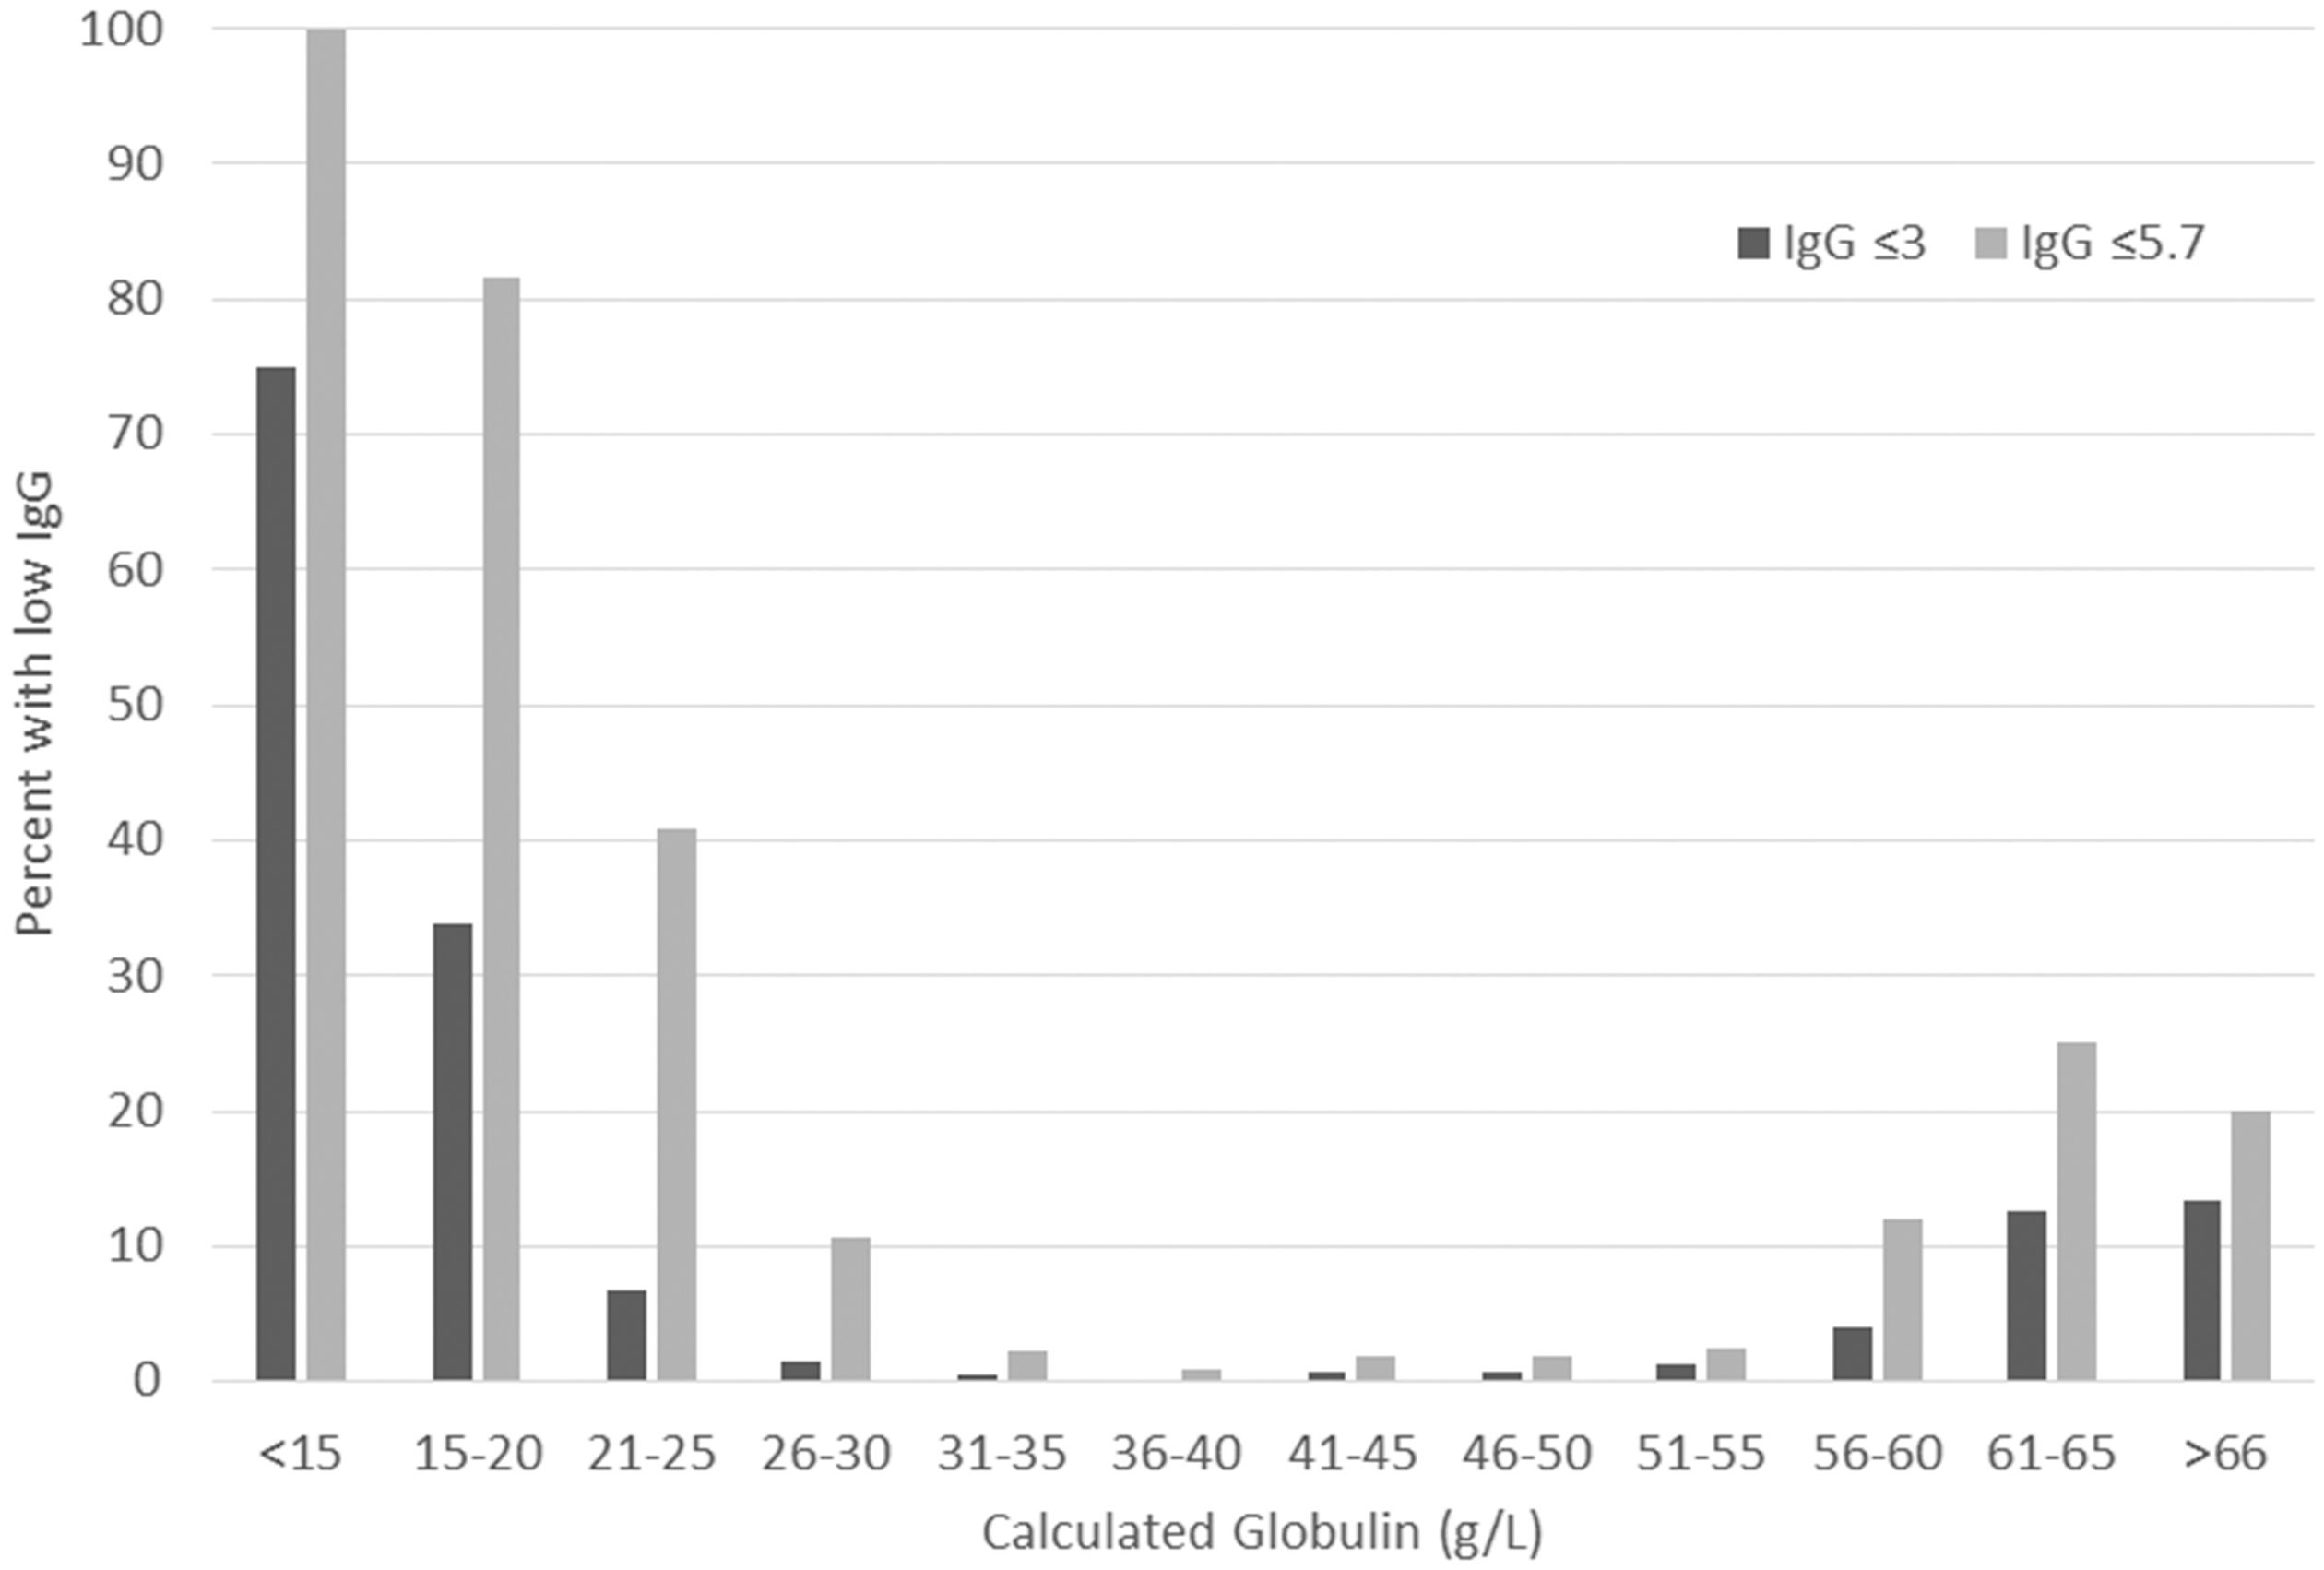
Frequency of hypogammaglobulinaemia at IgG ≤5.7 g/L and IgG ≤ 3 g/L according to calculated globulin interval.
Sensitivity, specificity, positive predictive value (PPV) and negative predictive value (NPV) of each calculated globulin (CG) concentration between 18 and 25 g/L to detect IgG concentrations at ≤3 g/L, ≤4 g/L, ≤5 g/L and ≤5.7 g/L.
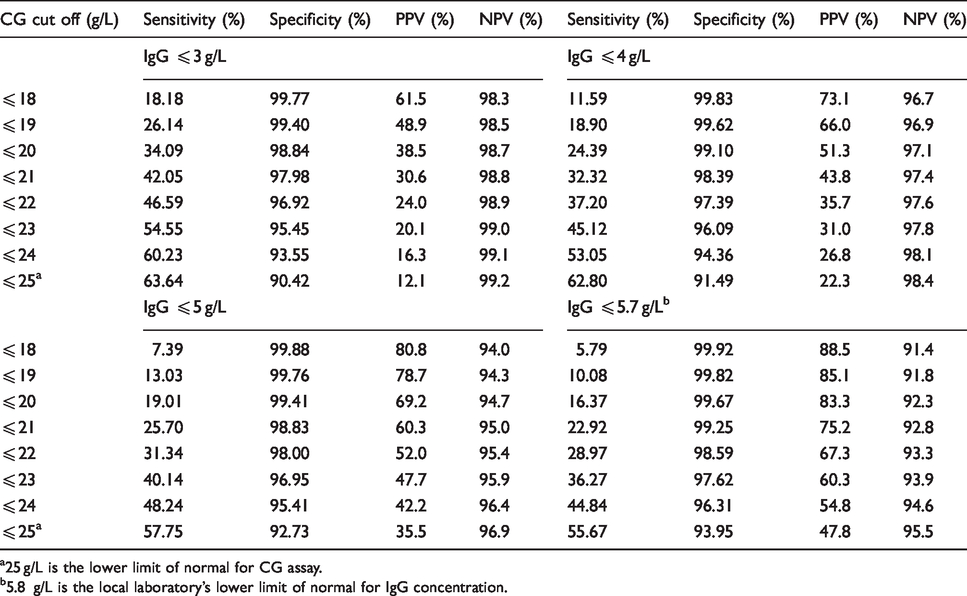
a25 g/L is the lower limit of normal for CG assay.
b5.8 g/L is the local laboratory’s lower limit of normal for IgG concentration.
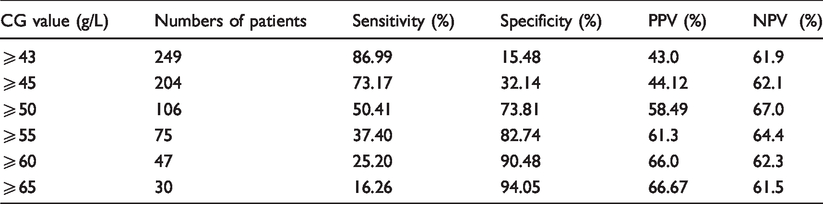
Next, we assessed the potential of high CG concentrations, i.e. concentrations above the upper range of normal to detect paraproteinaemia. Of 597 patients with a CG at or above the upper limit of normal (≥42 g/L), a serum electrophoresis was available in 291 (48.6%). Paraproteinaemia was identified in 123 (42.3%), of these patients with 75 patients having an IgG paraprotein, 30 IgM paraprotein, 11 IgA paraprotein, 5 free lambda light chains and 2 patients with a biclonal gammopathy. Based on the 291 patients who underwent electrophoresis testing, an elevated CG (≥43g/L) had a good sensitivity of 86.9% but low specificity of 15.5% for detection of paraproteinaemia. The specificity increased with increasing CG concentration with a corresponding drop in the sensitivity (Table 2). We examined the clinical conditions of 174 patients with a CG ≥50 g/L representing 4% of the cohort. The underlying clinical conditions fell into five main categories of liver disease (n = 64), haematological malignancy (n = 63), autoimmune disease (n = 22), infection (n = 16) and high-dose immunoglobulin therapy (n = 4) (Table 3).
Sensitivity, specificity, positive predictive value (PPV) and negative predictive value (NPV) of calculated globulins CG to detect the presence of paraproteinaemia in 291 patients with CG ⩾ the upper limit of normal (⩾ 42g/L) who had concurrent serum electrophoresis performed.
Underlying medical conditions in 174 patients with a calculated globulin ≥50 g/L.
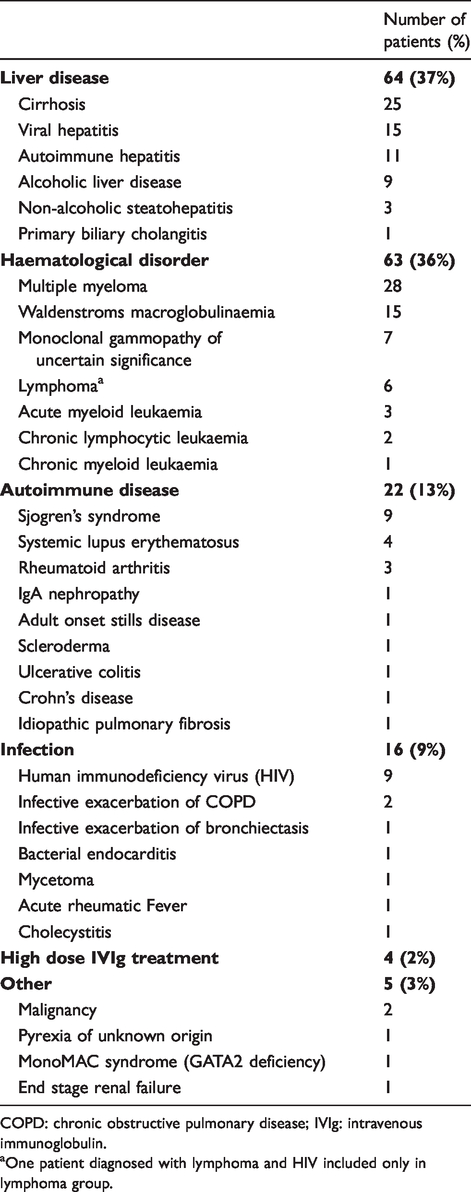
COPD: chronic obstructive pulmonary disease; IVIg: intravenous immunoglobulin.
aOne patient diagnosed with lymphoma and HIV included only in lymphoma group.
Discussion
The CG is a derived figure of the difference between the total protein and albumin on liver function test profiles. As no additional analysis is required, this result is cost free and routinely available. Previous studies have suggested that reduced or elevated CG concentrations may be of utility in screening for both hypogammaglobulinaemia and paraproteinaemia, respectively.1–3,12–14 In this study, we sought to assess the utility of the CG in samples from in-patients at tertiary West Australian Hospitals. A strong correlation was demonstrated between CG and total Ig concentration, which affirms the utility of CG concentration as a potential tool to detect abnormal immunoglobulin concentrations, especially since CG values are so easily derived from liver function tests.
In keeping with IgG representing the largest proportion within the immunoglobulin fraction, the CG had the strongest correlation with IgG compared with IgA and IgM in keeping with previous studies.2,3 At a CG of ≤18 g/L, the sensitivity for detection of hypogammaglobulinaemia (≤5.7 g/L) was poor at 5.79% with a high specificity at 99.92% and positive predictive value at 88.5%. The sensitivity of CG of ≤18 g/L for detection of hypogammaglobulinaemia increased with lower IgG concentrations with a sensitivity of 18.18% and specificity of 99.77% for detecting IgG ≤3 g/L. The sensitivities seen in our study are significantly lower than previous studies. One UK study showed that a cut-off of 18 g/L had a sensitivity of 66% and a specificity of 78% for detecting IgG concentrations of <5 g/L. 1 A further Italian study utilizing a cut-off of 19 g/L detected IgG concentrations of <6 g/L with a sensitivity of 70% and a specificity of 78%. 3 There may be a few reasons for the differences between this and these previous studies. Firstly, the patients identified in our study were all tertiary hospital in-patients and out-patients and primary care patients were excluded. This population typically consists of higher acuity patients likely to have higher rates of illnesses affecting hepatic production of albumin, immunoglobulin concentrations and inflammatory acute phase proteins. It is likely there will be a higher sensitivity for detection of hypogammaglobulinaemia or paraproteins in primary care patients with lower rates of severe illnesses and potentially younger age, although a comparative prospective study between primary and secondary care patients would be needed to confirm this. Secondly, the previous studies only assessed the diagnostic performance of CG in patients with low CGs selecting 50 patients 1 or 25 patients 3 for each CG value between 15 g/L and 22 g/L only. Patients with these values were only found in 3.7% (n = 163) of our patients, with CG of 15 g/L (n = 2), 16 g/L (n = 0), 17 g/L (n = 6), 18 g/L (n = 10), 19 g/L (n = 21), 20 g/L (n = 31), 21 g/L (n = 43), 22 g/L (n = 50) all representing a very small proportion of our cohort (Figure 1). Given hypogammaglobulinemia is more frequent in patients with very low CG concentrations, examining only patients with low CG will significantly increase the prevalence of significant hypogammaglobulinaemia in their cohorts affecting diagnostic performance. Indeed, when we restricted our analysis to only assessing patients with CG ≤22 g/L, the sensitivity of a CG ≤18 g/L cut-off for detecting hypogammaglobulinaemia ≤5.7 g/L increased from 5.79% to 13.76% with a decrease in specificity from 99.2% to 94.5%.
Based on the data using our laboratory methods, we would suggest a cut-off of CG as ≤20 g/L which would identify a group of patients with an 82.5% chance of having hypogammaglobulinaemia (IgG ≤5.7 g/L) and a 37.5% chance of having severe hypogammaglobulinaemia (IgG ≤3 g/L). Diagnostic delay in antibody deficiency is common, with delays of between 4 and 9 years after the onset of symptoms being reported for the most prevalent antibody deficiency common variable immunodeficiency (CVID).4,6,15 Since diagnostic delay is associated with increased infectious burden and disease complications, the addition of laboratory comments to highlight to the clinician that these low CGs may be associated with low immunoglobulin concentrations may potentially aid in earlier diagnosis of antibody deficiency. Screening based on CG has also enabled detection of hitherto unrecognized associations, such as frequent hypogammaglobulinaemia seen in patients on Clozapine therapy. 16
In addition to identifying patients with antibody deficiency, elevated CGs may also assist in the diagnosis of paraproteinaemia. A study looking at a clinical decision rules for appropriate ordering of serum electrophoresis identified CG as the factor most predictive of having a paraprotein with CG > 41 g/L having a five-fold higher risk compared with lower CG concentrations. 12 A UK study which looked at a cut-off of >45 g/L but utilizing clinical modifiers to exclude patients with known haematological disease, liver disease, infection or inflammation showed of the 8339 patients with a CG >45 g/L, 1332 had discretionary serum electrophoresis tests which resulted in identification of 72 paraproteins (5%). 13 Other studies have similarly shown electrophoresis on samples with elevated CG increases the detection rate of paraproteins,14,17 although due to variability in applied cut-off concentrations and clinical modifiers, the clinical utility of such testing remains unclear. While high concentrations of CG were frequently associated with paraproteinaemias, high concentrations were not specific and are also seen in several inflammatory conditions associated with polyclonal hypergammaglobulinaemia including liver disease, autoimmunity and infection. CG concentrations could still be strikingly raised in polyclonal hypergammaglobulinaemia with CG concentrations of up to 86 g/L seen. Clinicians should be aware that significantly elevated CG may be seen both with monoclonal paraproteins and in conditions associated with polyclonal hypergammaglobulinaemia. Exclusion of a paraprotein by electrophoresis should trigger evaluation for conditions associated with polyclonal hypergammaglobulinaemia with testing based on the clinical picture and other laboratory and pathology markers.
While this study is strengthened by the large number of patients across a wide range of conditions, there are limitations inherent to such retrospective studies. The clinical indications behind testing are not clear. This will lead to potential bias, as physicians may have ordered immunoglobulin and serum electrophoresis tests based on a clinical suspicion of immunodeficiency or a paraproteinaemia. There may also be a possible referral bias of higher complexity patients due to this study being limited to only patients seen at tertiary hospital sites. Further follow-up of abnormal results was not undertaken as part of this study, and it is therefore not possible to assess whether these changes were a transient phenomenon, or if the patients were subsequent confirmed to have an antibody deficiency or haematological disorder. Lastly, this study excluded very young paediatric patients given the variability in the reference ranges for IgG concentrations with age until reaching adult levels in second decade. While we included older paediatric patients with a shared reference range with the adult population this represented only a small proportion of the cohort.
CG is a test which is usually available at no cost as part of the liver function tests. Clinicians need to understand its potential utility in assisting in diagnosis of hypogammaglobulinaemia or paraproteinaemia which may help reduce diagnostic delay and allow appropriate targeted investigations and therapies for patients.
Supplemental Material
sj-pdf-1-acb-10.1177_0004563221989737 - Supplemental material for Calculated globulin as a screening tool for hypogammaglobulinaemia or paraproteins in hospitalized patients
Supplemental material, sj-pdf-1-acb-10.1177_0004563221989737 for Calculated globulin as a screening tool for hypogammaglobulinaemia or paraproteins in hospitalized patients by Teng Hoo, Ee Mun Lim, Mina John, Lloyd D’Orsogna and Andrew McLean-Tooke in Annals of Clinical Biochemistry
Footnotes
Declaration of conflicting interests
The author(s) declared no potential conflicts of interest with respect to the research, authorship, and/or publication of this article.
Funding
The author(s) received no financial support for the research, authorship, and/or publication of this article.
Ethical approval
This study was reviewed by Quality Improvement Committees at Fiona Stanley Hospital, Royal Perth Hospital and Sir Charles Gairdner Hospital and received a waiver of review from Human Research and Ethics Committee for each site.
Guarantor
AMT.
Contributorship
AMT conceived the study. TH was involved in data collection, notes review and statistical analysis. AMT, LD and MJ were involved in gaining ethical approval. AMT and TH wrote the first draft of the article. All authors reviewed and edited the article and approved the final version of the article.
Supplemental material
Supplemental material for this article is available online.
References
Supplementary Material
Please find the following supplemental material available below.
For Open Access articles published under a Creative Commons License, all supplemental material carries the same license as the article it is associated with.
For non-Open Access articles published, all supplemental material carries a non-exclusive license, and permission requests for re-use of supplemental material or any part of supplemental material shall be sent directly to the copyright owner as specified in the copyright notice associated with the article.