
Abstract
Background
Hormone therapy in transgender individuals may impact processes that lead to changes in biochemical analytes, and therefore reference intervals. Currently, few reference interval studies are available for the transgender population. We determined biochemical reference intervals for transgender individuals receiving hormone therapy.
Methods
Our retrospective, laboratory-based, observational study included healthy transgender males (N = 24) and transgender females (N = 84) on hormone therapy. Various biochemical reference intervals were established for each cohort and compared to their cisgender counterparts.
Results
We detected significant differences in reference intervals for sodium, 139–142 mmol/L vs. 136–145 mmol/L when comparing transgender males (TM) with cisgender males (CM). The following significant changes in upper reference limits (URL) for TM versus CM were detected, ALP (URL: 96 U/L vs. 128 U/L), GGT (URL: 27 U/L vs. 67 U/L) and testosterone (URL: 46.7 nmol/L vs. 29.0 nmol/L), respectively. Moreover, when comparing transgender female (TF) to cisgender female (CF), significant differences in creatinine (URL: 117 μmol/L vs. 90 μmol/L), albumin (lower reference limit: 41 g/L, vs. 35 g/L), AST (URL: 50 U/L vs. 35 U/L), ALP (URL: 118 U/L vs. 98 U/L) and oestradiol (URL: 934 pmol/L vs. 213 pmol/L) were noted, respectively. Significantly higher LDL-C was observed for TM on hormone treatment, compared to baseline (2.9 mmol/L vs. 2.2 mmol/L, p <0.01).
Conclusions
Biochemical results for TM and TF receiving hormone therapy can be evaluated against our transgender-specific reference intervals for some analytes, while others can be compared to their identified gender reference intervals.
Introduction
Transgender is an all-embracing term, which includes all individuals whose gender identity or gender expression is not aligned with the sex recorded at birth or those whose gender identity falls outside the binary male or female classification. Gender identity refers to a person’s internal sense of being male or female, neither male nor female or a combination of both.1,2 Table defining terminology and definitions is in supplementary material.1–3
The transgender community, estimated to be 25 million worldwide, remains one of the most underserved, underrepresented, stigmatised and discriminated groups in society. 4 Inadequate support structures and programmes, skewed societal beliefs regarding the transgender community and matching paucity of knowledge, all contribute to their continued struggle for basic health-care. 5 Hormone therapy and other gender-affirming interventions play a crucial role in the psychosocial wellbeing of transgender individuals, by facilitating an improved alignment with their gender identity. 6 In keeping with their marginalised status, some studies have addressed aspects of poor health-care for transgender subjects, whereas South African studies have highlighted the need for improving health-care for this group, particularly concerning awareness of appropriate hormone therapy. 7 Moreover, prejudices were exposed for this group and a correlation of quality of health-care and urbanisation exists, favouring relative urbanisation of persons wishing to undergo gender reassignment.7–9
Reference intervals play a crucial role in clinical decision-making, as most test results are interpreted in relation to these intervals.10,11 As current commonly utilised reference intervals only accommodate the cisgender population, with little or no consideration given to possible differences in transgender individuals receiving hormone therapy, this represents an important area of investigation.12–14 To date, various studies have investigated biochemical and hormonal changes that occur in transgender individuals receiving hormone therapy,15–21 with only few establishing specific reference intervals for transgender males and transgender females.13,22,23 A previous study was undertaken to specifically determine appropriate reference intervals among transgender subjects, but this was limited to haematological parameters and these did not differ from their cisgender reference intervals, apart from the red cell distribution width where the lower limit was noted to be higher in both transgender males and transgender females, compared with their cisgender counterparts. 13
Other studies have identified that hormone therapy could impact various biochemical processes, leading to potential changes in analytes, including creatinine, alanine transaminase (ALT), aspartate transaminase (AST), cholesterol, triglycerides, low-density lipoprotein cholesterol (LDL-C) and high-density lipoprotein cholesterol (HDL-C); however, appropriate reference intervals were not determined.2,12,14 Furthermore accurate reference intervals, based on gender, age and biological variation, are crucial and should be tailored to specific population groups, including the transgender community to improve clinical decision-making.
We hypothesise that biochemical changes associated with hormone therapy will necessitate specific reference intervals for transgender individuals. This study aimed to assess the biochemical changes associated with hormone therapy and to establish biochemical reference intervals for transgender males (TM) and transgender females (TF) based on changes observed during the transition period.
Methods
Study population and results collection
A retrospective, observational, laboratory-based study, of all TM and TF who attended the Groote Schuur Hospital (GSH), Cape Town Transgender Clinic from March 2014 to March 2020, were included. Study participants were at least 18 years of age, self-identified as transgender and had been prescribed gender-affirming hormone therapy. Participants excluded from the study were transgender participants who were neither receiving nor desiring hormone therapy.
Demographic information and history of gender transition was extracted from an existing database of transgender subjects. Pharmacotherapy, in particular hormone therapy, was obtained from the dispensing database and laboratory data were extracted by data extraction for the TrakCare® Lab Enterprise. Baseline biochemistry analytes of interest, prior to initiation of hormone therapy, were compared to those evaluated after initiation of hormone therapy.
Stellenbosch University and the University of Cape Town Health Research and Ethics Committees approved this study with reference numbers S20/01/014 and 118/2020, respectively. Given the retrospective nature of the study, a waiver of informed consent was approved by both committees.
Sample analysis
Pre-analytical patient factors, including fasting status, alcohol intake and smoking along with time of phlebotomy and phlebotomy technician, could not be accounted for in this retrospective analysis. Biochemistry analytes of interest were analysed at GSH National Health Laboratory Service (NHLS). The GSH NHLS Laboratory is accredited by the South African National Accreditation Services (SANAS), a regulatory body responsible for laboratory conformity to ISO15189 assessments in South Africa. Assay performances were evaluated by daily internal quality controls, along with monthly external quality assurance proficiency testing. Serum and plasma samples were collected using BD Vacutainer® SSTTM II Advance and BD Vacutainer® K2EDTA tubes, respectively, centrifuged and analysed within 12 h of collection during 6-monthly outpatient visits to the GSH transgender clinic. The measured analytes included sodium, potassium, urea, creatinine, AST, ALT, alkaline phosphatase (ALP), gamma-glytamyltransferase (GGT), total cholesterol, triglycerides, HDL-C, calculated LDL-C (based on Friedewald formula), 24 oestradiol, testosterone, thyroid-stimulating hormone (TSH) and prolactin. Serum sodium (mmol/L) and potassium (mmol/L) were analysed using indirect ion-selective electrode potentiometry. Urea (mmol/L) was determined by means of a kinetic assay with urease and glutamate dehydrogenase and creatinine (μmol/L) was measured by enzymatic assay, based on the conversion of creatinine by utilising creatininase, creatinase, sarcosine oxidase and peroxidase. Total bilirubin (mmol/L) concentration was determined by colorimetric diazo method while the concentrations of ALT (U/L) and AST (U/L) were determined by measuring the catalytic activity of the enzymes without the addition of pyridoxal phosphate. GGT (U/L) was determined by means of a standardised enzymatic colorimetric assay and employment of sodium hydroxide and glycylglycine buffer. Serum ALP (U/L) concentration was determined by a colorimetric assay in accordance with a standardised method by measuring p-nitrophenol absorbance. Albumin (g/L) was measured by the bromocresol green colorimetric assay. Total cholesterol (mmol/L) concentration was determined by the enzymatic, colorimetric method using cholesterol esterase, cholesterol oxidase and peroxidase. Triglyceride (mmol/L) was measured by an enzymatic colorimetric test, without glycerol blanking, utilising lipoprotein lipase, glycerol kinase and a Trinder endpoint reaction. HDL (mmol/L) concentration was determined by a homogeneous enzymatic colorimetric test by action of cholesterol esterase, cholesterol oxidase and peroxidase. Prolactin (μg/L) and TSH (mIU/L) were measured by sandwich immunoassay utilising biotinylated monoclonal antibodies and monoclonal, ruthenium-labelled antibodies. Oestradiol (pmol/L) and testosterone (nmol/L) were both measured by competitive immunoassay, using streptavidin and biotinylated monoclonal-specific antibodies. All analytes were determined on a calibrated Roche Cobas® 6000 analyser (Roche Diagnostics, Mannheim, Germany) during the study period, according to the manufacturer’s recommendations.
Statistical analysis
Statistical analyses were performed using Statistica® V13.5 (Hamburg, Germany). Normality was determined by investigating normal probability plots and in cases where deviations were detected, log transformations were used to perform the single sample t-test. Medians and interquartile ranges were reported for non-parametric data and means and standard deviations were reported for parametric data. Single sample t-tests were used to compare sample means with the corresponding reference mean values and p-values < 0.05 were considered statistically significant. Distribution plots comparing baseline and post-hormone therapy initiation with cisgender reference intervals were generated using Gaussian kernel density estimation. The cisgender reference intervals (2.5% and 97.5% centiles) for both cisgender males (CM) and cisgender females (CF) at GSH NHLS laboratory served as the comparator with TM and TF subjects. Indirect reference intervals were established after bootstrapping with 1000 repetitions using 2.5% and 97.5% centiles for TM and TF. Reference change values (RCV) were obtained by using the formula RCV =
Results
Study Population
There were a total of 164 study participants, of which 56 were excluded, leaving 84 TF and 24 TM in the study as shown in Figure 1. The mean (standard deviation) age of the included group (N = 108) was 34 (9.4) years for TF and 33 (9.8) years for TM. Both TF and TM cohorts are at different stages of transition, where the TF cohort included in the study received varying combinations of conjugated oestrogens (0.3–2.5 mg), 17-beta oestradiol (2–6 mg), cyproterone acetate (50–100 mg) and spironolactone (25–50 mg), while the TM cohort received varying doses of testosterone cypionate (100–250 mg) intramuscularly, administered in dosing intervals of between two weekly and monthly. Study population included.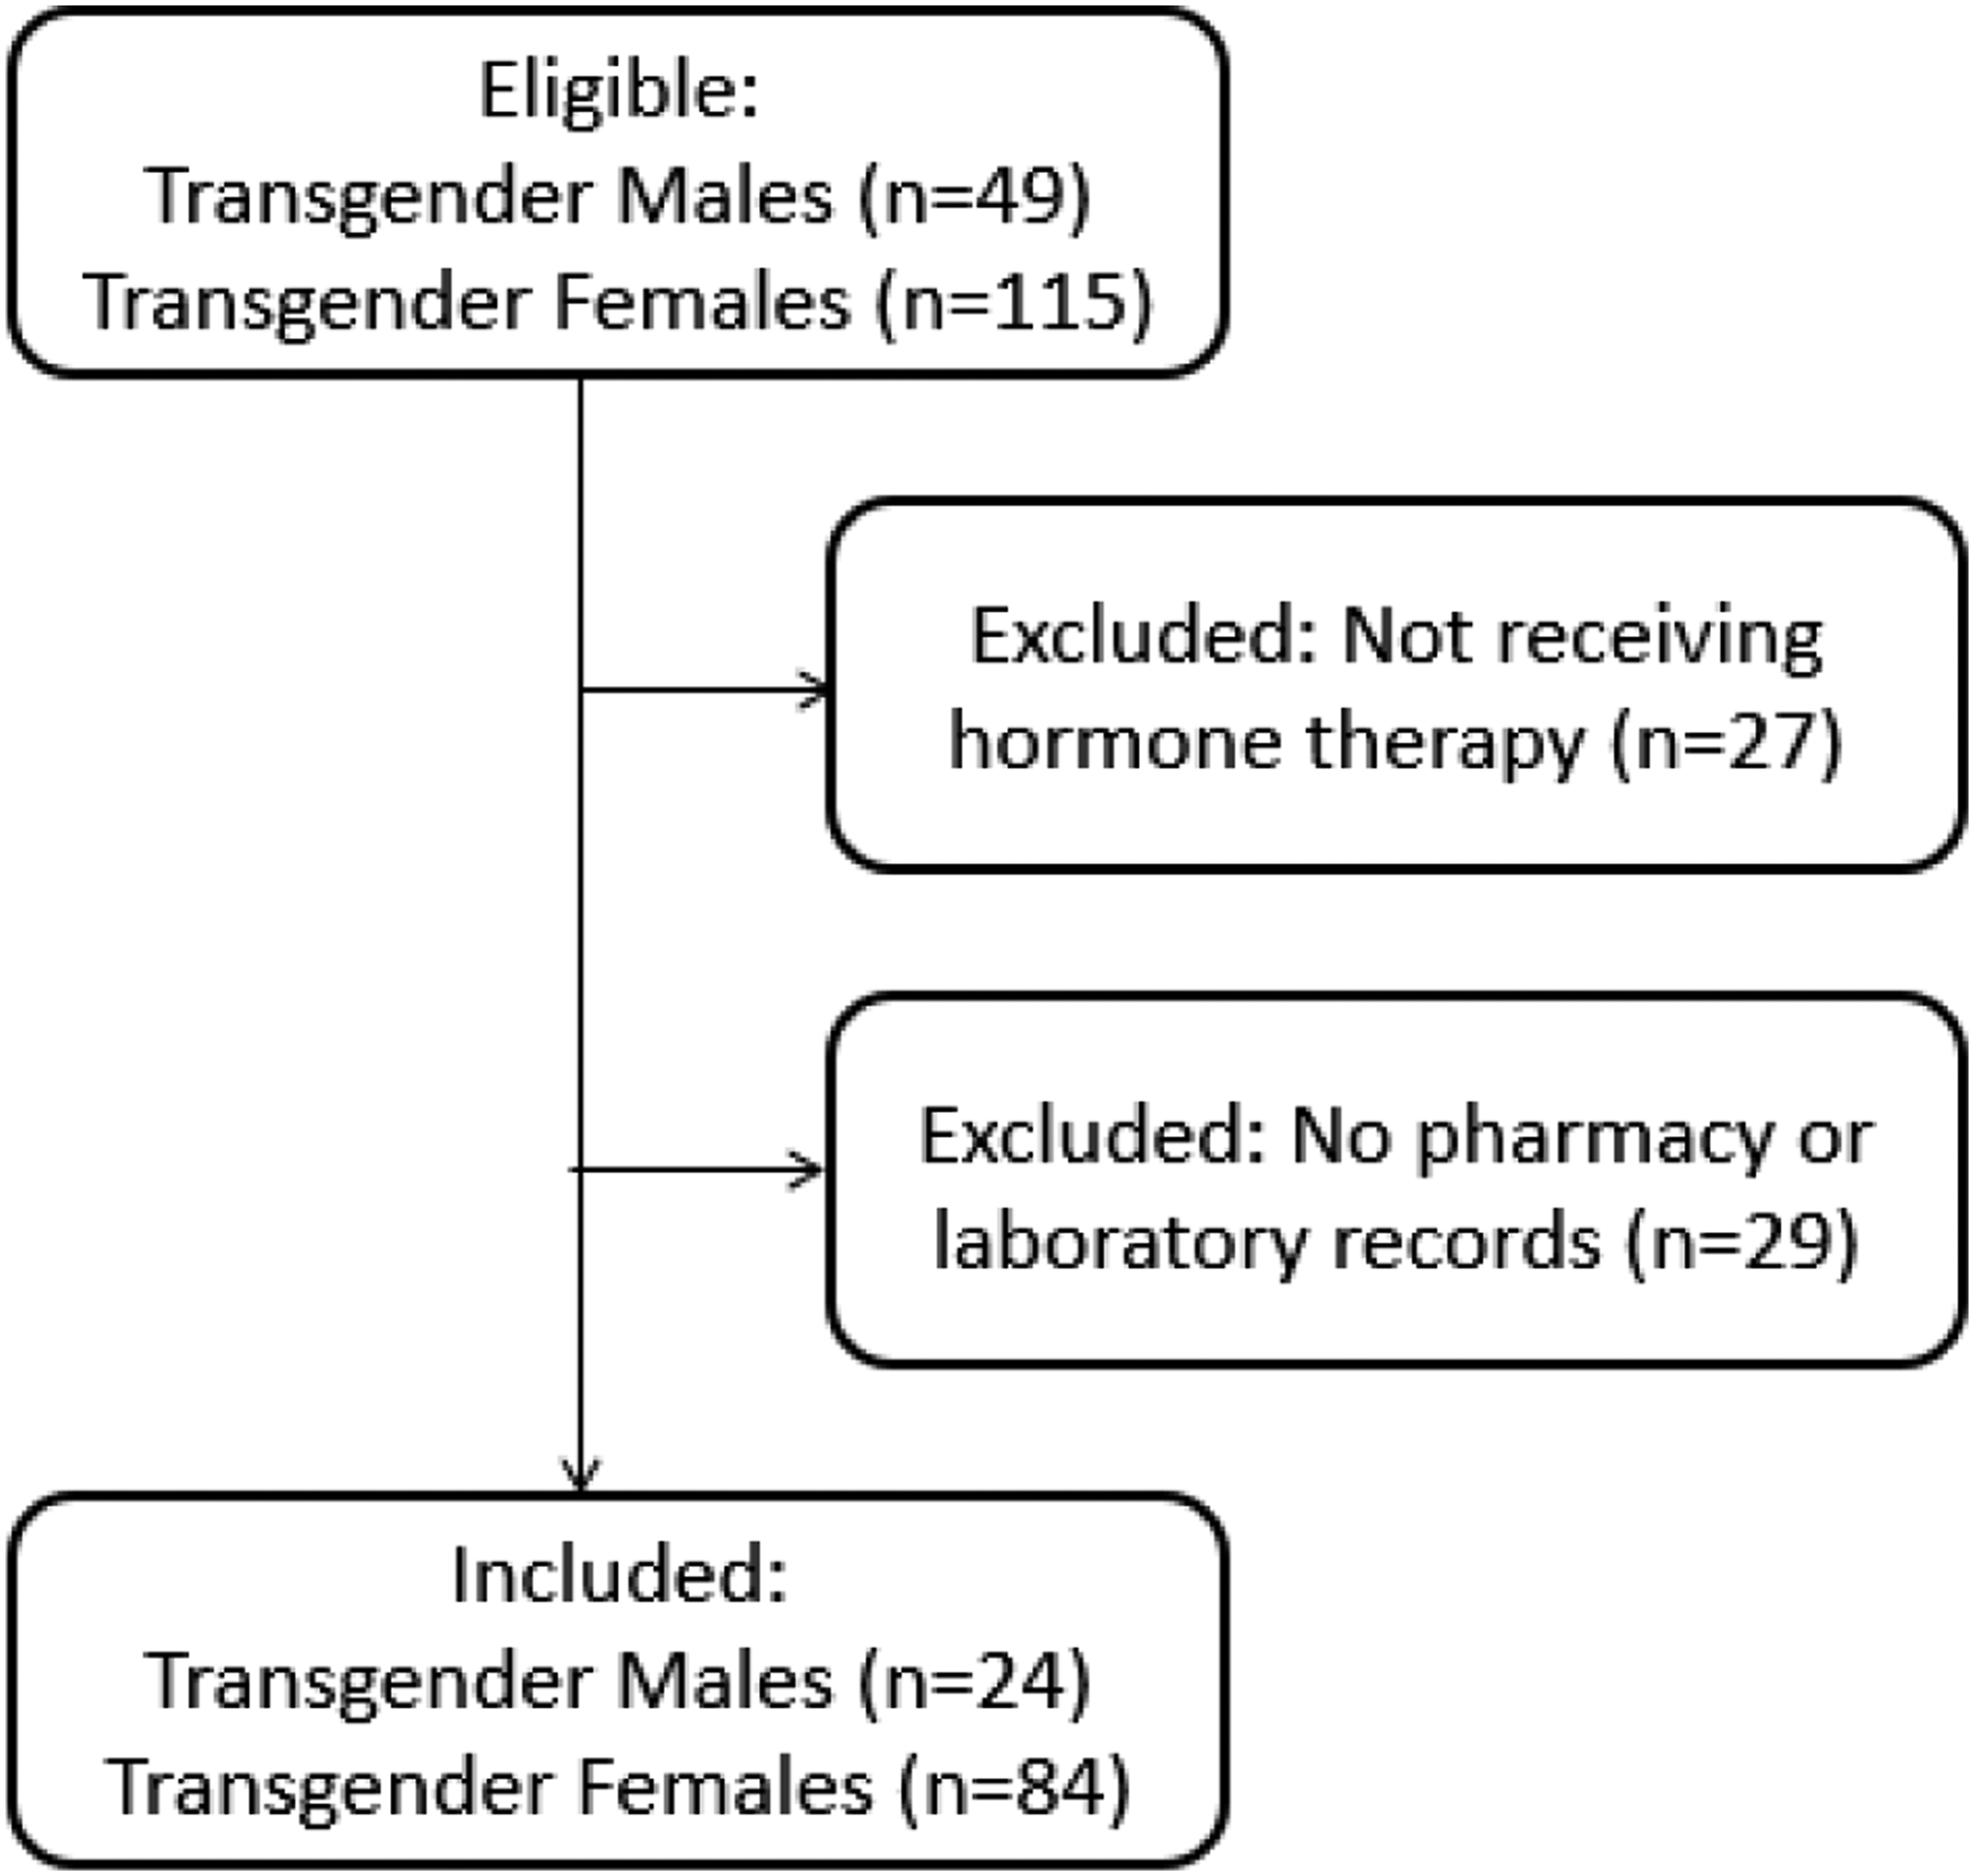
Normal probability plots
Normal probability plots (not shown) indicated that for the TF cohort sodium, potassium, creatinine, albumin and ALP were normally distributed, whereas urea, total bilirubin, ALT, AST, GGT, oestradiol, testosterone, TSH and prolactin were non-parametric. Normal probability plots (not shown) for the TM cohort identified normal distribution of data for sodium, potassium, creatinine and ALP, whereas data for urea, total bilirubin, ALT, AST, GGT, oestradiol, testosterone, TSH and prolactin were non-parametric.
Reference Intervals
Reference intervals comparison between CF to TF. p-values and RCV were determined by comparing CF and TF reference interval means. RCV comparing CF to TF lower and upper reference interval limits were also determined.
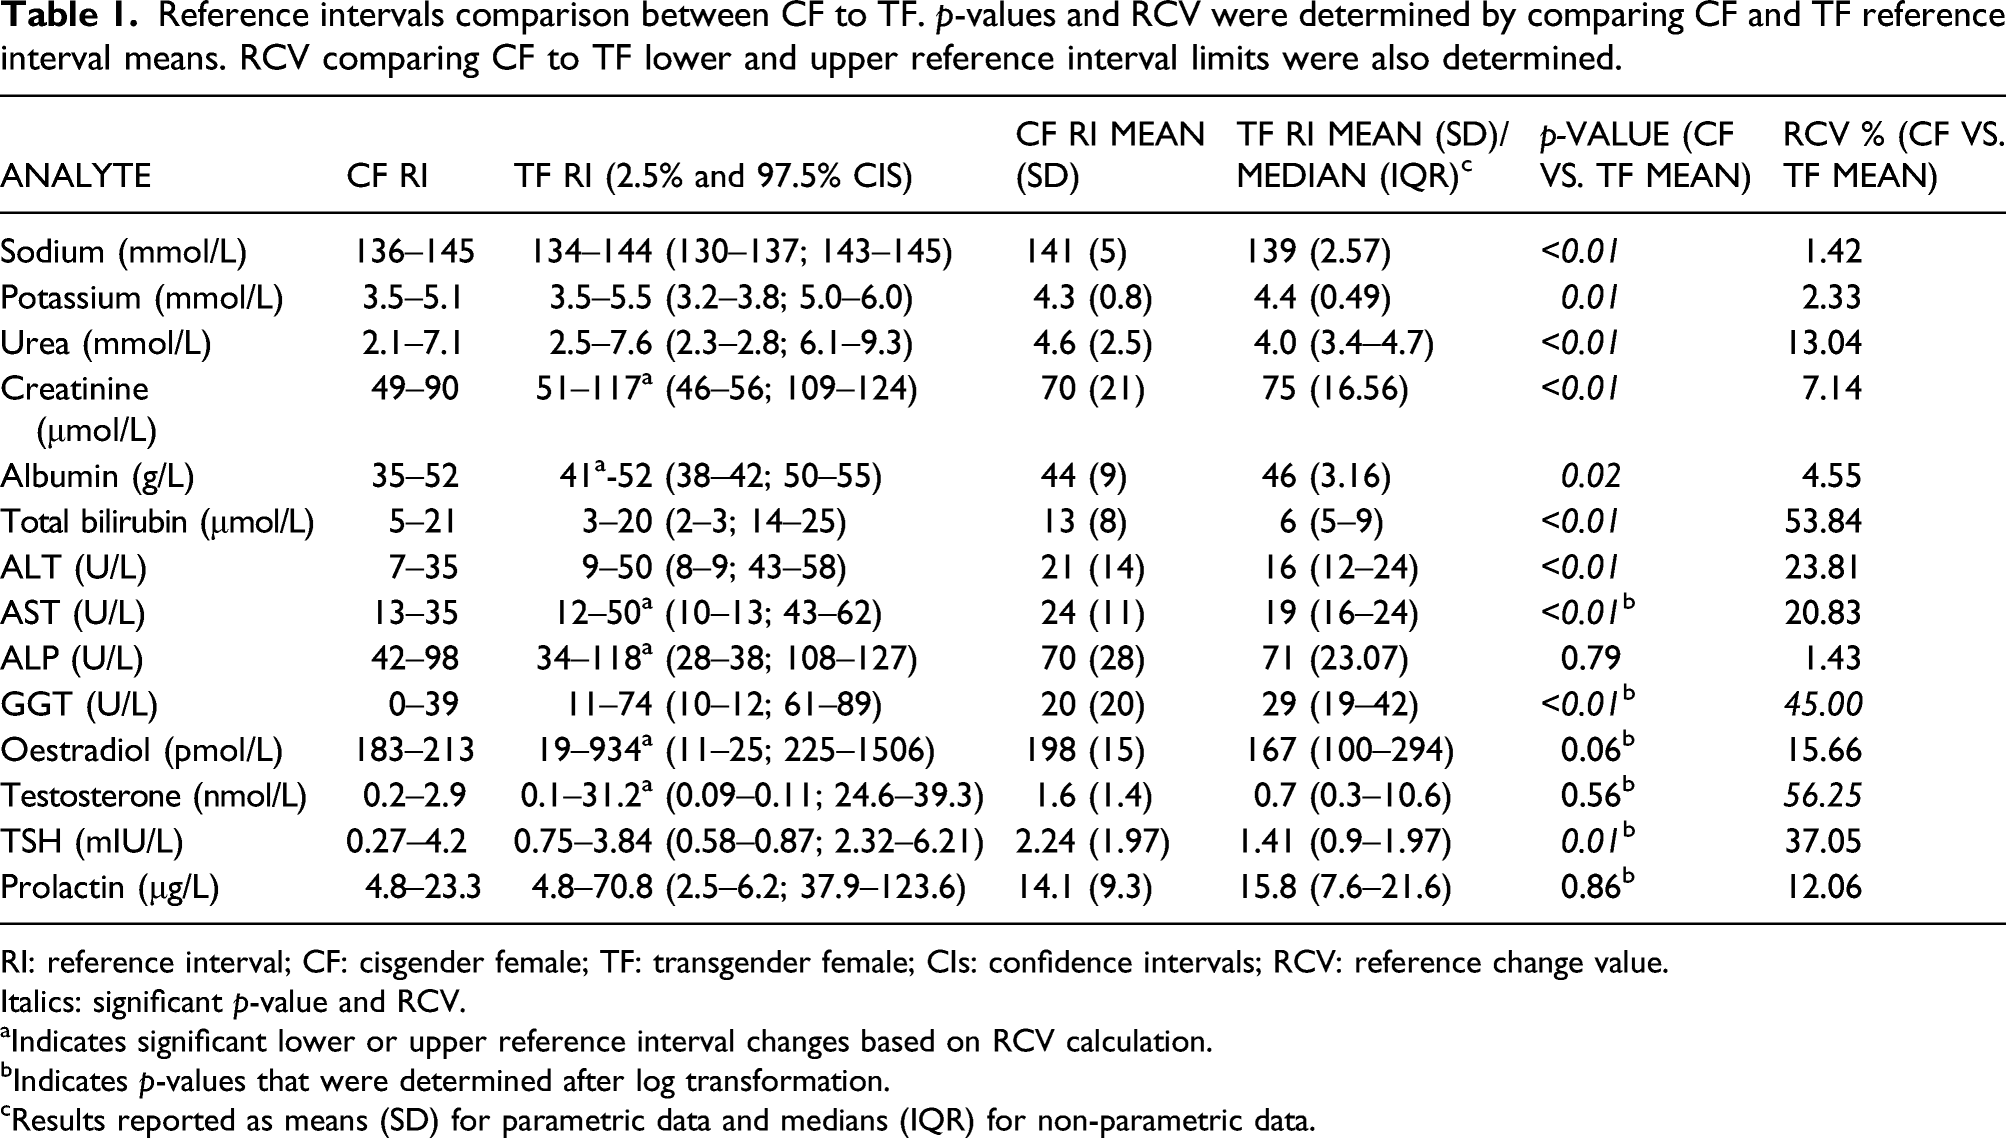
RI: reference interval; CF: cisgender female; TF: transgender female; CIs: confidence intervals; RCV: reference change value.
Italics: significant p-value and RCV.
aIndicates significant lower or upper reference interval changes based on RCV calculation.
bIndicates p-values that were determined after log transformation.
cResults reported as means (SD) for parametric data and medians (IQR) for non-parametric data.
Reference intervals comparison between CM and TM. p-values and RCV were determined by comparing CM and TM reference interval means. RCV comparing CM to TM lower and upper reference interval limits were also determined.
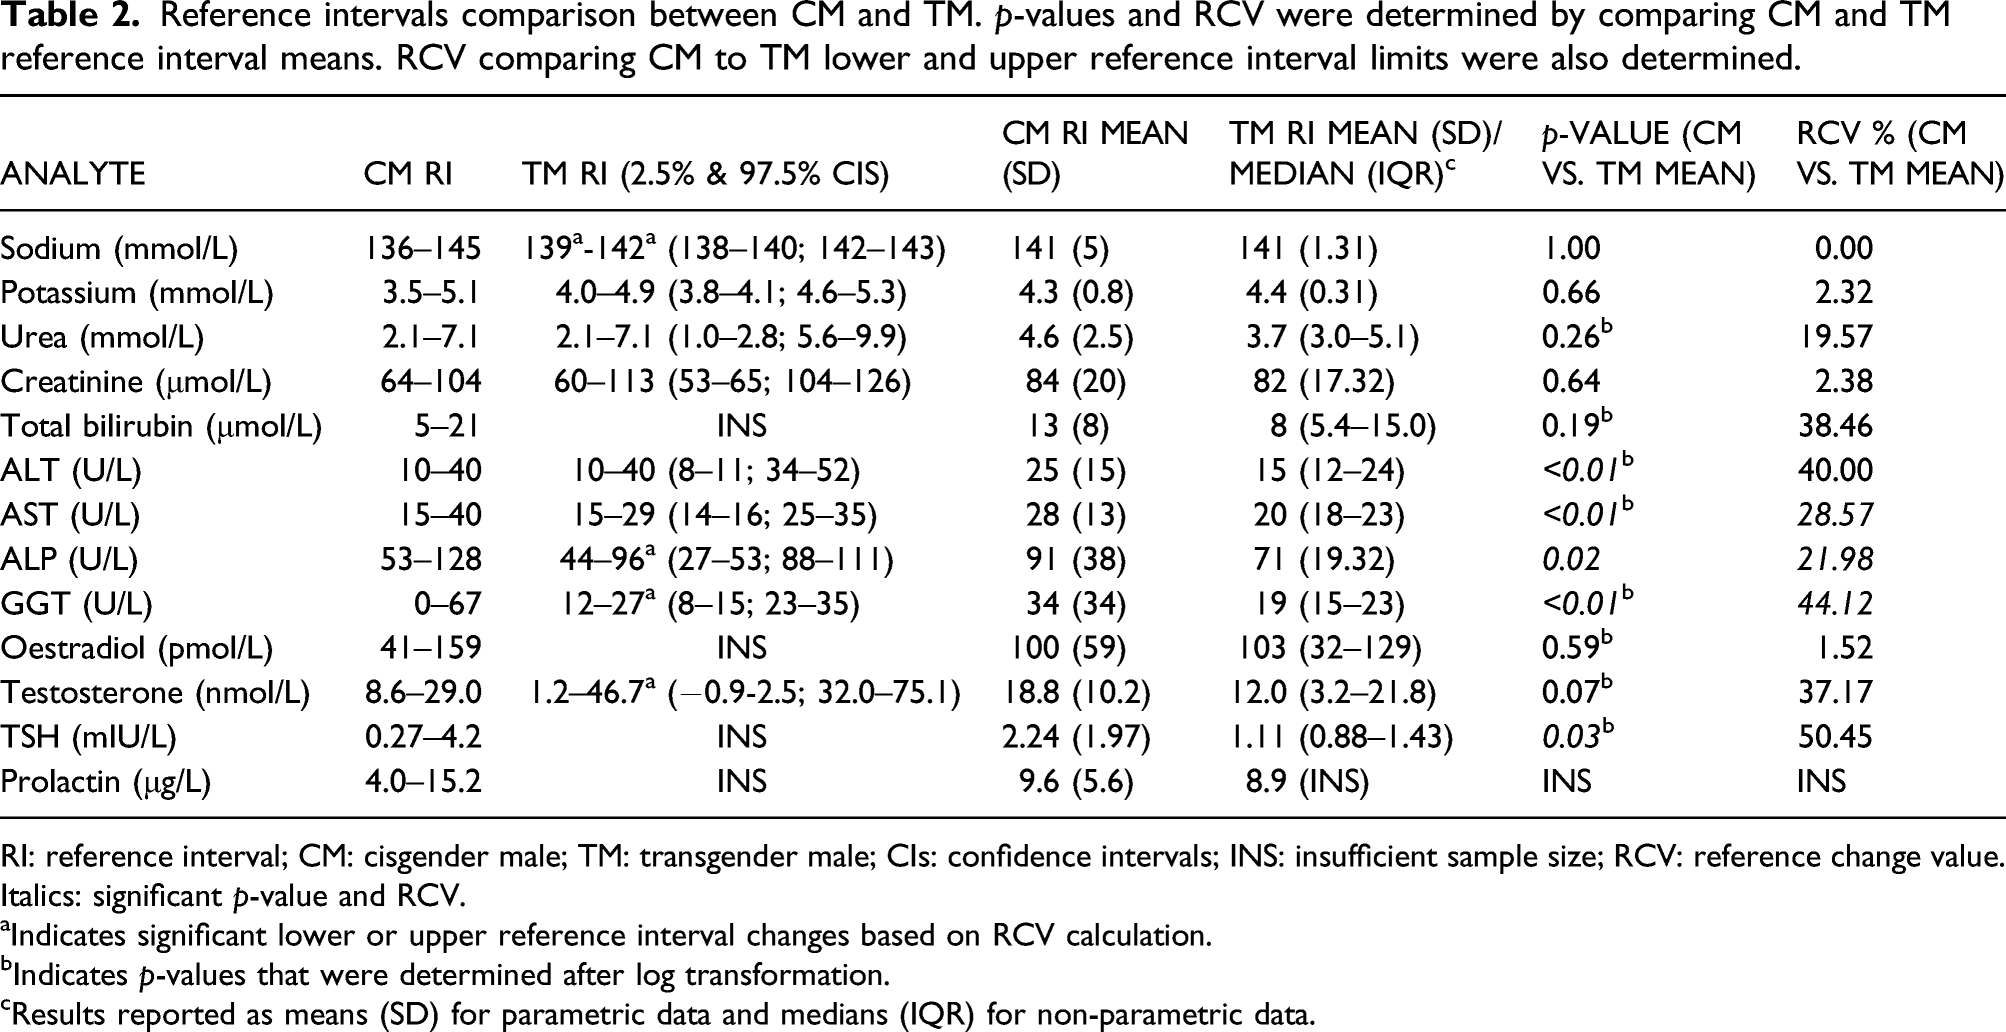
RI: reference interval; CM: cisgender male; TM: transgender male; CIs: confidence intervals; INS: insufficient sample size; RCV: reference change value.
Italics: significant p-value and RCV.
aIndicates significant lower or upper reference interval changes based on RCV calculation.
bIndicates p-values that were determined after log transformation.
cResults reported as means (SD) for parametric data and medians (IQR) for non-parametric data.
Comparison of lipid and lipoprotein least square (LS) means (SE), at baseline (prior to hormone therapy) and following hormone therapy initiation in transgender subjects. p-values and RCV were determined by comparing baseline and post-hormone therapy initiation means.
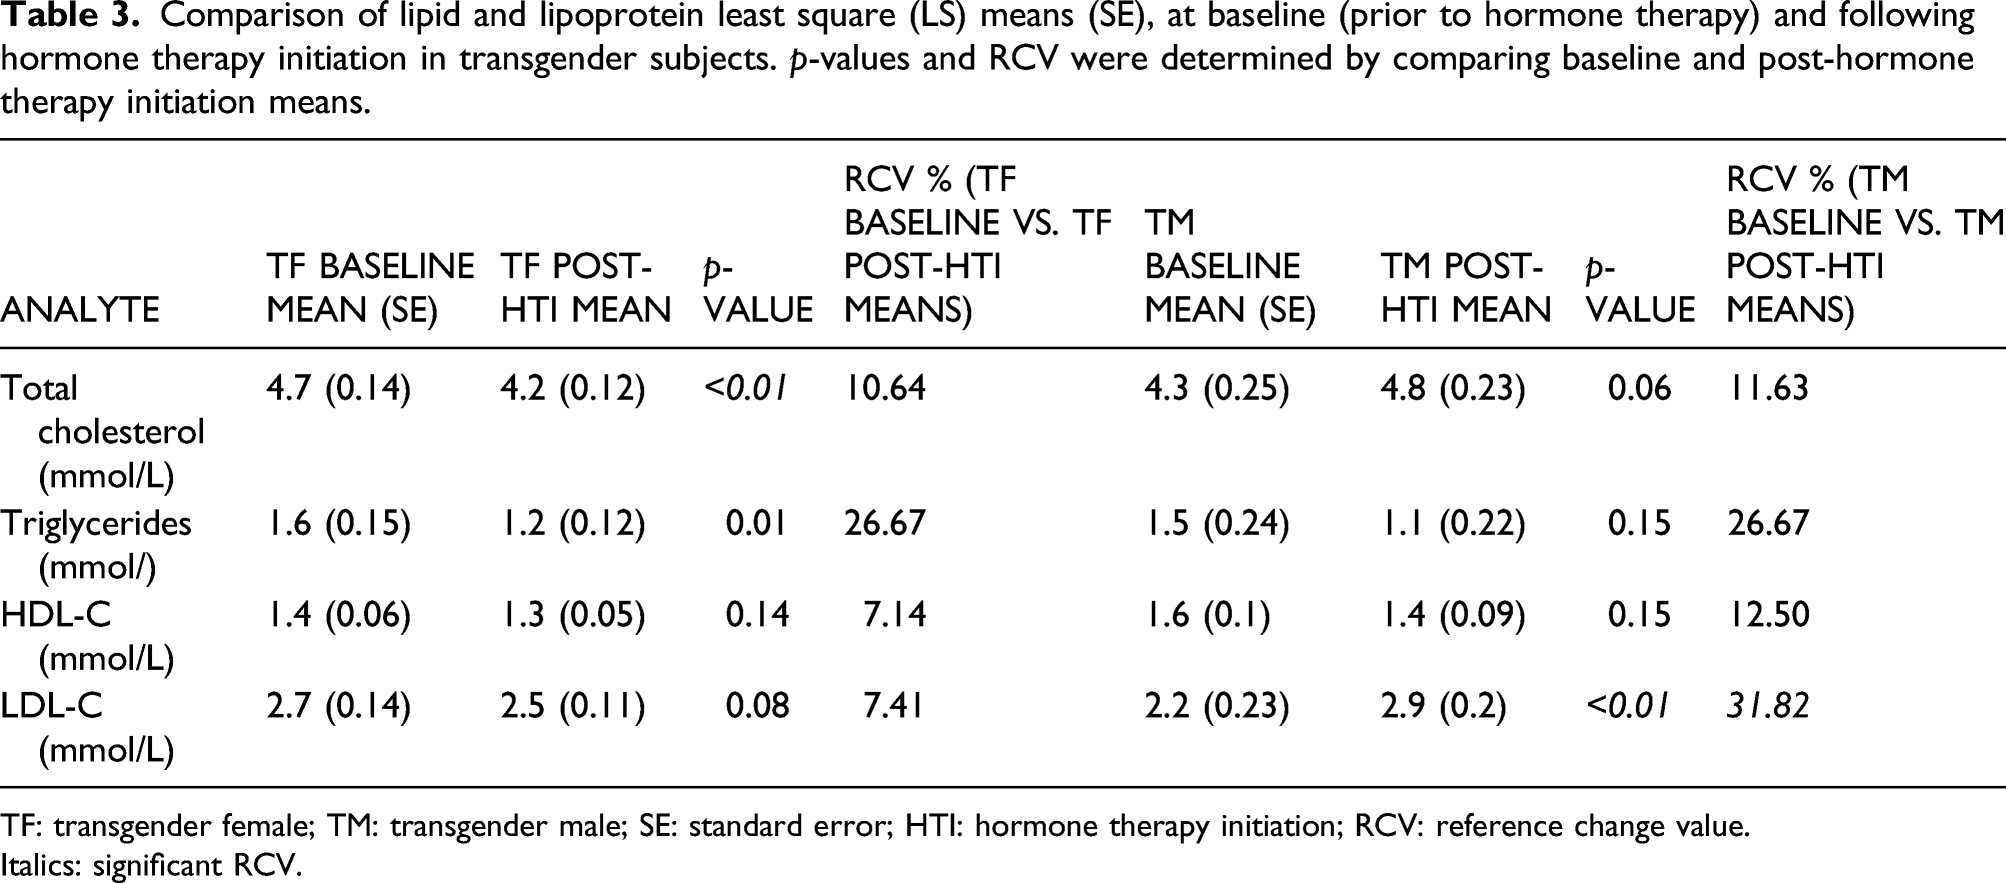
TF: transgender female; TM: transgender male; SE: standard error; HTI: hormone therapy initiation; RCV: reference change value.
Italics: significant RCV.
Biochemical distribution plots of results for transgender females
As TF receive spironolactone as part of their transition medication, the study specifically examined electrolyte reference intervals and their distribution. As lean muscle mass changes with hormone therapy, we also focussed on creatinine. Figure 2 shows the distribution pre- and post-hormone therapy initiation for sodium, potassium, creatinine and ALT without showing any significant differences. Small irregularities seen on the figures are due to small sample size. Baseline versus post-hormone therapy initiation distribution figures for transgender females. CF = cisgender females; RI = reference interval; TF = transgender female; HTI = hormone therapy initiation.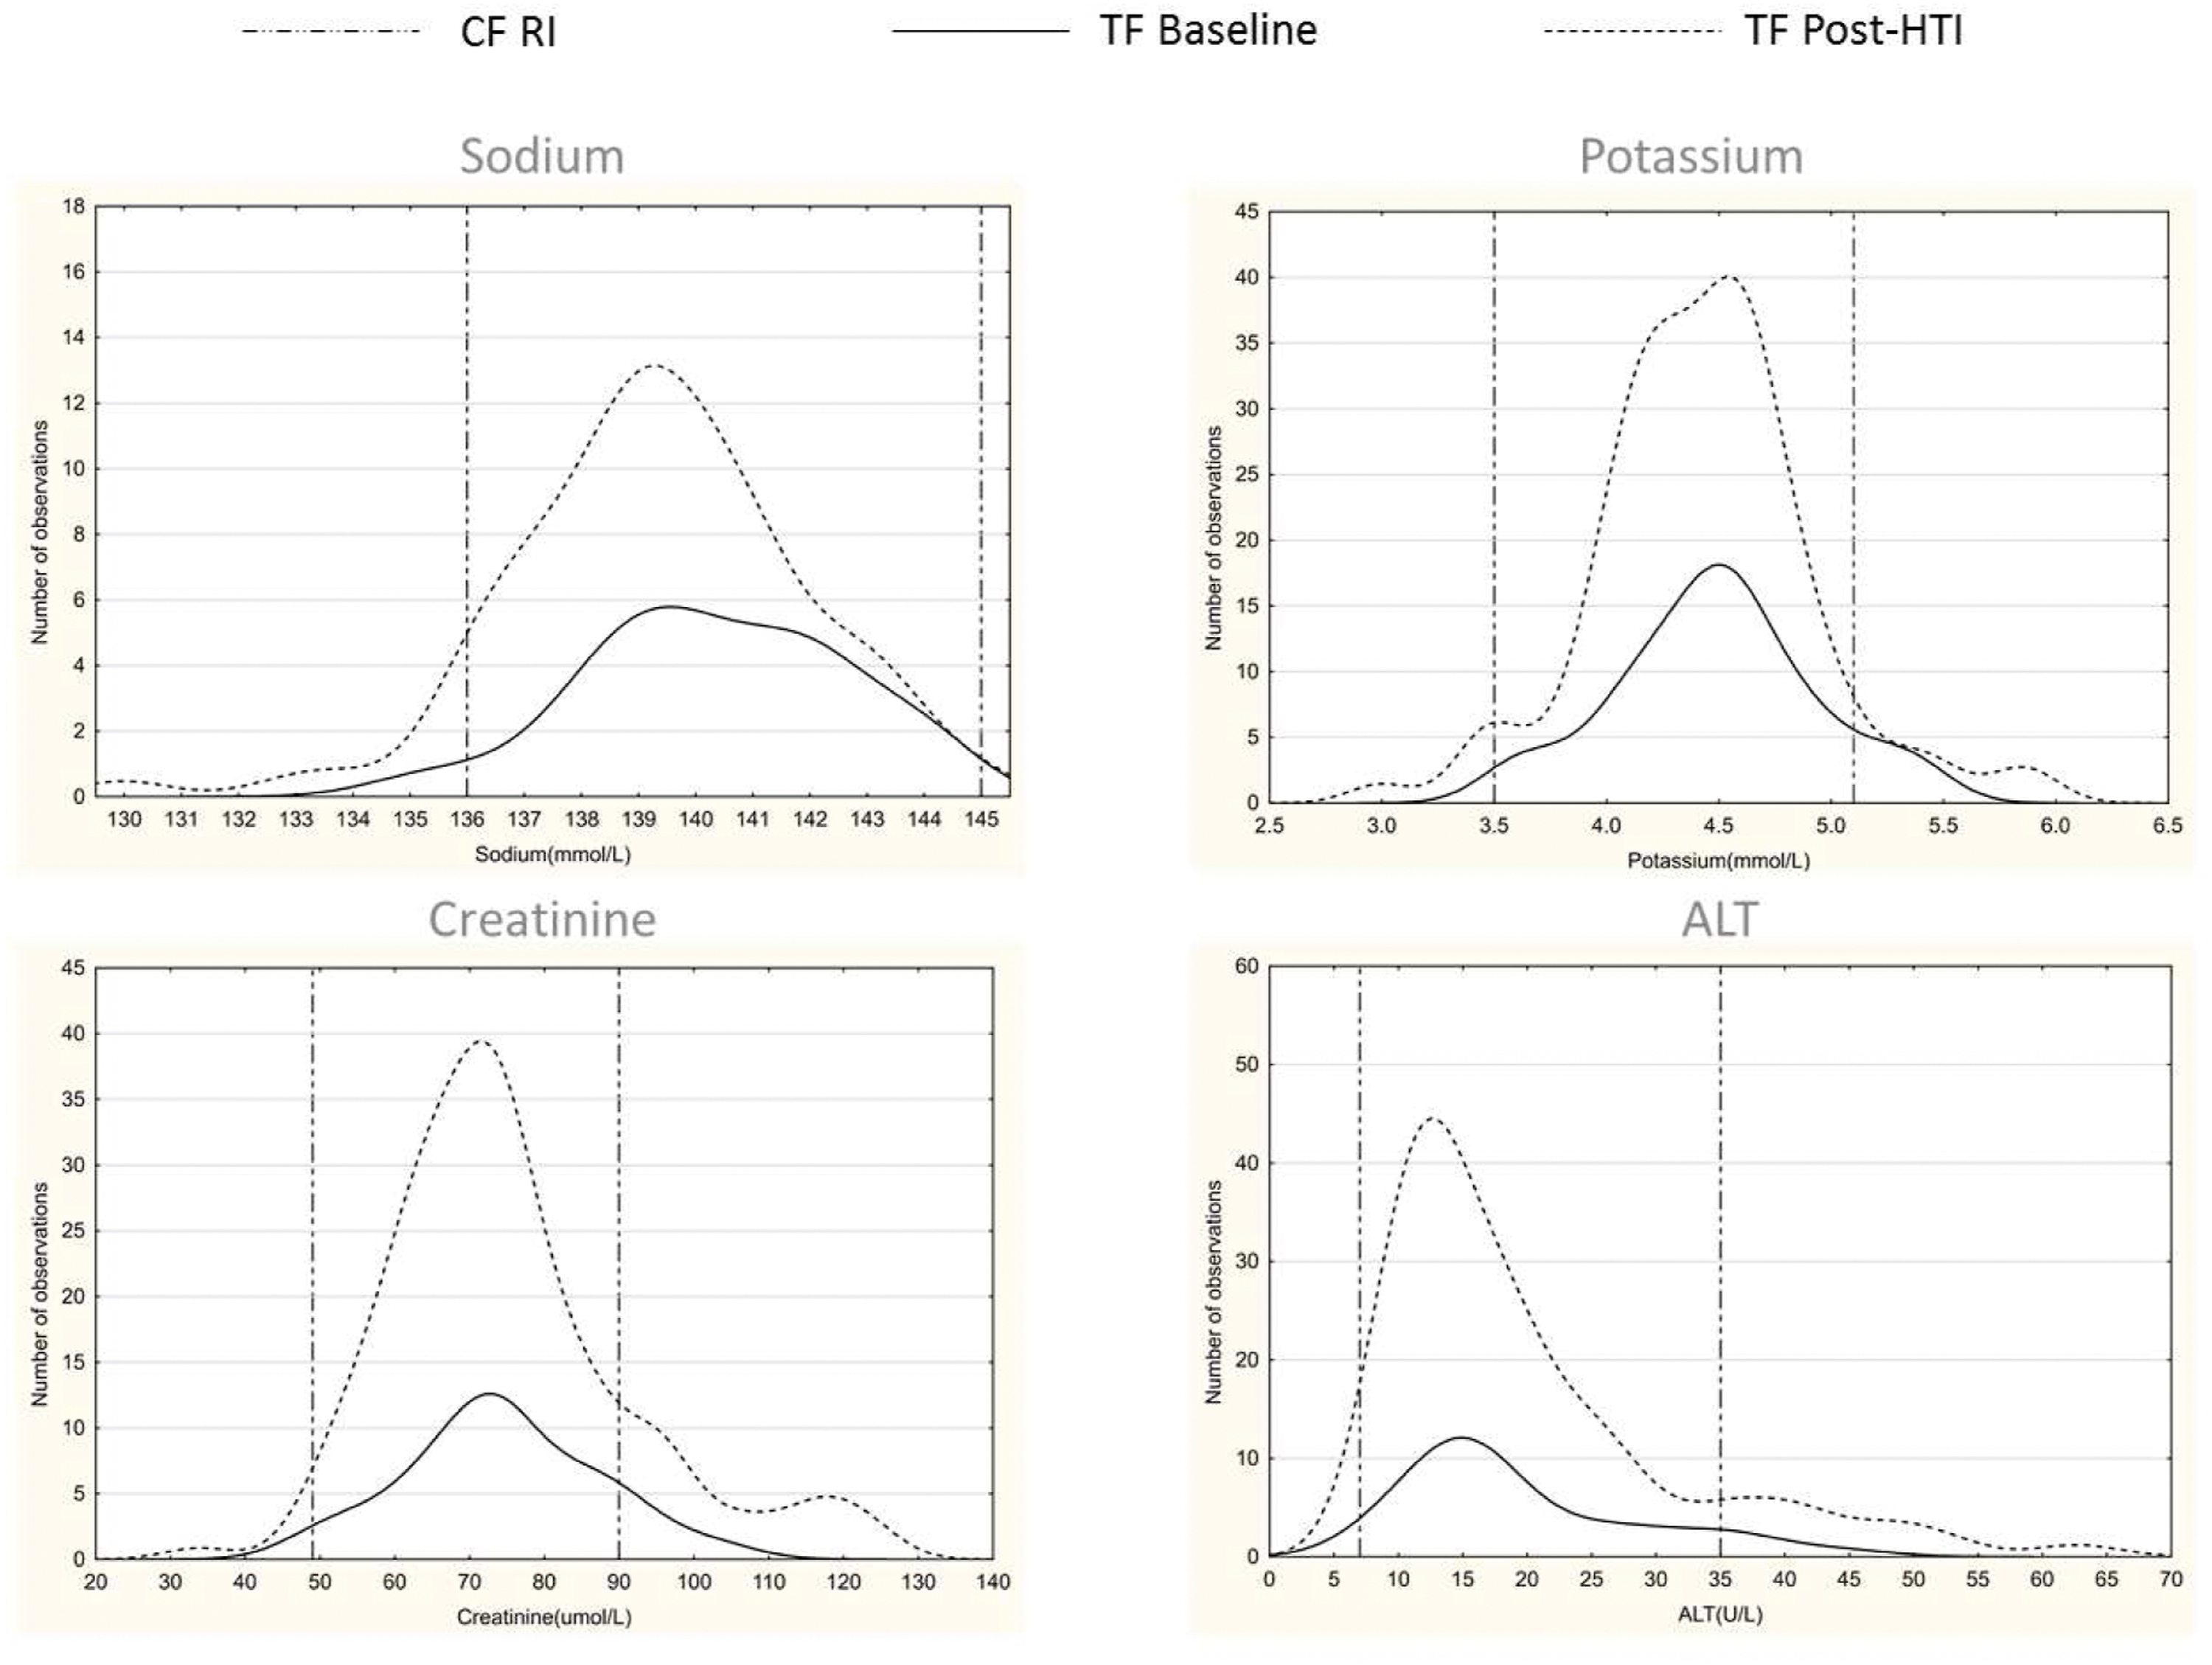
Biochemical distribution plots of results for transgender males
As numbers of observations for this specific study cohort were limited, only creatinine and ALT are shown in Figure 3. The distribution of ALT when compared to baseline results and CM reference intervals, were not significantly different from post-hormone therapy initiation results, whereas creatinine showed a noticeable rightward shift in the distribution, approximating CM reference intervals. Small irregularities seen on the figures are due to small sample size. Baseline versus post-hormone therapy initiation distribution figures for transgender males. CM = cisgender males; RI = reference interval; TM = transgender male; HTI = hormone therapy.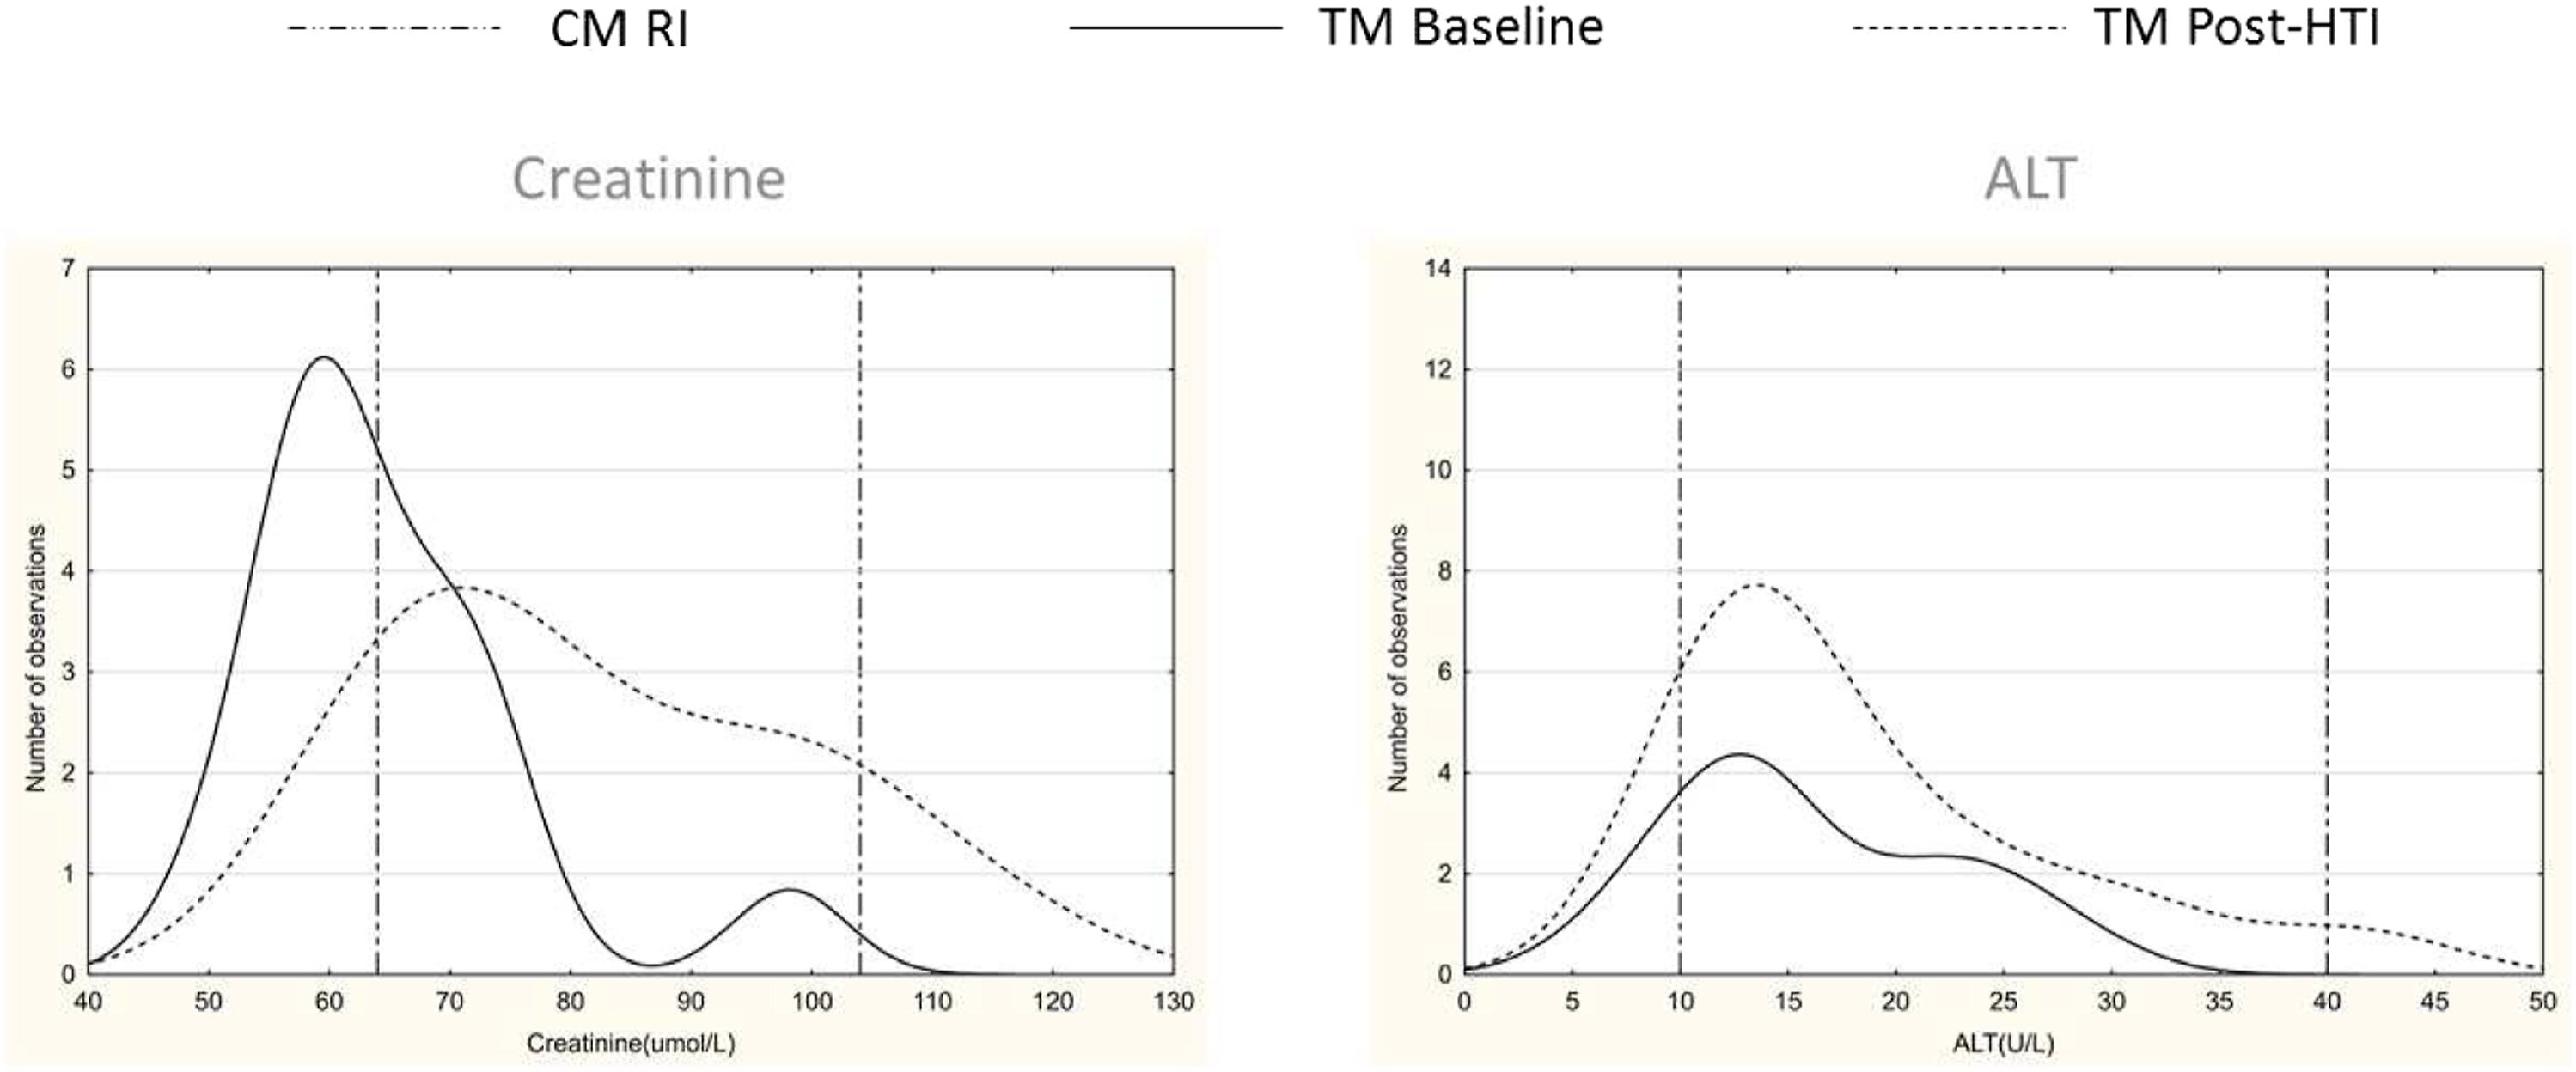
Discussion
This study investigated the effects of gender-affirming hormone therapy on common biochemical analytes and established reference intervals for TM and TF. This is the first study of its kind in the South African transgender community and one of few studies worldwide addressing reference intervals in this population. Although many findings were statistically significant, clinically relevant changes in means for TM included a lower mean for ALP and GGT and a higher mean for LDL-C, while TF exhibited a higher mean for GGT and testosterone. Furthermore, clinically relevant changes in TM reference intervals were seen for the lower and upper limits for sodium, and upper reference limits for ALP, GGT and testosterone. Clinically relevant changes in reference intervals were observed for the lower limit of albumin and upper limits for creatinine, AST, ALP, oestradiol and testosterone in TF.
Reference interval differences for sodium in TM were calculated to be clinically significant, with a suggested interval of 139–142 mmol/L, although means were identical to CM. The increased lower limit could be due to amplified sodium reabsorption due to testosterone administration. 26 Moreover, those participants who received varying doses of spironolactone, as anti-androgen therapy, constituted 27% of the TF cohort, but we did not observe clinically significant changes in potassium levels. As it represents a relatively small proportion who were receiving spironolactone, a need to re-evaluate changes in potassium is still warranted.
As expected, TM receiving testosterone supplementation showed an increase in serum creatinine levels due to increased muscle mass and therefore an increase in muscle breakdown products. In our study, creatinine reference intervals for TM are comparable to CM values. This was corroborated in a study assessing the metabolic effects of hormone therapy in transgender patients by Fernandez et al. 27 Interestingly, TF mean creatinine concentrations were significantly higher compared to CF, along with a higher upper reference interval limit. We postulate that this may be due to a ‘legacy effect’, where despite androgen suppression and oestrogen therapy, lean muscle mass is maintained. Although there may be a lower mean creatinine in TF, their reference intervals for creatinine are comparable to CM, concordant with some studies,12,28 but discordant with others.20,27
Liver function tests (ALT, AST, ALP and GGT) were significantly lower in TM compared to CM. This could be due to the effect of testosterone therapy decreasing body fat and stimulation of the adiponectin pathway.29,30 Sorelle et al. previously identified increases in ALT in TM, which may occur after several years of testosterone therapy.14,15 Furthermore, testosterone therapy promotes bone formation and turnover in TM with an expected rise in ALP.17,18 However, our TM cohort showed clinically relevant, albeit small numbers (N=8), lower means and reference intervals for ALP, but it could represent a function of the escalation of testosterone doses, rather than their stable pharmacological doses. It is suggested that ALP increases by 13% within the first year of hormone therapy, 18 but when we analysed this group in its entirety at varying phases of their transition, this was not observed. On the other hand, TF had a clinically relevant elevated GGT mean when likened to CF. We postulate that this could be due to altered liver lipid metabolism and the possible development of fatty liver disease. 31 Furthermore, increased GGT levels have been described in a longitudinal study in patients receiving oral oestrogen treatment. 32 Although the total bilirubin mean in TF was statistically different, this was not considered to be clinically relevant.
Analyses of lipids and liver enzymes were tests most often requested during follow-up visits. As there are no reference intervals for total cholesterol, triglycerides, HDL-C or LDL-C, but rather specific targets suggested by International and South African Dyslipidaemia Guidelines,33,34 baseline lipogram means were compared to post-hormone therapy initiation means. Interestingly, total cholesterol and triglycerides were significantly lower in TF after hormone therapy initiation, while LDL-C levels were significantly higher in TM, compared to their baseline results. Our findings for TF were in agreement with those found in a clinical trial by Wierckx et al. 20 However, the finding of lower triglycerides was in contrast to another study by Roberts et al., 12 who described higher triglycerides. Previous reports demonstrated higher total cholesterol, triglycerides and LDL-C in TF receiving hormone therapy.12,35 The finding of higher total cholesterol and LDL-C in TM was also described in a 2017 meta-analysis of cardiovascular outcomes. 36 In a dynamic study on the impact of hormone therapy on laboratory values, Allen et al. found increased LDL and decreased HDL in TM and increased HDL in TF. 15 The changes seen in the lipid fractions are inconsistent, and it is most prudent to interpret each person and provide the necessary risk modification therapy while being cognisant that alterations are likely in these groups of patients.
The finding of clinically significant higher upper reference range limits, based on RCV calculation for testosterone for TM and oestrogen for TF, may be attributed to the potential supra-physiological doses administered during hormone treatment. When comparing the CM and TM means for testosterone and CF and TF means for oestradiol, respectively, one could conclude that although their upper reference limits differ, their means are biochemically comparable to their identified gender, and it may serve as a guide to dose adjust hormone therapy. 37 Furthermore, the finding of a higher mean and upper reference interval limit for testosterone in TF may possibly be due to inadequate testosterone suppression during the transition in feminising therapy.
We found that the upper reference range for prolactin was increased among TF and this is not surprising, as oestrogen therapy leads to lactotroph hyperplasia and subsequent elevation of prolactin concentrations. 38 Although varying incidence of hyperprolactinaemia have been reported to be as high as 15%, only 2% (N=2) of our TF cohort had hyperprolactinaemia of which only 1% (N=1) was clinically relevant.39,40 Nevertheless, the Endocrine Society recommends monitoring for hyperprolactinaemia in TF individuals, which was also echoed in a paper by Raven et al.37,41
Androgen deprivation therapy substantially lowers TF risk for prostate cancer, as shown in a recent retrospective cohort in the Netherlands, and routine PSA testing is not recommended.42,43 From our study, only five (6%) PSA tests were performed in the TF cohort, supporting this recommendation.
Currently, individuals are categorised as either male or female on the South African public and private laboratory test request forms that do not accommodate transgender individuals’ gender identity. This may lead to confusion when registering and reviewing results, which do not align with the registered gender and identified gender, that is, PSA analysis in TF or oestradiol analysis in TM. Gender-specific reference intervals, based on cisgender population studies, are assigned to the registered sex and may negatively impact the interpretation of those results. A recent opinion piece suggested that laboratory information systems could bridge this gap by providing both CM and CF reference intervals simultaneously and allowing clinicians to interpret results accordingly. 44
The study had several strengths, including being the first of its kind to address biochemical parameters in transgender individuals on hormone therapy in Africa. It is the only study to determine biochemical reference intervals for TM and TF on hormone therapy. Furthermore, this study was headed by laboratory professionals, with careful consideration given to pre-analytical, analytical and post-analytical factors that may influence observed results. Limitations include the small study population, especially the TM cohort, where it should be noted that bootstrapping sample sizes fewer than 50 may produce biased estimates. 45 Pre-analytical patient factors, including fasting status, alcohol intake and smoking could not be accounted for. Follow-up biochemical and haematological investigations at the transgender clinic were performed inconsistently, negatively impacting the statistical power of certain analytes. As participants were at varying stages of transition, the study did not take into consideration their relative, lower doses of hormone therapy, but viewed each group in its entirety. Lastly, reference intervals were determined based on cumulative results after hormone therapy initiation and did not take into account dynamic changes that occur in the transition process.
Conclusions
The role of the laboratory in transgender medicine is of utmost importance to guide therapy. To echo the sentiments of Adriaansen et al., transgender individuals are considered long-term users of laboratory services, therefore laboratory sciences should invest in solutions and further research is needed to verify the true reference intervals for these individuals to enable evidence-based clinical decision-making. 44 Larger studies are needed to verify the drift in reference ranges, taking into consideration various stages of hormonal transition.
Supplemental Material
sj-pdf-1-acb-10.1177_00045632211066777 – Supplemental material for Reference intervals for biochemical analytes in transgender individuals on hormone therapy
Supplemental material, sj-pdf-1-acb-10.1177_00045632211066777 for Reference intervals for biochemical analytes in transgender individuals on hormone therapy by Morné C Bezuidenhout, Marli Conradie-Smit, Joel A Dave, Elma de Vries and Ian L Ross in Annals of Clinical Biochemistry
Footnotes
Acknowledgements
The authors thank Dr John Torline for his contribution to the original database, Prof Martin Kidd for the statistical analysis, and Dr Marizna Korf for the study concept.
Contributorship
MCB: Conceptualization; Data curation; Formal Analysis; Investigation; Methodology; Project administration; Visualisation; Original and final draft writing and editing. AEZ: Supervision; Original and final draft reviewing and editing. ILR, JAD, MC-S: Study design, Final draft reviewing and editing. EDV: Final draft reviewing and editing.
Declaration of conflicting interests
The author(s) declared no potential conflicts of interest with respect to the research, authorship, and/or publication of this article.
Funding
The author(s) received no financial support for the research, authorship, and/or publication of this article.
Ethical approval
Stellenbosch University and the University of Cape Town Health Research and Ethics Committees approved this study with reference numbers S20/01/014 and 118/2020, respectively. Given the retrospective nature of the study, a waiver of informed consent was approved by both committees.
Guarantor
AEZ.
Supplemental material
Supplemental material for this article is available online.
References
Supplementary Material
Please find the following supplemental material available below.
For Open Access articles published under a Creative Commons License, all supplemental material carries the same license as the article it is associated with.
For non-Open Access articles published, all supplemental material carries a non-exclusive license, and permission requests for re-use of supplemental material or any part of supplemental material shall be sent directly to the copyright owner as specified in the copyright notice associated with the article.