
Abstract
Background
Haemolysis, icterus and lipaemia (HIL) are common interferants in laboratory medicine, potentially impacting patient care. This survey investigates HIL management in medical laboratories across the UK and Republic of Ireland (ROI).
Methods
A survey was sent to members of key professional organisations for laboratory medicine in the UK and ROI. Questions related to the detection, monitoring, quality control, and management of HIL.
Results
In total, responses from 124 laboratories were analysed, predominantly from England (52%) and ROI (36%). Most responses were from public hospitals with biochemistry services (90%), serving primary care (91%), inpatients (91%), and outpatients (89%). Most laboratories monitored H (98%), I (88%), and L (96%) using automated indices (93%), alone or in combination with visual inspection.
Manufacturer-stated cut-offs were used by 83% and were applied to general chemistries in 79%, and immunoassays in 50%. Where HIL cut-offs are breached, 64% withheld results, while 96% reported interference to users. HIL were defined using numeric scales (70%) and ordinal scales (26%). HIL targets exist in 35% of laboratories, and 54% have attempted to reduce HIL. Internal Quality Control for HIL was lacking in 62% of laboratories, and just 18% of respondents have participated in External Quality Assurance. Laboratories agree manufacturers should: standardise HIL reporting (94%), ensure comparability between platforms (94%), and provide information on HIL cross-reactivity (99%). Respondents (99%) showed interest in evidence-based, standardised HIL cut-offs.
Conclusions
Most respondents monitor HIL, although the wide variation in practice may differentially affect clinical care. Laboratories seem receptive to education and advice on HIL management.
Introduction
Clinical laboratories are responsible for ensuring the integrity of each specimen processed and minimising all sources of error in the total testing process (TTP). Preanalytical errors (PAE) account for the majority of errors in the TTP1–4 and may yield spurious results, in turn leading to inappropriate, delayed, and therefore more costly patient management. Haemolysis (H), icterus (I), and lipaemia (L) are collectively the most frequently encountered analytical errors in laboratory medicine. Haemolysis, icterus and lipaemia (HIL) can interfere in analyses by numerous mechanisms, either directly or indirectly, in a concentration-dependent manner.5–8
Haemolysis results from red blood cell breakdown, classically resulting in a red discolouration of serum or plasma of samples, and is the single most common PAE in laboratory medicine.5,7,9–11 The vast majority of haemolysis occurs in vitro, for many reasons, most commonly involving errors during phlebotomy, 11 while in vivo haemolysis (due to underlying pathological processes) is a significant but much less common source of error. Haemolysis may cause interference by biological, chemical, and spectral mechanisms. 11
Icterus describes the orange discolouration of plasma or serum by bilirubin, 3 occurring where hyperbilirubinaemia is >100 µmol/L 6 and is most commonly associated with liver damage due to cirrhosis, gallstones, hepatitis, or drug toxicity. 5 Icteric interference is spectral in nature, with spectrophotometric absorbance in the range 380 nm to 520 nm.
Lipaemia is observed as a turbid or cloudy appearance in serum and plasma specimens and is due to the presence of lipid and lipoprotein, 9 most commonly due to impaired fasting before phlebotomy. Lipaemic compounds may cause light scattering during spectrophotometric measurement and interfere across the entire spectral range, most notably at lower wavelengths. 9 Lipaemia may also cause preanalytical error by affecting the homogeneity of a serum or plasma specimen, whereby analytes will redistribute between lipid and aqueous layers based on their polarity or by volume displacement effects. 9
In the clinical laboratory, many analytes are quantified spectrophotometrically at wavelengths overlapping the absorbance spectra for H, I, and L, leading to overestimation or underestimation of analyte concentrations. 7 Thus, it is expected that most laboratories in the United Kingdom (UK) and Republic of Ireland (ROI) will routinely screen for HIL in serum and plasma samples, particularly where they are accredited to ISO15189. Laboratories should use either visual or semi-quantitative techniques12,13 to identify where the magnitude of HIL may be causing significant interference in the quantification of a specific analyte.6–8
The most reliable option for identifying potential HIL is semi-quantitative “serum indices” or “plasma indices”, comprising the haemolytic index, icteric index, and lipaemic index calculated using analyser-specific algorithms 14 interference in high-throughput laboratories. 15 Analyser platforms differ in their method of measuring indices in terms of sample size, diluent, volume, units, and wavelengths of measurements, and whether continuous or ordinal scales are used9,15
The vast majority of assays in a clinical laboratory are accredited by an accreditation body to the standards outlined in ISO15189:2012 to ensure the quality of results. However, even in laboratories adhering to ISO15189:2012, many will not have HIL within their scope of accreditation, meaning these vital parameters may not be subject to the same quality standards as other analytes. Given the difference between platforms in how HIL are quantified, there is much scope for variation of practice between laboratories in how HIL are measured, quality controlled, utilised, and managed.
Materials and methods
A survey of current practices concerning HIL in clinical chemistry laboratories in the UK and ROI was emailed to all members of the Association for Clinical Biochemistry and Laboratory Medicine (ACB), the Association of Clinical Biochemists in Ireland (ACBI), and the Academy of Clinical Science and Laboratory Medicine (ACSLM). The survey aimed to capture the heterogeneity of practice across UK and ROI medical laboratories regarding HIL detection.
The survey comprised 57 questions and included a collection of multiple-choice, rating scale, and open-ended questions and was designed on the SurveyMonkey platform. The survey gathered data in the following categories: details of participating laboratories; interference monitored; procedures for detecting HIL; HIL cut-offs used; how HIL indices were monitored; internal quality control (IQC) and external quality assurance (EQA) procedures for HIL; management of cross-reactivity between H, I, and L; and opinions on the responsibilities of assay platform manufacturers in relation to HIL.
The survey was anonymous and open for responses for 6 weeks from 14 June 2018. Data were manipulated in Microsoft Excel, and responses were summarised using simple descriptive statistics. Where a specific factor, such as respondent country, was observed to influence the responses to a given question, a sub-analysis of that question by the factor of interest was performed.
A copy of the survey as distributed is included in Supplemental File 1. In this study, results are grouped and discussed by topic rather than in the order in which the question appeared in the survey. Tables and figures are arranged similarly. Questions, responses, tables, and graphs refer to “Primary Questions” and “Secondary Questions” in the text. Secondary questions are those that were reflexed based on answers to primary questions. Where questions elicited individual responses from laboratories, these are presented in Supplemental tables and referenced appropriately in the text. The notation used in the results section gives each question’s response rate (RR) and the question number (Q) in subscript. Responses accounting for <10% of the total responses for a given question appear in tables and figures but are generally not discussed in the text.
Results
Participating laboratories’ details
A total of 197 responses were received for the survey, of which 73 were excluded as they gave answers to Q1 only. Thus, 124 responses were included and are discussed here and from this group. Each primary question was answered by >85% of laboratories included in the study. The response rates for each question in the survey are summarised in Supplemental Figure 1.
Responses for Q1-9 are summarised in Supplemental Table 1. Response by country was as follows: England (52%), ROI (36%), Scotland (7%), Wales (2%), and Northern Ireland (2%) Q1:RR = 124 and 90% of respondents worked in public hospitals Q2:RR = 124. Various laboratory professionals completed the survey, most commonly Clinical Scientists, Clinical Biochemists, and Medical Scientists, and at grades varying from trainee or basic grade, to Senior Manager and Consultant grade Q3:RR = 124.
Most responding laboratories (58%) process between 1001 and 5000 samples per day Q4:RR = 124, and the majority (90%) provide clinical biochemistry services as well as services including Point-of-Care Testing (62%), Haematology (59%), Coagulation (55%), Toxicology and Therapeutic Drug Monitoring (50%), Immunology (42%), Microbiology (38%), and Molecular Biology (15%) Q5:RR = 124. More than half of the participants (55%) analyse more samples from primary care than hospital care (inpatients or outpatients) Q6:RR = 117. Accreditation was in place at 89% of the laboratories at the time of the survey Q7:RR = 124, and of these, 92% were accredited to ISO15182:2012 Q8:RR = 110. In laboratories with no accreditation (11%), a lack of governance and staff shortages were the main explanations provided Q9:RR = 13. The proportion of laboratories with accreditation, and also the standards to which they were accredited, varied by country, with the ROI having the lowest proportion of laboratories accredited to ISO15189:2012 (65%), and the greatest proportion of unaccredited laboratories (22%) amongst responding countries (Supplemental Figure 2).
Laboratory procedures for monitoring Haemolysis, Icterus and Lipaemia in serum
Interferences monitoring details. For each questions, responses are given as absolute values and percentages. The response rate (RR) is presented for each question and cascading questions are indicated, stating the question from which they follow-on.
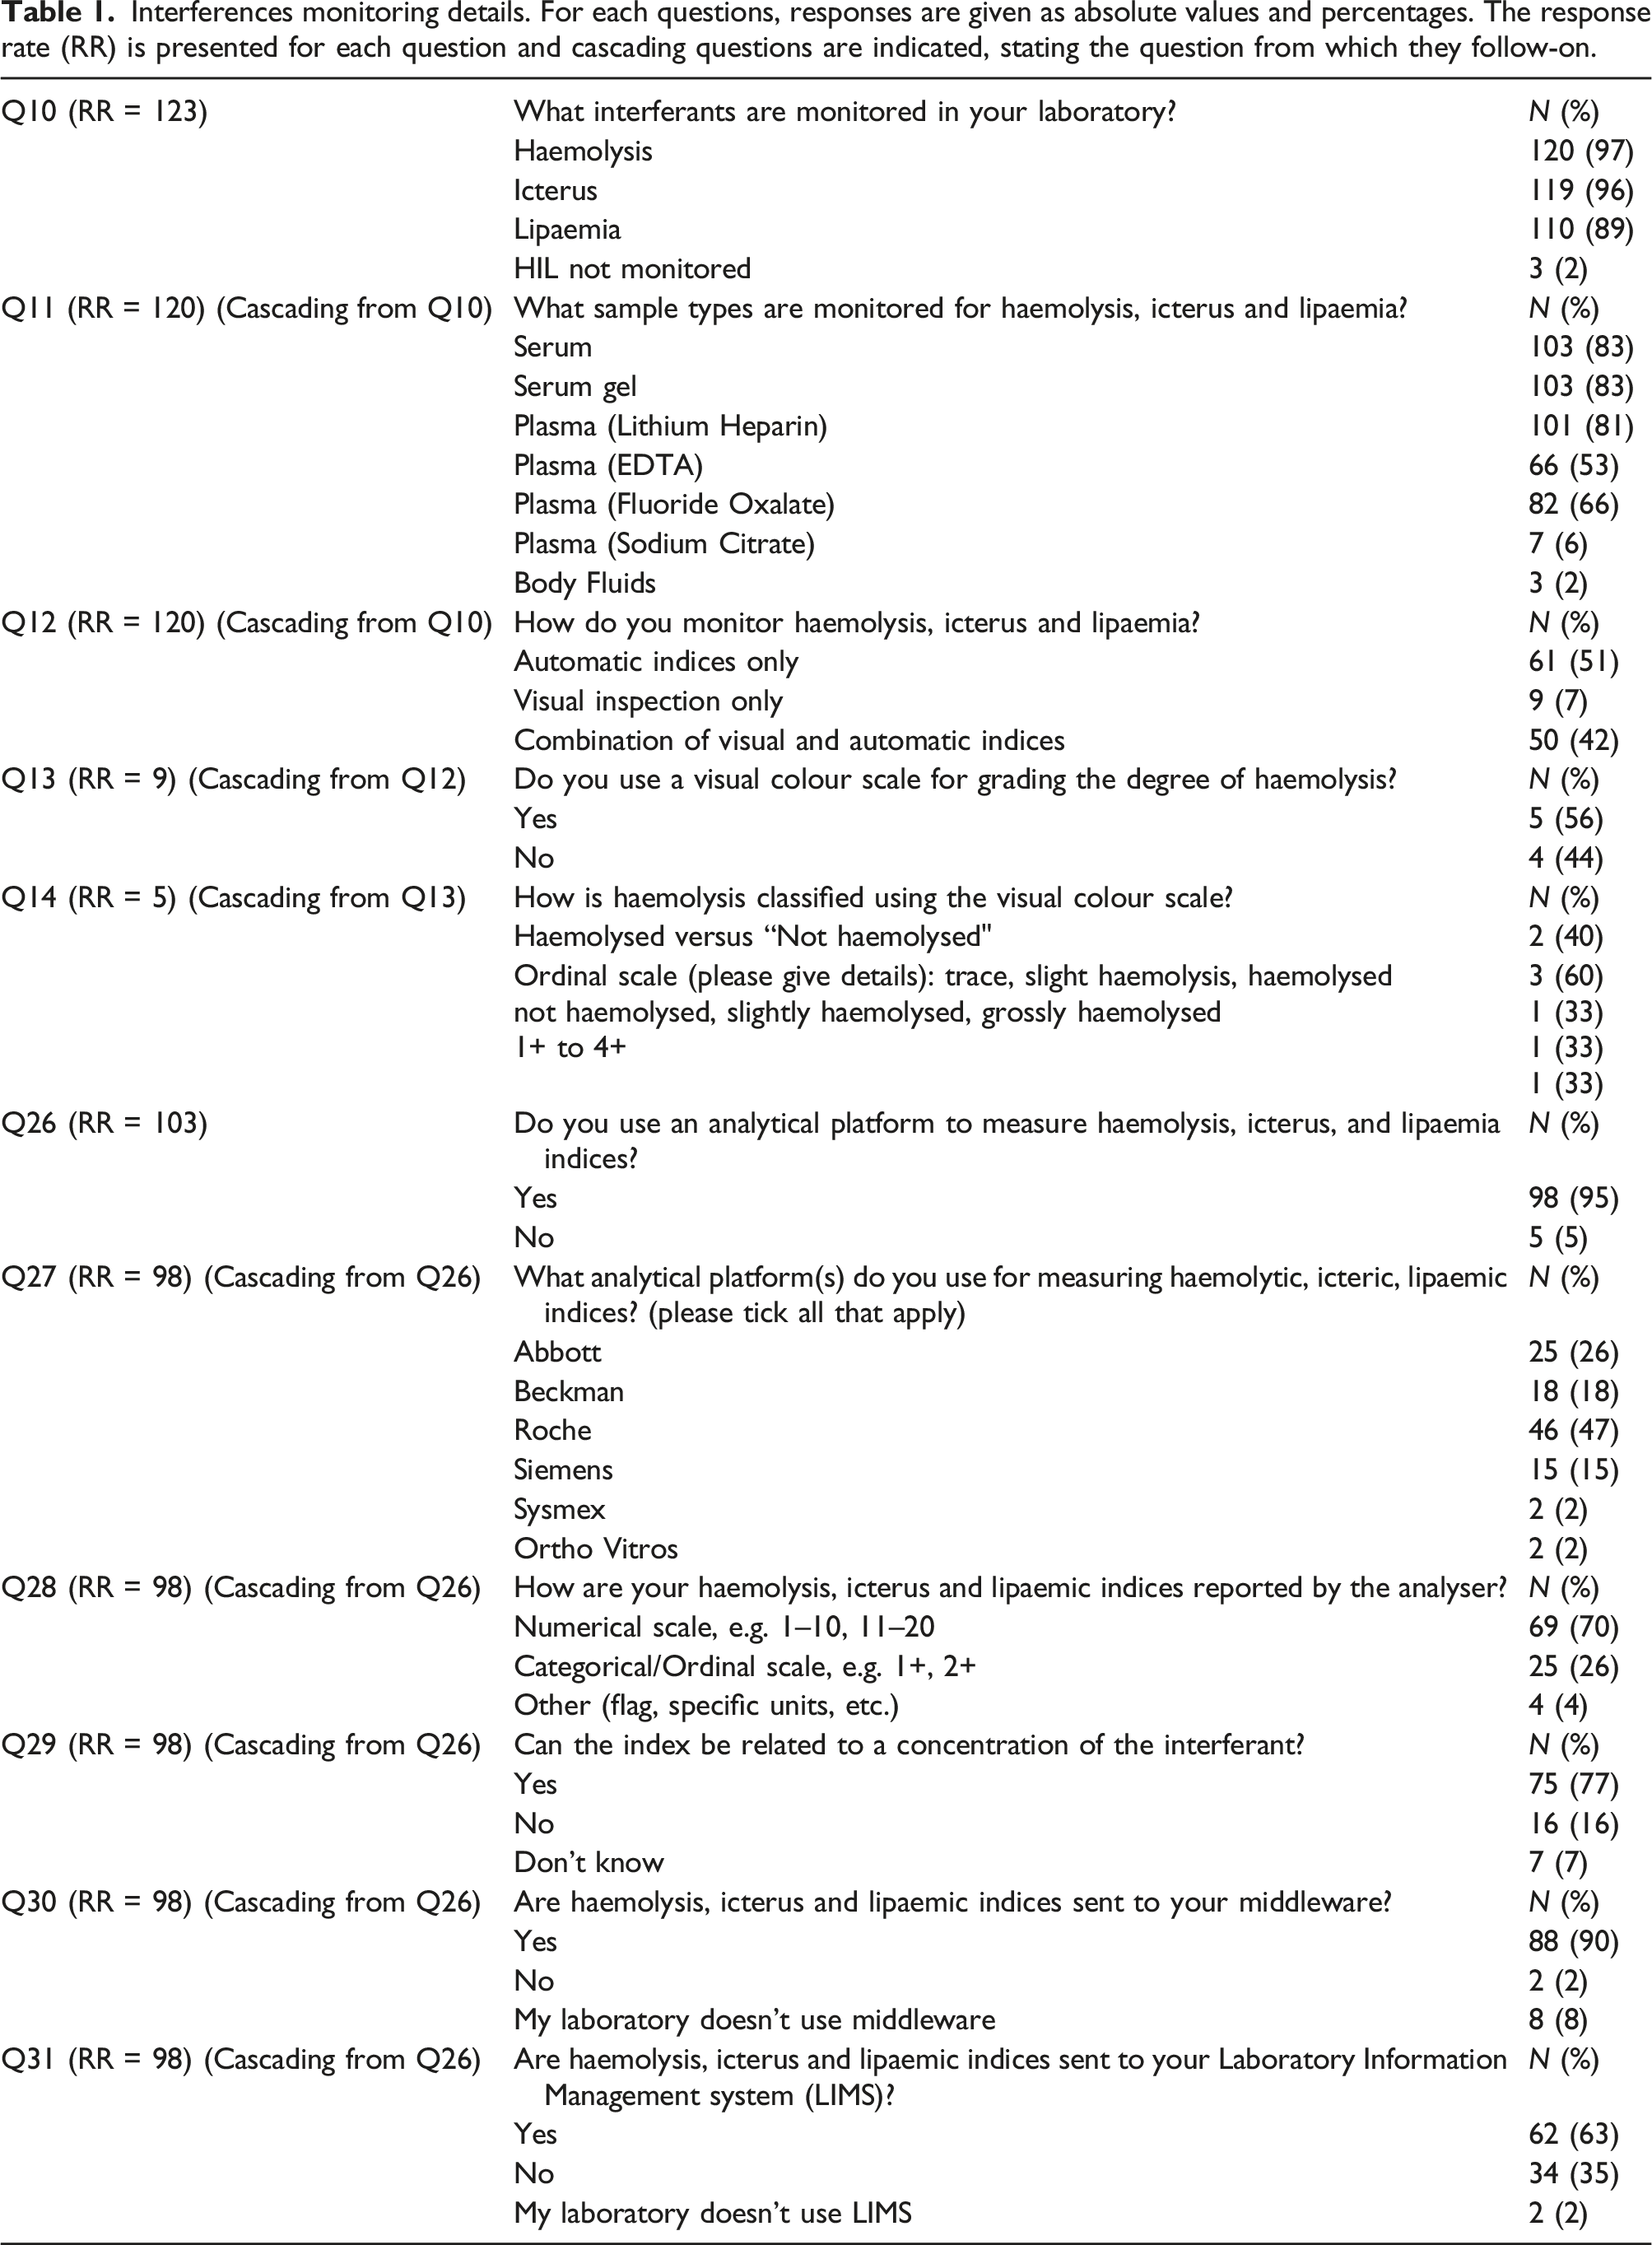
When giving details for the detection method used for HIL, 51% stated they exclusively used automated indices, 42% used a combination of visual inspection and automatic indices, while 7% used visual inspection alone Q12:RR = 120. Differences were observed between countries in how they monitor HIL, with eight ROI laboratories and one English laboratory using visual inspection alone (Figure 1). Of the nine laboratories using visual inspection alone to detect haemolysis, five use a visual colour scale to grade the degree of haemolysis Q13:RR = 9. Of these, two laboratories report results as either “haemolysed” or “non-haemolysed”, while three laboratories provide more information using an ordinal scale (“1+” to “4+”, “slightly-mild” or “severely haemolysed”) Q14:RR = 5. Laboratory procedures for monitoring HIL. Data were compiled using responses from questions 1 and 12 and represents 120 laboratories.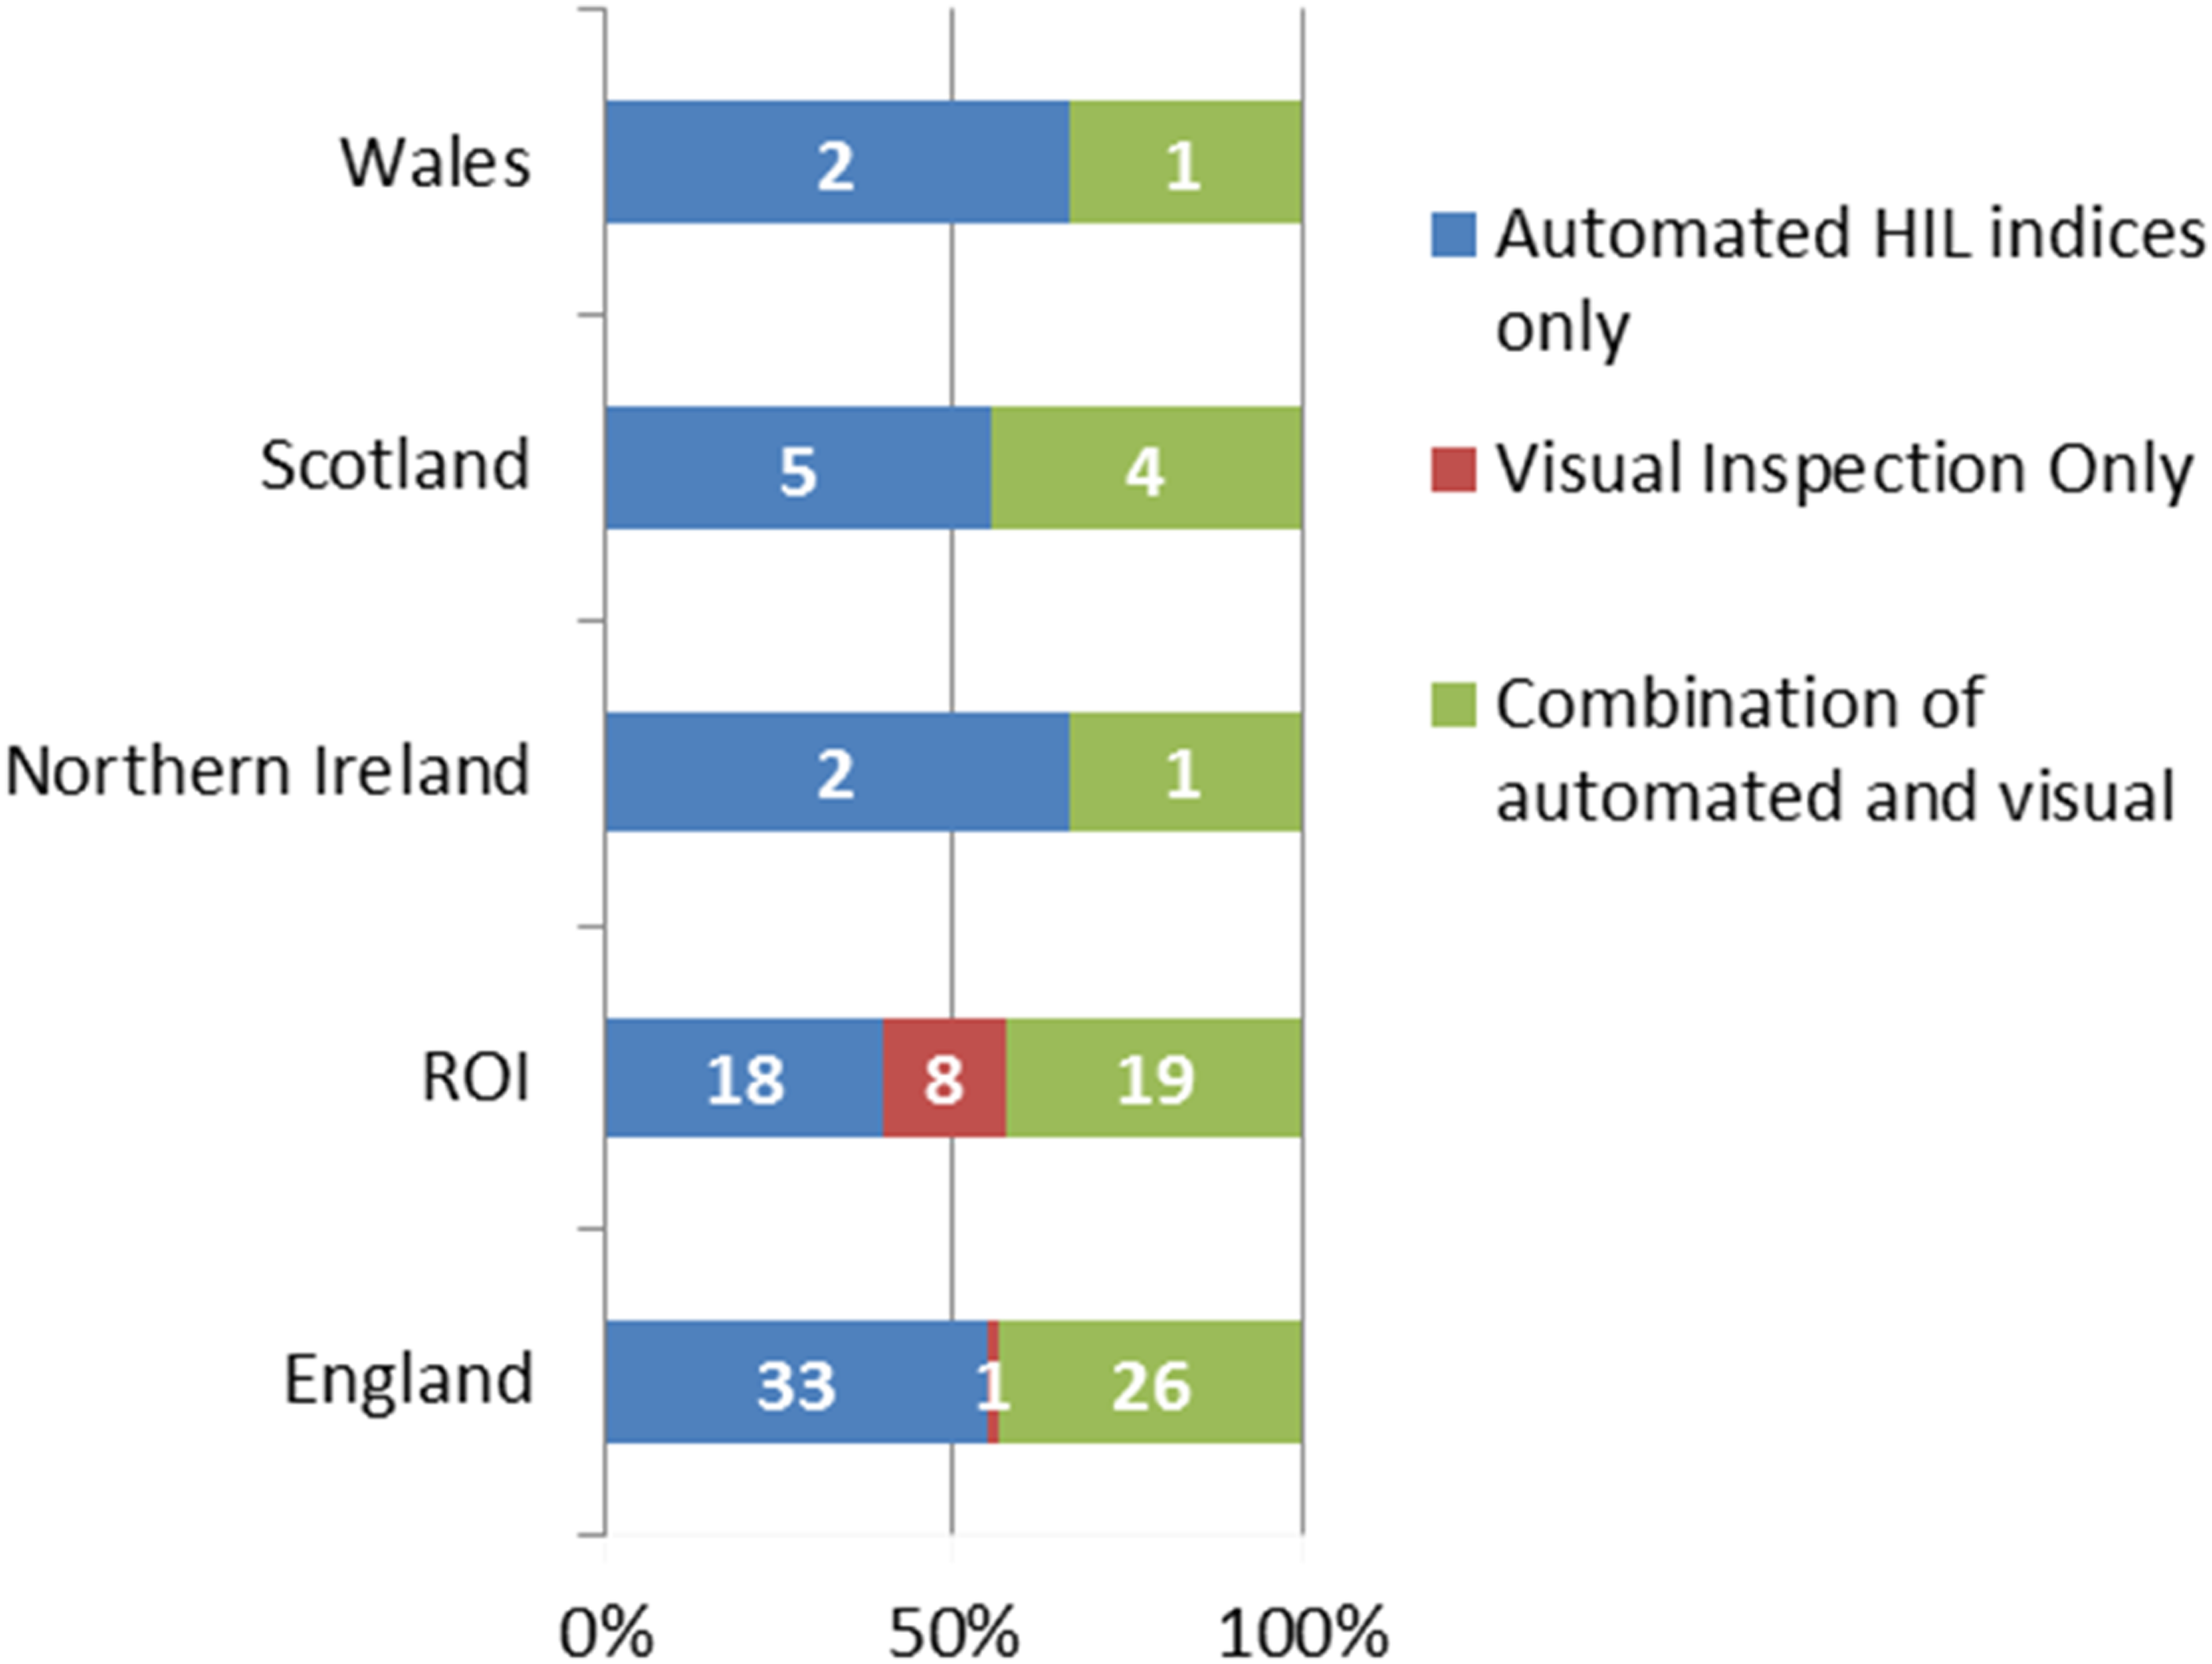
Analytical platforms were used to measure HIL by 95% of respondents Q26:RR = 103, either solely or in combination with visual inspection, and most commonly on the following platforms: Roche (47%); Abbott (26%); Beckman Coulter (18%); and Siemens (15%), with some laboratories using more than one platform Q27:RR = 98. Among those laboratories using automated platforms for measuring HIL, serum indices are reported using numerical scales in 70% of cases, and categorical/ordinal scales in 26% Q28:RR = 98 and index values can be related to a specific concentration of interferent in 77% Q29:RR = 98.
Of those laboratories using automated indices (either alone or in combination with visual inspection), 90% communicate HIL results to middleware Q30:RR = 98 and 63% to LIMS Q31:RR = 98 (Table 1); and 66% of the laboratories using a combination of automated and visual inspection communicate to middleware and 48% to LIMS. All participant countries, except Northern Ireland, predominantly communicate HIL results to both systems (Supplemental Figures 3 and 4).
Haemolysis, icterus and lipaemia interference cut-offs
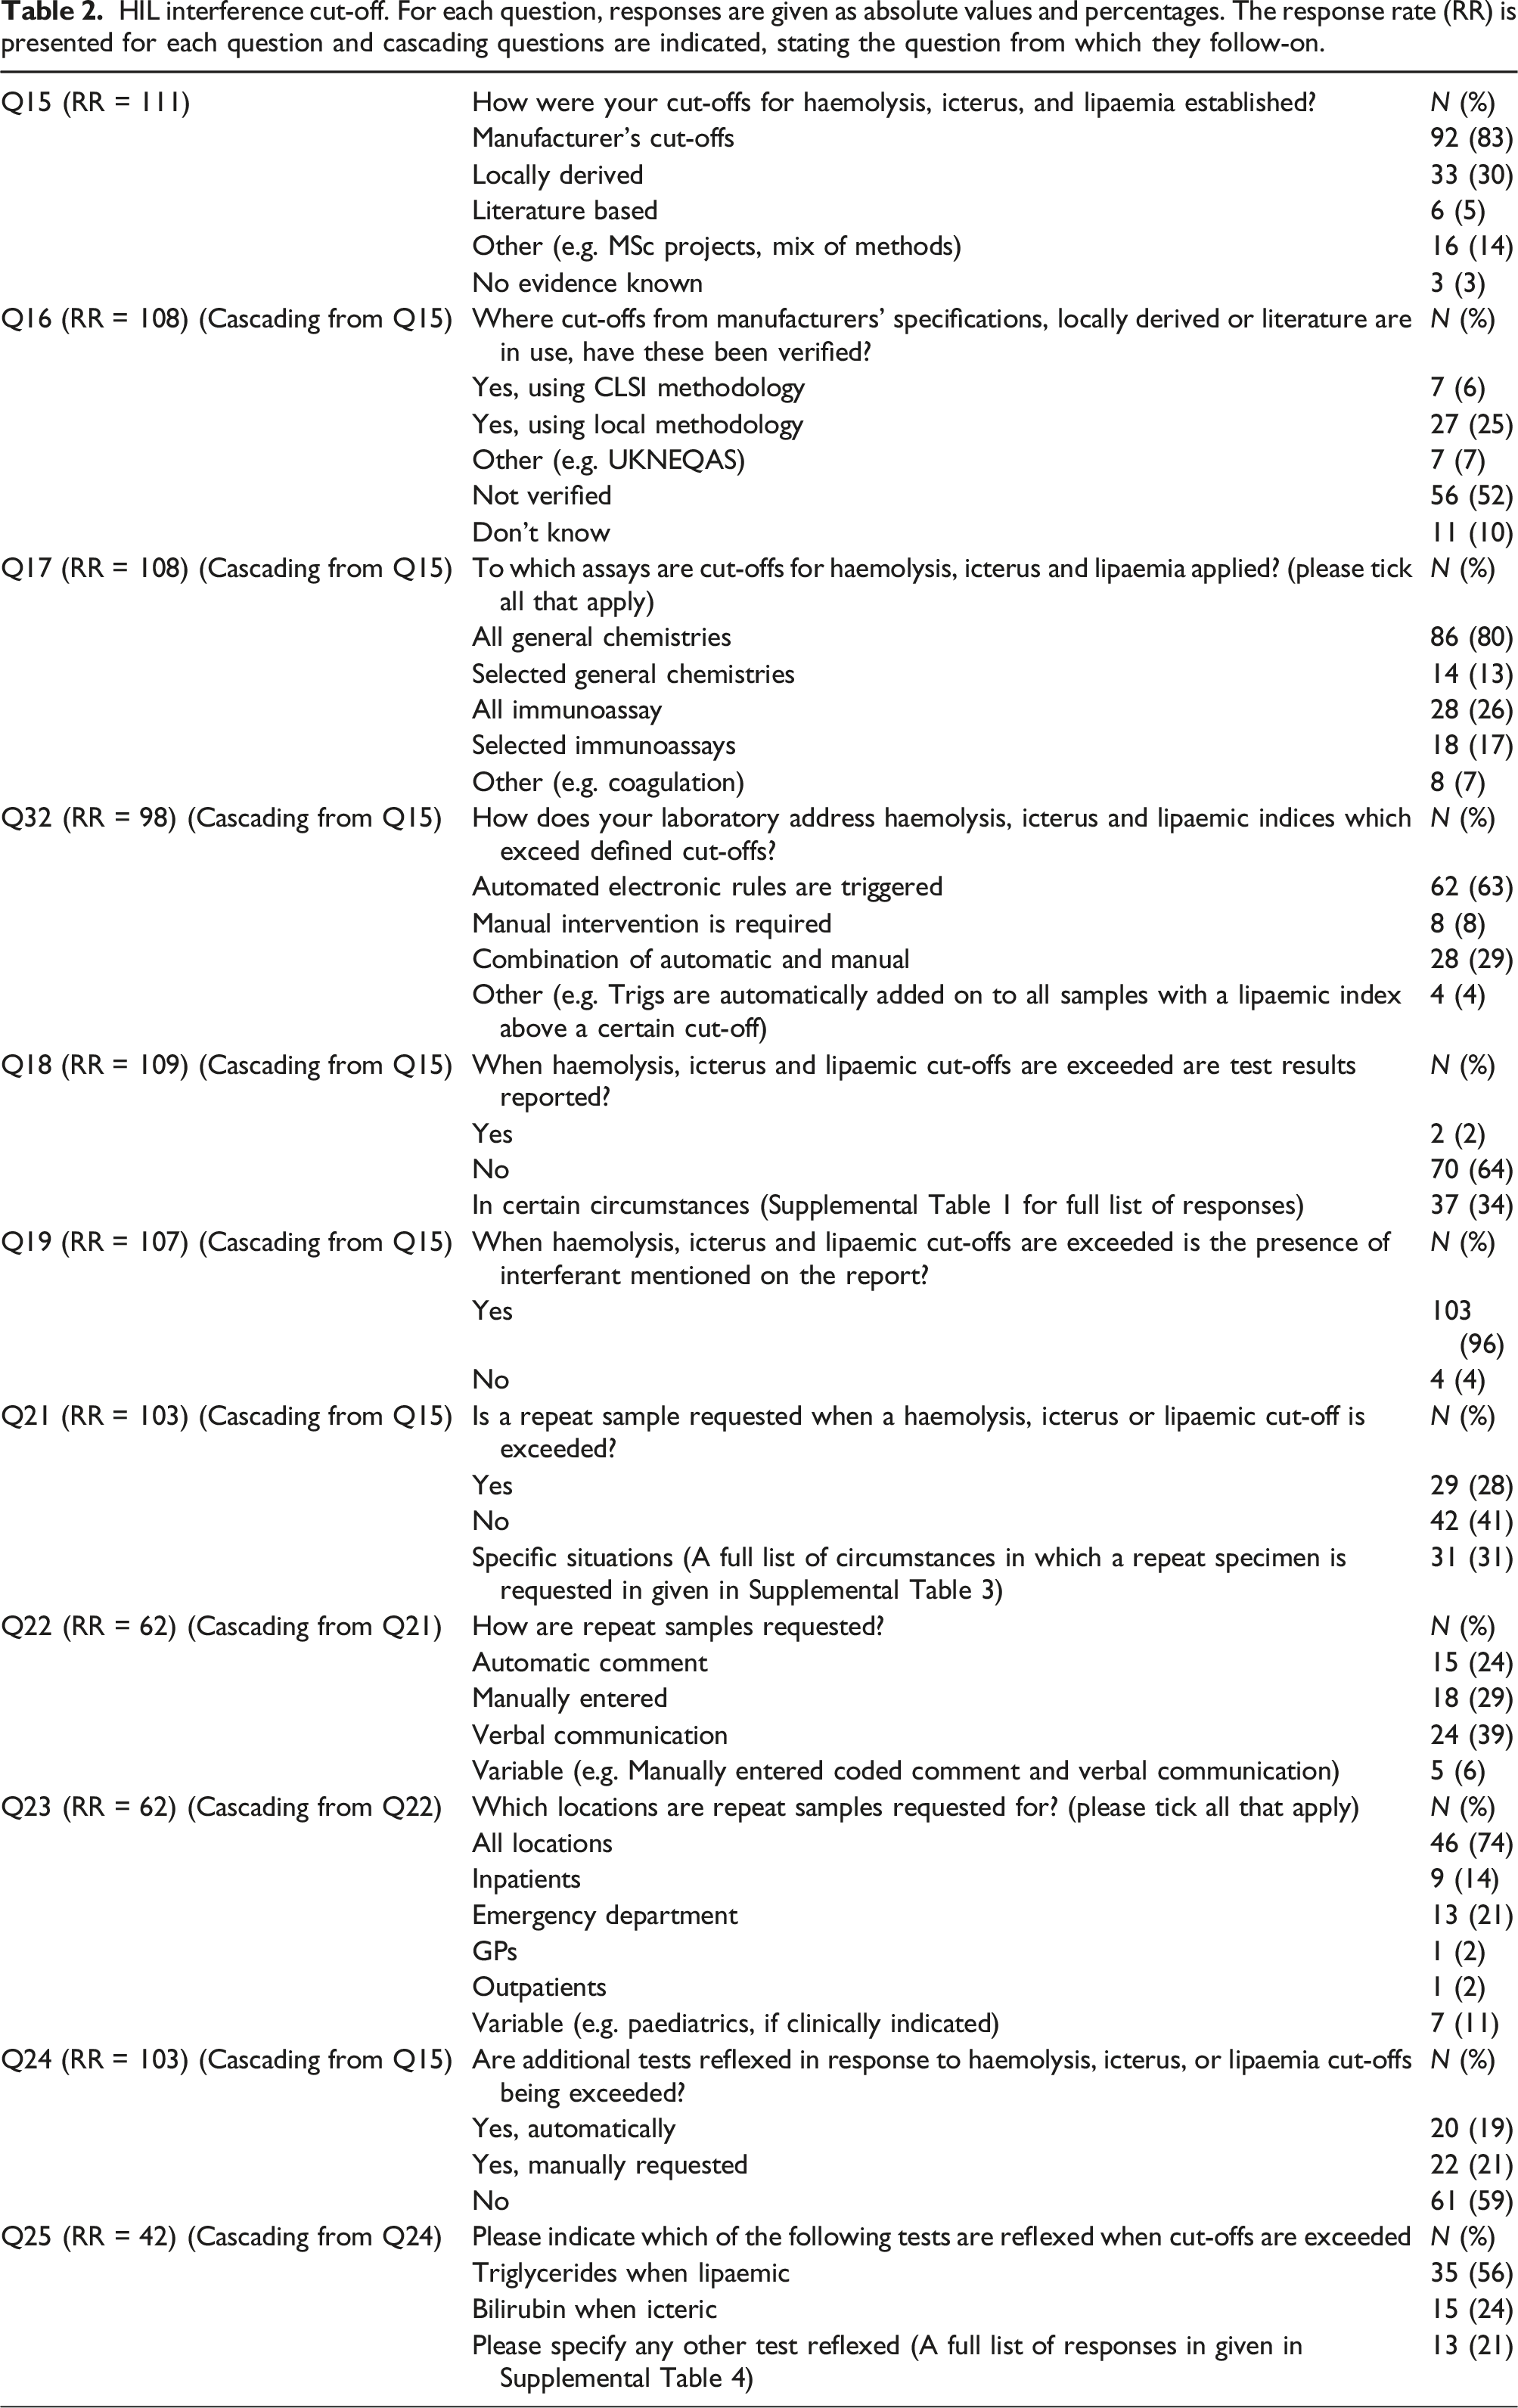
HIL interference cut-off. For each question, responses are given as absolute values and percentages. The response rate (RR) is presented for each question and cascading questions are indicated, stating the question from which they follow-on.
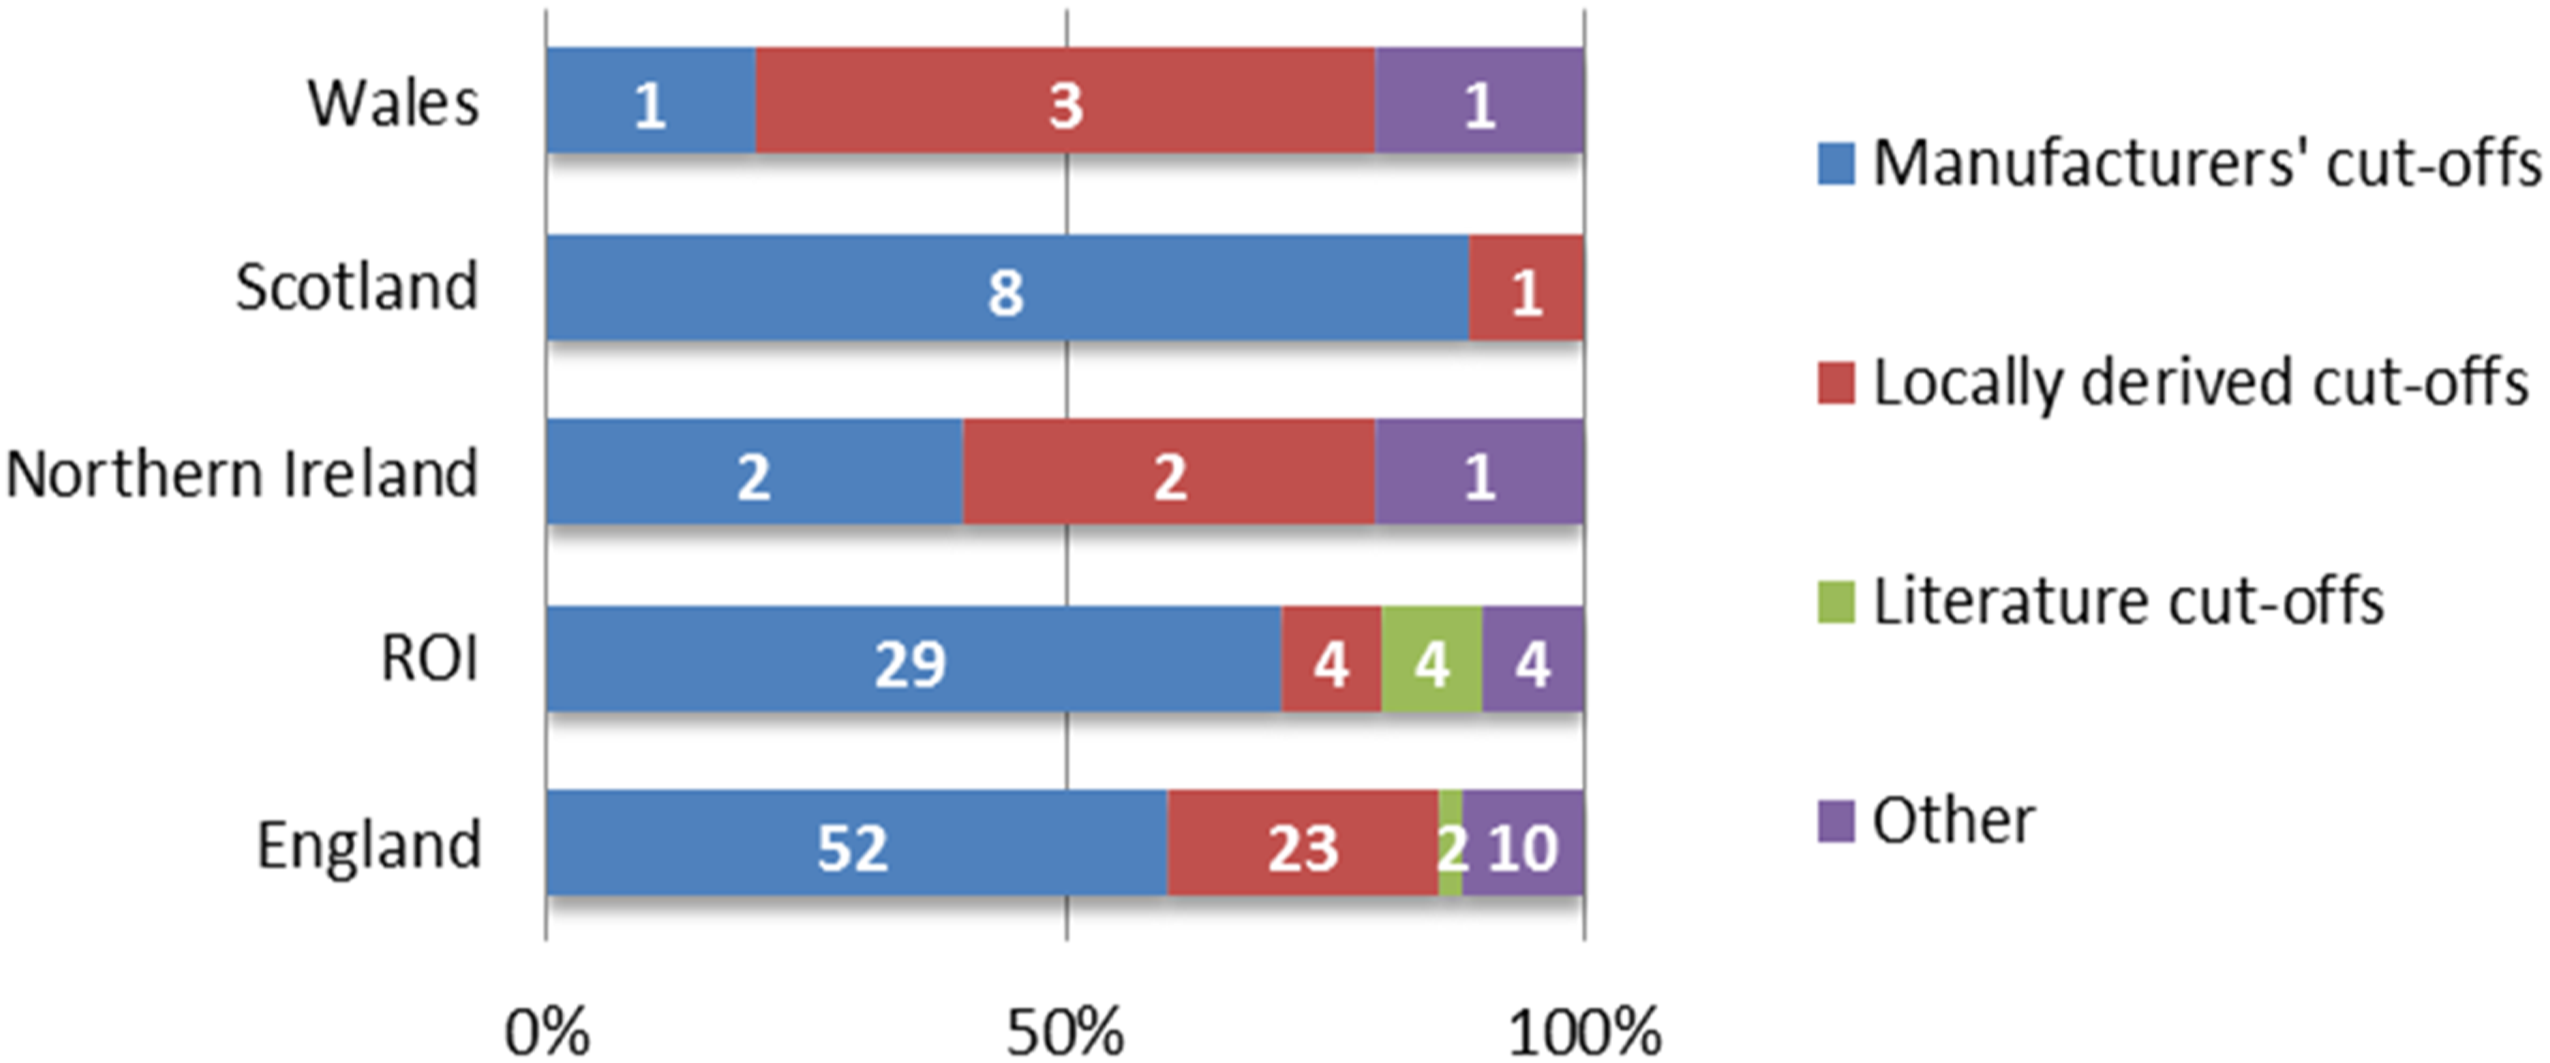
HIL cut-off evidence by country. Data were compiled using responses to questions 1 and 15 and represent data from 111 laboratories.
Respondents apply HIL cut-offs to all general chemistry assays (80%), selected general chemistries (13%), all immunoassays (26%), and selected immunoassays (17%) Q17:RR = 108.
When HIL cut-offs are exceeded, 63% of laboratories have automated software rules that are triggered, 8% apply manual intervention, and 29% use a combination of both procedures Q32:RR = 98.
When serum indices cut-offs are exceeded for a given analyte, results are not reported in 64% of laboratories, while in 34%, results are reported in certain circumstances (Supplemental Table 2) Q18:RR = 109. The majority of participants (96%) commented on the presence of an interferent on the final report Q19:RR = 107, but how this was reported varies considerably between laboratories (Supplemental Table 3) Q20:RR = 99.
When cut-offs for HIL are exceeded, 28% request a repeat sample, 41% do not, and 31% request a repeat analysis in certain circumstances (Supplemental Table 4); again, responses varied by country (Supplemental Figure 6) Q21:RR = 103. In laboratories that requested repeat analyses, the process is automatic in 24%, manual in 29%, and verbal in 39% Q22:RR = 62. In these same laboratories, repeat requests are made to all locations in 74%, the Emergency Department (ED) only in 21%, and inpatients only in 14% Q23:RR = 62.
Additional tests are reflexed in response to HIL in 41% of responding laboratories (20% automatically; 21% manually) Q24:RR = 103; within these laboratories, triglyceride is reflexed in response to lipaemia in 56%, bilirubin reflexed in response to icterus in 24%, with other reflexes applied as described in Supplemental Table 5 Q25:RR = 42.
Monitoring HIL indices
Monitoring HIL indices. For each question, responses are given as absolute values and percentages. The response rate (RR) is presented for each question and cascading questions are indicated, stating the question from which they follow-on.
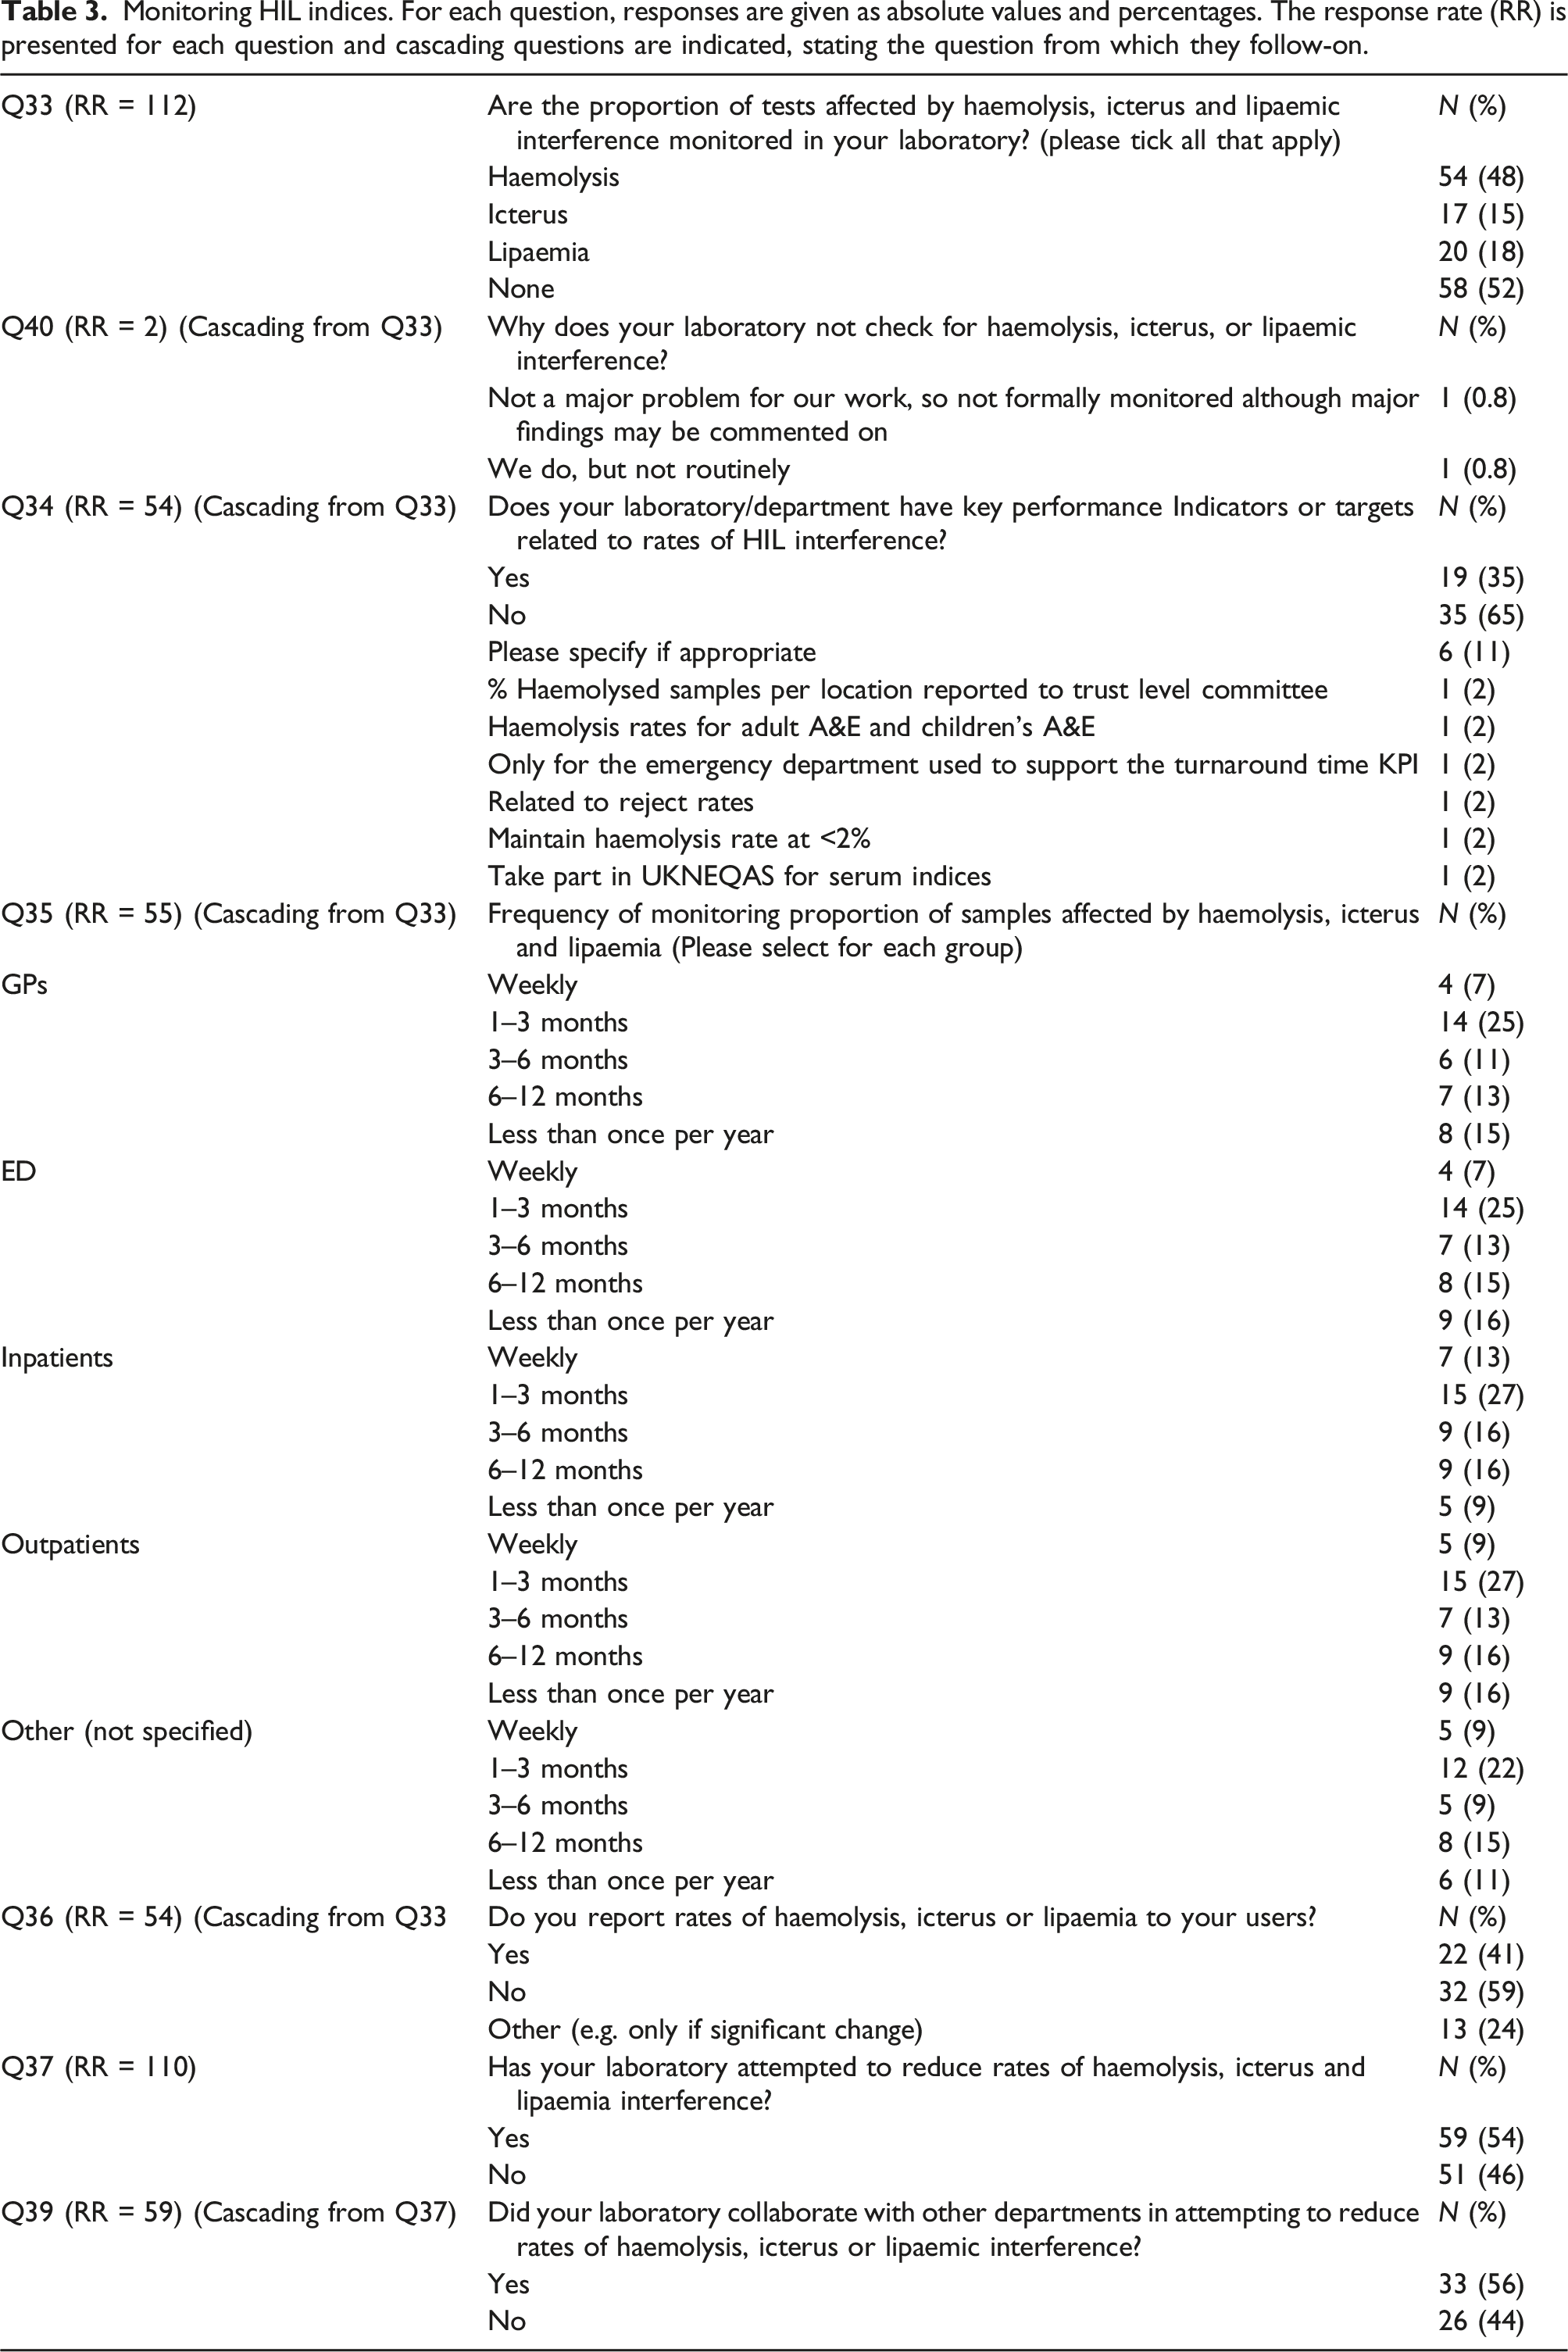
Of the laboratories that routinely monitor rates of HIL, associated key performance indicators are used by 35% of laboratories, are not used by 64%, and are used only in specific situations by 11% Q34:RR = 54.
In the laboratories routinely monitoring rates of HIL, locations that were examined included GPs (71%), ED (76%), Inpatients (82%), Outpatients (82%) and “Other” unspecified locations (66%) Q35:RR = 55. Figure 3 breaks down the different frequencies at which HIL rates are monitored in different requesting locations amongst responding laboratories. Rates of HIL are reported to users by 41% of respondents monitoring HIL rates, 24% report them under specific circumstances such as a significant change in frequency and 59% do not report them at all Q36:RR = 54. Amongst respondents monitoring rates of HIL, 54% have attempted to reduce HIL Q37:RR = 110, and 56% of these have collaborated with other departments to achieve this, most commonly with ED, wards and acute medical units Q3:RR = 59. Frequency of monitoring proportion of samples affected by haemolysis, icterus and lipaemia by requesting locations. Data were compiled using responses to questions 33 and 35 and represent responses from 55 laboratories.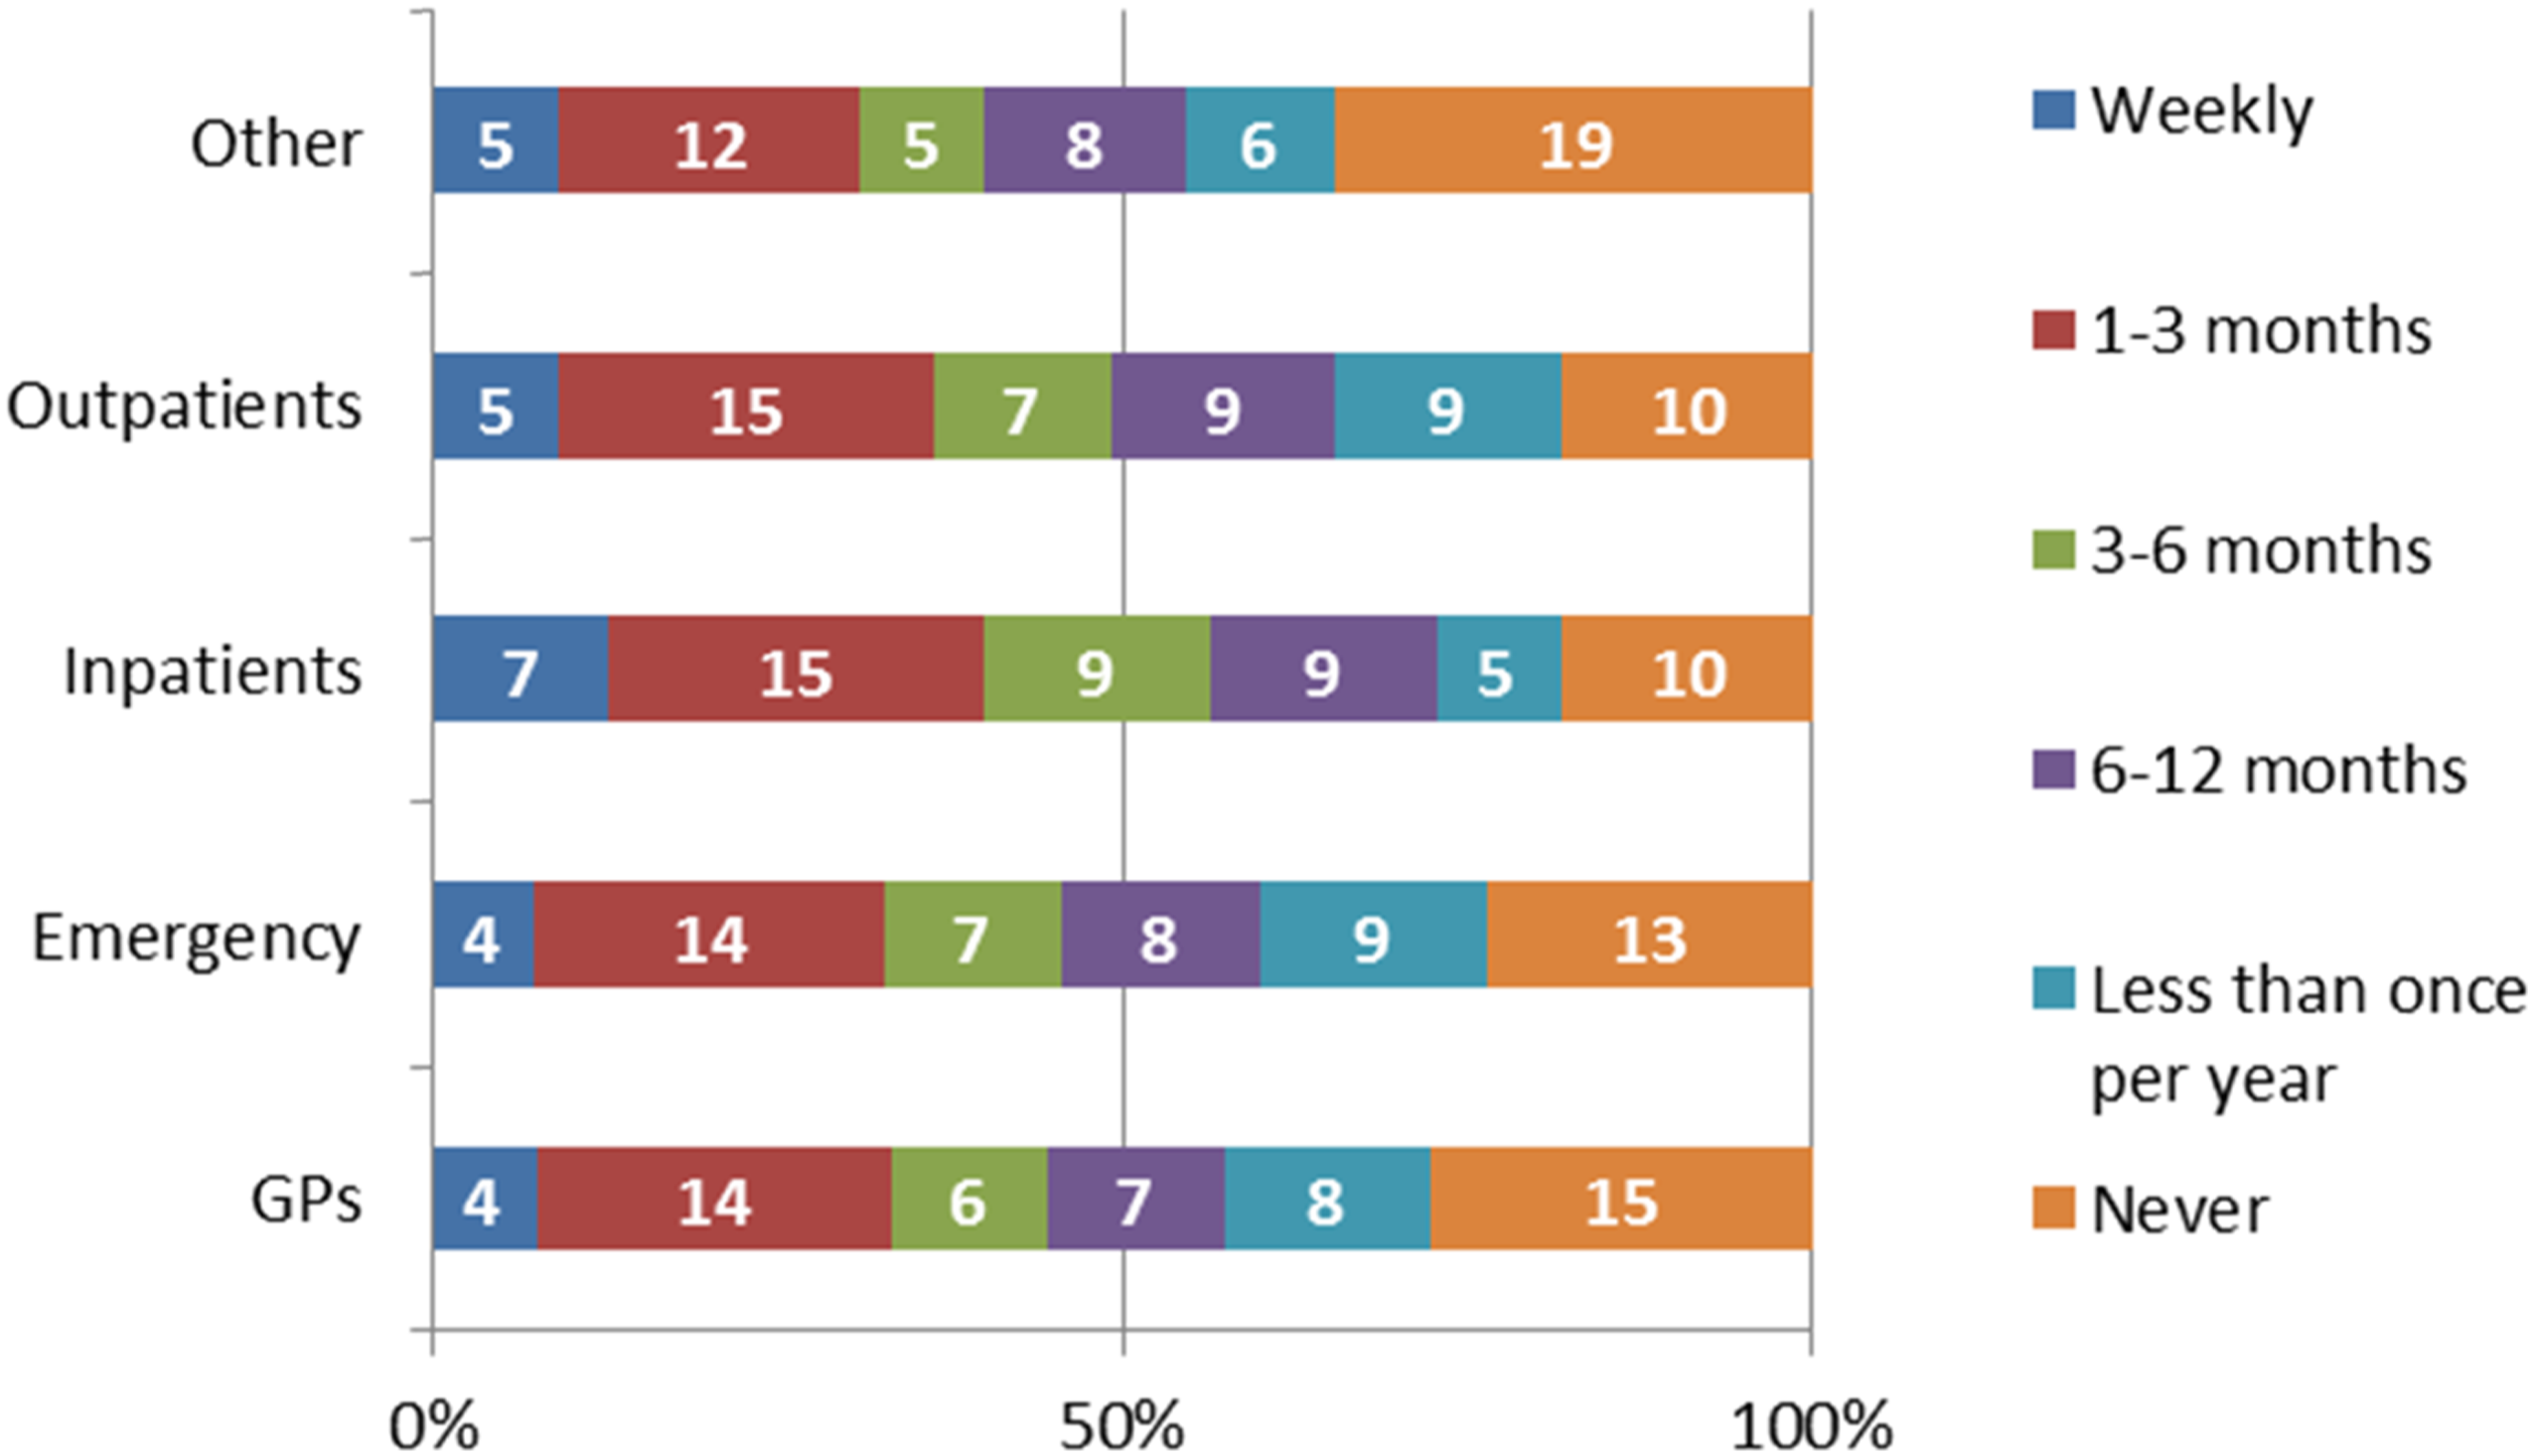
In this group of laboratories, strategies to reduce HIL rates included dialogue with departments most affected by HIL interferences (Supplemental Table 6) Q38:RR = 58.
Internal quality control (IQC) and external quality assurance (EQA) for HIL indices
Supplemental Table 7 contains responses to Q41-42, Q44-Q45, and Q47. Of responding laboratories, 37% perform IQC procedures with variable frequency Q41:RR = 108. From the 40 laboratories performing IQC procedures, 17 laboratories specified the material used and answers were as follows: commercial material (47%); materials produced and validated in-house (18%); patient-derived IQC material (6%); EQA material (6%) and 24% stated they are developing suitable material Q41:RR = 108.
Amongst those laboratories performing IQC, 76% of respondents stated that they find IQC for HIL useful, for various reasons Q42:RR = 42, while the remainder are dissatisfied for reasons described in Supplemental Table 8 Q43:RR = 10.
Of responding laboratories, 82% participate in EQA schemes for HIL, with monthly participation being most common (51%); 67% participating in NEQAS and 33% participating in the Welsh External Quality Assurance Scheme (WEQAS) serum indices schemes. The frequency of monitoring of EQA varied between countries, with more laboratories in ROI (36%) having never participated in EQA for HIL than any other country surveyed (Supplemental Figure 7) Q44:RR = 107. Of those participating in EQA, 12% stated that they did not find it useful Q45:RR = 88, and cited reasons including lack of information on scheme interpretation, difficulty with troubleshooting, and lack of clarity as to how poor performance should be investigated (Supplemental Table 9) Q46:RR = 11. From EQA scheme participants, 95% have never shown poor performance Q47:RR = 84.
Cross-reactivity of HIL interference
The potential for cross-reactivity between haemolysis, icterus and lipaemia was known to 66% of responding laboratories Q48:RR = 107, and a Standard Operating Procedure to deal with cross-reactivity of HIL is available in 30% of laboratories Q49:RR = 73. Cross-reactivity is manually checked by laboratory staff in 43% of laboratories Q50:RR = 73.
Manufacturers’ role in HIL detection
Supplemental Table 10 contains responses for Q51-57. Of responding laboratories, 59% felt that manufacturers do not provide enough information on HIL interferences Q51:RR = 107. The majority of participants (93%) believe that manufacturers should standardise how HIL indices are reported across platforms Q52:RR = 108, and of these, 17% provided suggestions on how this might be achieved (Supplemental Table 11) Q52:RR = 108. Similarly, 94% suggested that manufacturers should ensure HIL indices are comparable across platforms, and 8% provided suggestions on how this might be accomplished (Supplemental Table 12) Q53:RR = 108.
Among responding laboratories, 99% stated that manufacturers should provide information on cross-reactivity of HIL interference, while one participant specified that information on the direction and extent that HIL affects test results would be helpful Q54:RR = 108. In this same group, 99% would favour standardised, evidence-based cut-offs for H, I and L interference Q55:RR = 108, and 96% of responding laboratories thought these evidence-based cut-offs should be method-specific Q56:RR = 108.
Many laboratories (68%) would be willing to participate in a practical study on HIL interference to standardise the procedure across as many laboratories as possible Q57:RR = 108.
Discussion
Participating laboratories
Laboratories included in the analysis provided answers to most of the primary questions. However, it is not easy to accurately assess the overall response rate in this survey as the three associations, ACB, ACBI and ACLMS, that distributed the survey have overlapping membership. Of note, the majority of responses were received from England and the ROI. Therefore, the authors suggest the responses represent a large cross-section of the clinical laboratory community in England and the ROI. Responses from NI, Wales and Scotland were significantly smaller in number. The reasons for these low response rates are unclear but are not explained by country size. Thus, these findings may not be representative of the full range of practice in these countries. Respondents were primarily from public-funded hospitals, the majority of which provide biochemistry services, where systems for management of HIL are likely to be of most importance. Of interest, the ROI had the lowest proportion of respondents (less than two-thirds) of laboratories having accreditation to ISO15189:2012 and the greatest proportion (almost one quarter) of respondents unaccredited to any standard.
Monitoring of HIL
Most laboratories measure all three serum indices and apply these to all serum and plasma specimen types, with almost all responding laboratories monitoring haemolysis and lipaemia and slightly fewer monitoring icterus. The reasons why laboratories might be monitoring icterus with a lower frequency than haemolysis or lipaemia are unclear. It is most concerning that in 3% of modern laboratories that responded, none of the indices is monitored at all.
Most laboratories monitor HIL interference for a range of sample types, using a combination of automated and visual inspection, with over half using automated methods exclusively. Most laboratories report that they do not monitor HIL in non-lithium heparin plasma specimens. This is suboptimal practice since analytes measures in EDTA plasma and fluoride oxalate plasma may be subject to interference from HIL. Similarly, few laboratories report measurement of HIL in fluid samples. Depending on the fluid type, high concentrations of haemoglobin, lipid or bilirubin may be present. Since laboratories are likely to use similar methodologies for measuring analytes in fluid as in serum or plasma, interference from HIL should be considered when implementing such assays. Almost two-thirds of laboratories use a numerical scale for HIL, and in more than three-quarters, the index value could be related to interferent concentration. Overall, less than 10% of laboratories are using visual inspection only to detect HIL, although, in the ROI, this figure was 18%. It should be argued that in laboratories using modern analysers, it is unacceptable practice to determine either H, I or L by visual assessment alone,9,16,17 particularly since there can be difficulties distinguishing haemolysis and icterus visually. 18 Most laboratories transmit HIL results to their middleware, and approximately two-thirds send HIL results to their LIMS. Please note that the survey logic was such that laboratories using visual inspection only for HIL could not answer questions relating to transmission of HIL results via LIMS and middleware, and this should be considered a deficiency of the survey.
Haemolysis, icterus and lipaemia cut-offs
This survey found that most laboratories accept the manufacturers’ cut-offs for HIL, and less than half of respondents stated that these cut-offs had been verified. The survey did not ask why laboratories did not verify the cut-offs they use for HIL. In most cases, cut-offs are applied to general chemistries, but a significantly lower proportion, just over one quarter, of laboratories, applied HIL cut-offs to immunoassays. Currently, immunoassay platforms cannot measure HIL, and laboratories will need to quantify these indices on a separate analyser. This practical procedure, along with linking the HIL results with the immunoassay results, either manually, in laboratory middleware, or a LIMS, is inconvenient in modern high-throughput laboratories. The authors suggest that the availability of HIL indices on immunoassay platforms would improve practice in this regard and prevent the reporting of immunoassay results potentially erroneous due to the presence of haemolysis, icterus or lipaemia. In this survey, the term ‘General chemistry’ is understood to refer to any analysis by ion-selective electrode, turbidimetry and colourimetry on autoanalyser platforms. HIL cut-offs must be applied to all appropriate analyses in the medical laboratory. Haemolysis is well known to interfere with troponin analysis, 19 but other studies have also shown overestimation of TSH due to haemolysis. 20
Two-thirds of laboratories do not report analyte results at all where HIL cut-offs are exceeded, while most other laboratories state they report them in specific situations. Most laboratories report the presence of the interferent on the final report, and almost all of these refer to the presence of the interference without providing numerical or ordinal values for HIL. In addition, most of these laboratories do not routinely request a repeat specimen. There was a greater level of reflexing of triglyceride measurement in lipaemic samples than bilirubin in icteric samples. Although the correlation between lipaemia and triglyceride concentration is somewhat unreliable, a high lipaemic index, followed by triglyceride measurement, can identify patients who may be at risk of acute pancreatitis. 21 Similarly, knowledge of the actual bilirubin concentration in a sample allows the laboratory to perform accurate dilutions so that bilirubin is diluted out and other analytes, such as creatinine (e.g. where decreased renal function is suspected), can be more accurately measured.
Management and monitoring of HIL
Almost half of responding laboratories monitor the frequency of haemolysis in their service, with a much lower rate monitoring rates of icterus and lipaemia. It appears that where HIL rates are monitored, this monitoring is applied to all requesting locations. However, in most laboratories, the monitoring of HIL frequency is not determined using KPIs. Over half of laboratories stated that they have attempted to reduce the rates of HIL at their hospital. It is perhaps unsurprising that laboratories have most commonly worked to reduce HIL in ED, intensive care unit (ICU) and other acute areas, given that these locations are often associated with poor sample quality.
Steps taken to reduce interference included training and education relating to phlebotomy techniques, discussion with ED staff, audit review and centrifugation by GPs. These types of quality improvement are effective in previous surveys, with retraining, reporting haemolysis interference data to clinical leads, and specifically targeting problem areas, proving particularly successful. 22
IQC and EQA for HIL
Just under half of the laboratories surveyed perform IQC for HIL indices, half of which use commercially available material. Of those running IQC, strikingly, half are dissatisfied with their IQC process.
More laboratories (over 80%) are enrolled in EQA schemes for HIL, although with varying frequencies of participation. Most report never having experienced poor EQA performance and report not finding the schemes particularly useful.
Cross-reactivity and Manufacturers’ responsibilities
Over half of respondents thought manufacturers do not provide enough information about HIL. One-third of respondents were unaware of the cross-reactivity between the different indices. The clear majority of respondents thought manufacturers should standardise how HIL are reported across platforms. The hopes of Glick et al., nearly 30 years ago, for the “development of accurate electronic methods to identify and reject samples with these interferents or, preferably, on the development of instrument and reagent combinations that are not affected by these interferents” 23 is still the hope. Clearly, manufacturers need to standardise interference testing, units of measurement and measurement scales. Laboratory staff need to verify manufacturers claims proactively and have an increased awareness of the limitations of serum indices detection systems.
Conclusions
Haemolysis, icterus and lipaemia are an important source of analytical error in the Medical Laboratory. Robust and standardised strategies are required to minimise the impact of this preanalytical error on patient results and, ultimately, patient care. Laboratories need to detect and measure these interferents to assess their impact on test results. HIL automatic detection systems are widely available, yet there is still a reliance on visual assessment in many centres. Manufacturers certainly have a role in standardising units and measurement scales used to assess serum indices and ultimately improving the quality of HIL detection systems. While the laboratory medicine community should look to manufacturers to standardise their procedures, laboratories must also examine their own procedures. This survey identified significant variability in how laboratories deal with HIL, and accreditation bodies appear to tolerate this diversity in practice. Excellent guidelines exist for the management of HIL in clinical laboratories and the ACB, alongside other professional bodies, have a responsibility to promote these to their membership.
Supplemental Material
sj-pdf-1-acb-10.1177_00045632211059755 – Supplemental Material for A survey of practice in the management of haemolysis, icterus and lipaemia in blood specimens in the United Kingdom and Republic of Ireland
Supplemental Material, sj-pdf-1-acb-10.1177_00045632211059755 for A survey of practice in the management of haemolysis, icterus and lipaemia in blood specimens in the United Kingdom and Republic of Ireland by SJ Costelloe, N Rico Rios, N Goulding, H Mistry, A Stretton, B De la Salle, S Hepburn, A Thomas, J Atherton and M Cornes in Annals of Clinical Biochemistry
Supplemental Material
sj-pdf-2-acb-10.1177_00045632211059755 – Supplemental Material for A survey of practice in the management of haemolysis, icterus and lipaemia in blood specimens in the United Kingdom and Republic of Ireland
Supplemental Material, sj-pdf-2-acb-10.1177_00045632211059755 for A survey of practice in the management of haemolysis, icterus and lipaemia in blood specimens in the United Kingdom and Republic of Ireland by SJ Costelloe, N Rico Rios, N Goulding, H Mistry, A Stretton, B De la Salle, S Hepburn, A Thomas, J Atherton and M Cornes in Annals of Clinical Biochemistry
Supplemental Material
sj-pdf-3-acb-10.1177_00045632211059755 – Supplemental Material for A survey of practice in the management of haemolysis, icterus and lipaemia in blood specimens in the United Kingdom and Republic of Ireland
Supplemental Material, sj-pdf-3-acb-10.1177_00045632211059755 for A survey of practice in the management of haemolysis, icterus and lipaemia in blood specimens in the United Kingdom and Republic of Ireland by SJ Costelloe, N Rico Rios, N Goulding, H Mistry, A Stretton, B De la Salle, S Hepburn, A Thomas, J Atherton and M Cornes in Annals of Clinical Biochemistry
Footnotes
Declaration of conflicting interests
The author(s) declared no potential conflicts of interest with respect to the research, authorship, and/or publication of this article.
Funding
The author(s) received no financial support for the research, authorship, and/or publication of this article.
Ethical approval
Not applicable.
Guarantor
SC.
Contributorship
SC, MC, and NG conceived and designed the project, with input from all authors. SC, NR, and NG ran the statistical analyses and interpreted the results. SC, NR and NG compiled the manuscript. All authors reviewed the manuscript.
Supplemental material
Supplemental material for this article is available online.
References
Supplementary Material
Please find the following supplemental material available below.
For Open Access articles published under a Creative Commons License, all supplemental material carries the same license as the article it is associated with.
For non-Open Access articles published, all supplemental material carries a non-exclusive license, and permission requests for re-use of supplemental material or any part of supplemental material shall be sent directly to the copyright owner as specified in the copyright notice associated with the article.