
Abstract
Background
Pancreatic cyst fluid analysis plays an important role in distinguishing between mucinous and non-mucinous cyst lesions. We aimed to compare the diagnostic performances of cyst fluid carcinoembryonic antigen (CEA), CA 19-9, and glucose in differentiating mucinous from non-mucinous neoplastic pancreatic cystic lesions (PCLs) and determine the best cut-off levels.
Methods
Patients’ data were evaluated retrospectively. 102 patients’ PCLs were grouped as non-neoplastic (n = 25), non-mucinous neoplastic (n = 20), mucinous neoplastic (n = 47) and pancreatic adenocarcinomas with cystic degeneration (n = 10); and CEA, CA 19-9, and glucose levels were compared. Receiver-operating characteristic analysis was performed, and the ideal cut-off values were determined.
Results
Cyst fluid CEA and CA 19-9, levels were significantly higher (P < 0.001, P < 0.001, respectively) and glucose levels were significantly lower (P = 0.001) in mucinous than in non-mucinous neoplastic PCLs. Area under curve with 95% confidence interval of CEA, glucose and CEA and glucose test combination was 0.939 (95% CI = 0.885–0.993, P = 0.001), 0.809 (95% CI = 0.695–0.924, P < 0.001) and 0.937 (95% CI = 0.879–0.995), respectively. CEA cut-offs to rule-in and rule-out mucinous neoplastic were 135.1 ng/mL (sensitivity = 62%, specificity = 94.7%) and 6.12 ng/mL (sensitivity = 94.1%, specificity = 80.4%), respectively. Glucose cut-off of 2.8 mmol/L was chosen both to rule-in and rule-out mucinous neoplastic PCLs (sensitivity = 78%, specificity = 80%). Co-analysis of CEA and glucose to distinguish mucinous from non-mucinous neoplastic PCLs had sensitivity = 87.8%, specificity = 93.3%, and diagnostic accuracy = 89.3%.
Conclusions
We concluded that co-analysis of cyst fluid CEA (cut-off = 135.1 ng/mL) and glucose (cut-off = 2.8 mmol/L) at novel cut-offs had the best testing performance to rule-in mucinous neoplastic PCLs. To rule-out mucinous PCLs co-analysis of CEA (cut-off = 6.12 ng/mL) and glucose (cut-off = 2.8 mmol/L) added value to prediction.
Introduction
Pancreatic cystic lesions (PCLs) such as non-neoplastic cysts, cystic neoplasms and solid neoplasms containing cysts are often detected incidentally on routine abdominal ultrasound or cross-sectional imaging studies for unrelated reasons. 1 They comprise a clinically challenging situation as their biological behaviour ranges from benign to malignant disease. 2 As the clinicians have greater clinical awareness and the use of high-resolution cross-sectional imaging is widespread, even the small dimensional PCLs are increasingly diagnosed, but unfortunately, it is often challenging to differentiate between the various types of PCL. 3 Simple (retention) cysts, pseudocysts and serous cystadenomas (SCA) are benign PCLs but on the other hand, surgical therapy may be required because of malignancy potential of mucinous cystic neoplasms (MCNs) and intraductal papillary mucinous neoplasms (IPMNs). 4 Since there is a risk of malignancy in some PCLs, it is very important to determine the type of cystic lesions. Considering the different malignant potentials varying between 0% and 60%, benign cystic and pre/malignant cystic lesions, plus the mucinous and non-mucinous lesions should be distinguished. 5 Tests such as cyst fluid cytology, carcinoembryonic antigen (CEA), carbohydrate antigen 19-9 (CA 19-9), glucose and viscosity are widely applied in clinical practice. Studies have shown that cyst fluid CEA levels have the best diagnostic performance to differentiate mucinous from non-mucinous cysts. 6 Cyst fluid CA 19-9 is mostly preferred in the differential diagnosis of pancreatic cystic adenocarcinoma, but it provides limited diagnostic utilization for the differentiation of mucinous/non-mucinous PCLs.7,8 In recent years, pancreatic cyst fluid glucose levels have also been found to be important in differentiating mucinous and non-mucinous PCLs. 9 In this retrospective study, we aimed to compare the diagnostic performance of pancreatic cyst fluid CEA, CA 19-9 and glucose in differentiating mucinous from non-mucinous neoplastic PCLs and determine the best cut-off levels.
Materials and methods
Study group
In this single centre retrospective study, patients who were admitted to the Gastroenterology outpatient clinics between 1 January 2015, and 31 December 2019 were evaluated. All patients (n = 259) data who underwent endoscopic ultrasonography and fine needle aspiration (EUS-FNA) biopsy were evaluated.
Since EUS-FNA evaluations, imaging data (abdominal Magnetic Resonance Imaging [MRI], Computerized tomography [CT] or cholangiography), cystic fluid cytology (and other histopathological reports of pancreatic diseases, if any) and cystic fluid biochemical analysis results of only 102 patients were fully available; only these patients (n = 102) were included in the study. 157 patients with any missing imaging data, insufficient PCL fluid for laboratory analysis or unclassified cyst fluid cytology were excluded. Of these excluded data, 52 patients had non-diagnostic cytology and 39 had pauci-cellular cyst fluid or insufficient sampling and the rest had no imaging data.
Patients’ age, gender, symptoms associated with pancreas, medical history and other medical interventions were recorded. All patients’ pancreatic cyst fluid CEA, CA 19-9 and glucose concentrations were recorded from laboratory database.
The study was approved by the local ethical committee (study reference number: 20-3.1T/1) and was compliant with Helsinki Declaration (1975).
Based on pancreatic cyst cytology reports, surgical histopathology (if present) and imaging follow-up (until the end of 2019), PCLs were diagnosed as benign PCLs included simple cyst (n = 1), pseudocysts (n = 21), SCA (n = 16), cystic lymphangiomas (n = 3); and premalignant/malignant PCLs included MCN (n = 25), IPMN (n = 22), pancreatic adenocarcinomas with cystic degeneration (n = 10), cystic pancreatic neuroendocrine tumours (PNET) (n = 1), solid pseudopapillary neoplasm (SPN) (n = 1) and von Hippel Lindau Disease (vHL) (n = 2).
PCL types were grouped into four for data analysis as follows: non-neoplastic cysts (simple cysts, pseudocysts and cystic lymphangiomas) (n = 25), non-mucinous neoplastic cysts (SCA, PNET, SPN and vHL) (n = 20), mucinous neoplastic cysts (MCN and IPMN) (n = 47) or pancreatic adenocarcinomas with cystic degeneration (n = 10).
EUS-FNA
EUS-FNA has been performed according to the American Gastroenterological Association guidelines. 10 Two experienced gastroenterologists performed EUS and EUS-FNA (GF-UCT180 Curvilinear Array Ultrasound Gastrovideoscope, Olympus, PA, USA and Prosound Alpha 7 Hitachi Healthcare-Aloka, Japan). For FNA 22-Gauge (standard) or 19-Gauge needles (Boston Scientific, Natick, MA, USA) were used. Pancreatic cysts were characterized based on their localization, number, dimension/s, characteristic features (such as wall thickness, septation, communication with the pancreatic duct and calcification) and aspirated cystic fluid features (volume, colour and viscosity).
String-sign test
The presence of mucus in the pancreatic cyst fluid was easily detected with the string-sign test. Immediately after EUS-FNA, pancreatic fluid dripping from the EUS-FNA needle was examined. A positive string-sign was defined as formation of a string in the cyst fluid, measuring at least 1 cm in length and lasting for at least 1 s before disruption.
Imaging techniques
CT scan (HD 750 CT, General Electric, 2013, USA) and MRI/cholangiopancreatography (MRCP) (Verio 3T MRI, Siemens, 2011, Germany or Amira 1.5T, MRI, Siemens, 2018, Germany) were performed for identifying the specific type of PCLs.
Cytological analysis
For all pancreatic cyst specimens, liquid-based cytology (LBC) was performed. LBC samples were prepared using a ThinPrep5000 automated slide processor (Hologic, Marlborough, MA, USA) and were stained with Papanicolaou stain.
Biochemical analysis
Pancreatic cyst fluid CEA and CA 19-9 (Elecsys CEA and Elecsys CA 19-9, Roche Diagnostics GmbH, Mannheim, respectively) were measured by electrochemiluminescence immunoassay method. CEA and CA 19-9 results exceeding the upper limit of detection (CEA > 1000 ng/mL, CA 19-9 > 1000 U/mL) were automatically remeasured with 1:10 and 1:50 dilutions, respectively. Cyst fluid glucose concentrations were measured by hexokinase enzymatic assay (Gluco-quant Glucose/HK, Roche Diagnostics GmbH, Mannheim). All biochemical parameters were measured on Cobas® 6000 analyser series (Roche Diagnostics, Mannheim, Germany).
Clinical performance characteristics of biochemical tests: Definitions and calculations
Sensitivity was the ability of a biomarker to accurately determine mucinous neoplastic PCLs. Specificity was the ability of a biomarker to accurately exclude patients with no presence of mucinous neoplastic PCLs. Positive predictive value (PPV) was the probability that pancreatic cyst fluid with positive test truly had mucinous neoplastic PCL. Negative predictive value (NPV) was the probability that pancreatic cyst fluid with a negative test truly have not got mucinous neoplastic PCL. Diagnostic accuracy (DA) was expressed as a proportion of correctly classified cysts among all subjects. PPV was calculated by a/(a + b). NPV was calculated by d/(c + d). DA is calculated by (a + d)/(a + b + c + d). (a: mucinous neoplastic PCL with test positive; b: non-mucinous neoplastic PCL with test positive; c: mucinous neoplastic PCL with test negative; d: non-mucinous neoplastic PCL with test negative).
Statistical analysis
Statistical analysis was performed by Statistical Package for the Social Sciences (SPSS) 20.0 statistical package program (IBM SPSS Statistics for Windows, Version 20.0. NY, USA). The compatibility of variables to Gaussian distribution was examined in all groups using the Kolmogorov–Smirnov test. All groups showed non-gaussian distribution and non-parametric statistics was performed. The descriptive statistics were given in median (first and third quartiles), except age was given in mean ± SD. Variables were compared by Kruskal–Wallis test between the independent groups, and statistically significant parameters were compared with Mann–Whitney U test between two independent groups. Since there were very low numbers of simple cyst, cystic PNET, SPN, vHL and cystic lymphangioma, they were not included in the statistical comparisons of different diagnosis of cystic lesions; but all data are given. Two-tailed P value < 0.050 was considered as statistically significant. Spearman’s rho test was performed to investigate the relationship between biochemical parameters of pancreatic cyst fluid. Receiver-operating characteristic (ROC) curve analysis was applied for the pancreatic cyst fluid biochemical parameters to differentiate mucinous neoplastic cysts from non-mucinous neoplastic PCLs. The results were expressed as the area under the curve (AUC), 95% confidence interval (CI) for this area.
Results
Patient demographics and characteristics
102 patients enrolled in our study with a mean age of 57.5 ± 15.7 years. There were 39 (38.2%) male and 63 (61.8%) female subjects. According to patients’ data recordings, 65.7% of the patients (n = 67) had no clinical signs of pancreatic disease and PCLs were noticed incidentally by imaging. On the other hand, 35 patients (26 premalignant or malignant PCLs, 9 benign cysts) had various related symptoms such as abdominal pain, weight loss and jaundice. 15 patients had previous acute or chronic pancreatitis.
PCL characteristics and classifications
PCLs were localized in the pancreatic body (32%), tail (31%), head (26%) and uncinate (11%). Most of the patients had single PCL (n = 58), rather than multiple lesions. PCL localizations were similar between non-neoplastic, mucinous neoplastic, non-mucinous neoplastic and pancreatic adenocarcinomas with cystic degeneration (P > 0.050). Of the recorded, string-sign test was positive in 13 patients. In pseudocyst group, four of them had wall of necrosis, and three of them were infected and were abscessed. In IPMN group, 14 PCLs had branch type, five had main duct type and three had mixed-IPMN; and three of the PCLs were defined highly dysplastic. Three of the MCNs had high-grade dysplasia, one MCN had moderate and one had low-grade dysplasia.
Laboratory assessment
Demographical and biochemical data of all different types of pancreatic cyst lesions.
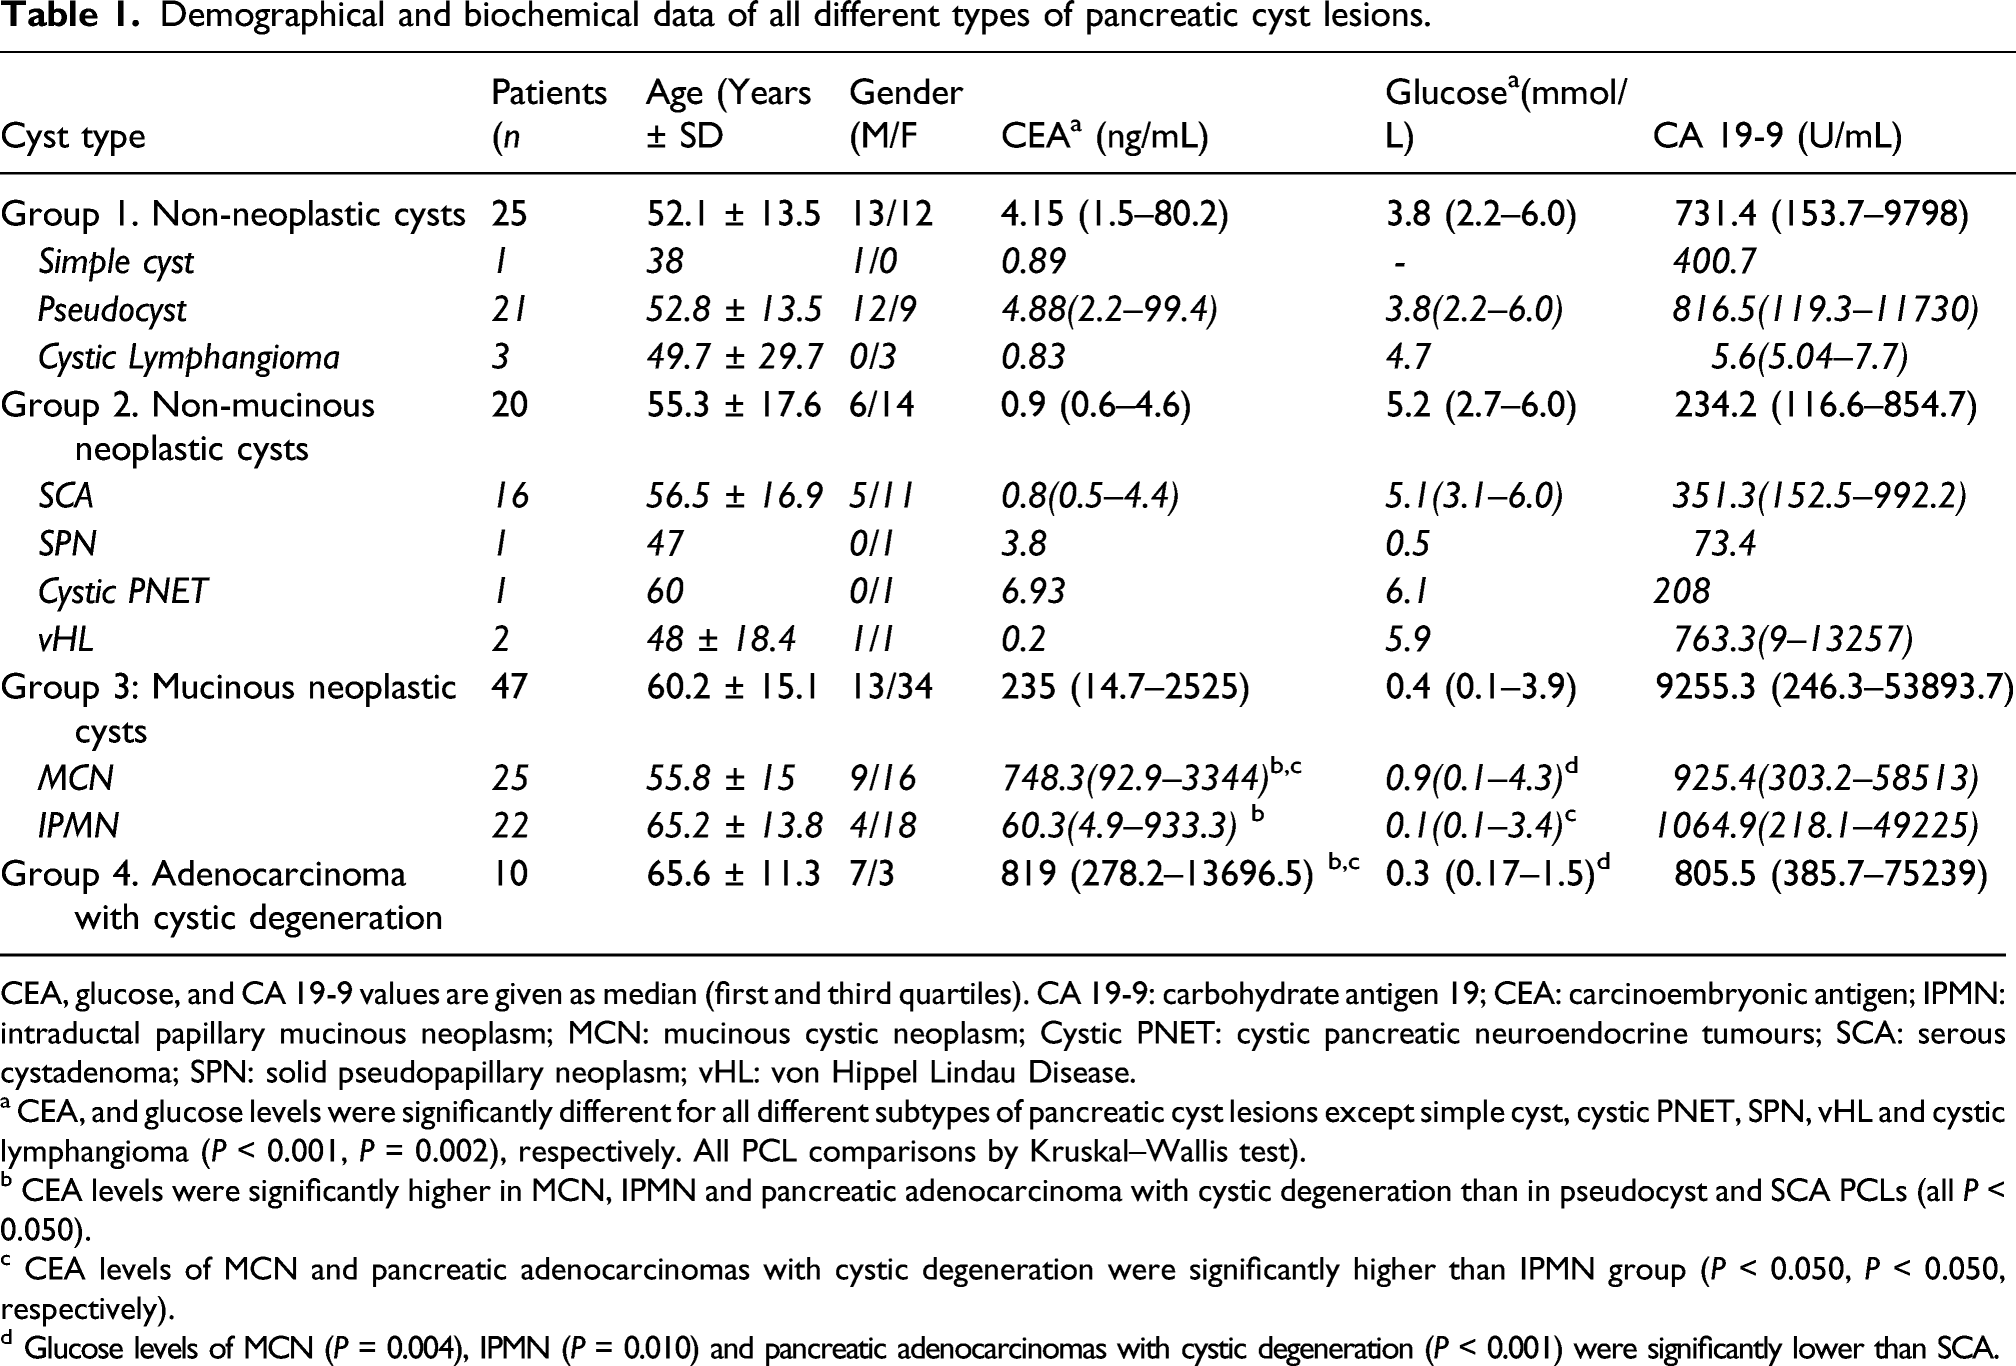
CEA, glucose, and CA 19-9 values are given as median (first and third quartiles). CA 19-9: carbohydrate antigen 19; CEA: carcinoembryonic antigen; IPMN: intraductal papillary mucinous neoplasm; MCN: mucinous cystic neoplasm; Cystic PNET: cystic pancreatic neuroendocrine tumours; SCA: serous cystadenoma; SPN: solid pseudopapillary neoplasm; vHL: von Hippel Lindau Disease.
a CEA, and glucose levels were significantly different for all different subtypes of pancreatic cyst lesions except simple cyst, cystic PNET, SPN, vHL and cystic lymphangioma (P < 0.001, P = 0.002), respectively. All PCL comparisons by Kruskal–Wallis test).
b CEA levels were significantly higher in MCN, IPMN and pancreatic adenocarcinoma with cystic degeneration than in pseudocyst and SCA PCLs (all P < 0.050).
c CEA levels of MCN and pancreatic adenocarcinomas with cystic degeneration were significantly higher than IPMN group (P < 0.050, P < 0.050, respectively).
d Glucose levels of MCN (P = 0.004), IPMN (P = 0.010) and pancreatic adenocarcinomas with cystic degeneration (P < 0.001) were significantly lower than SCA.
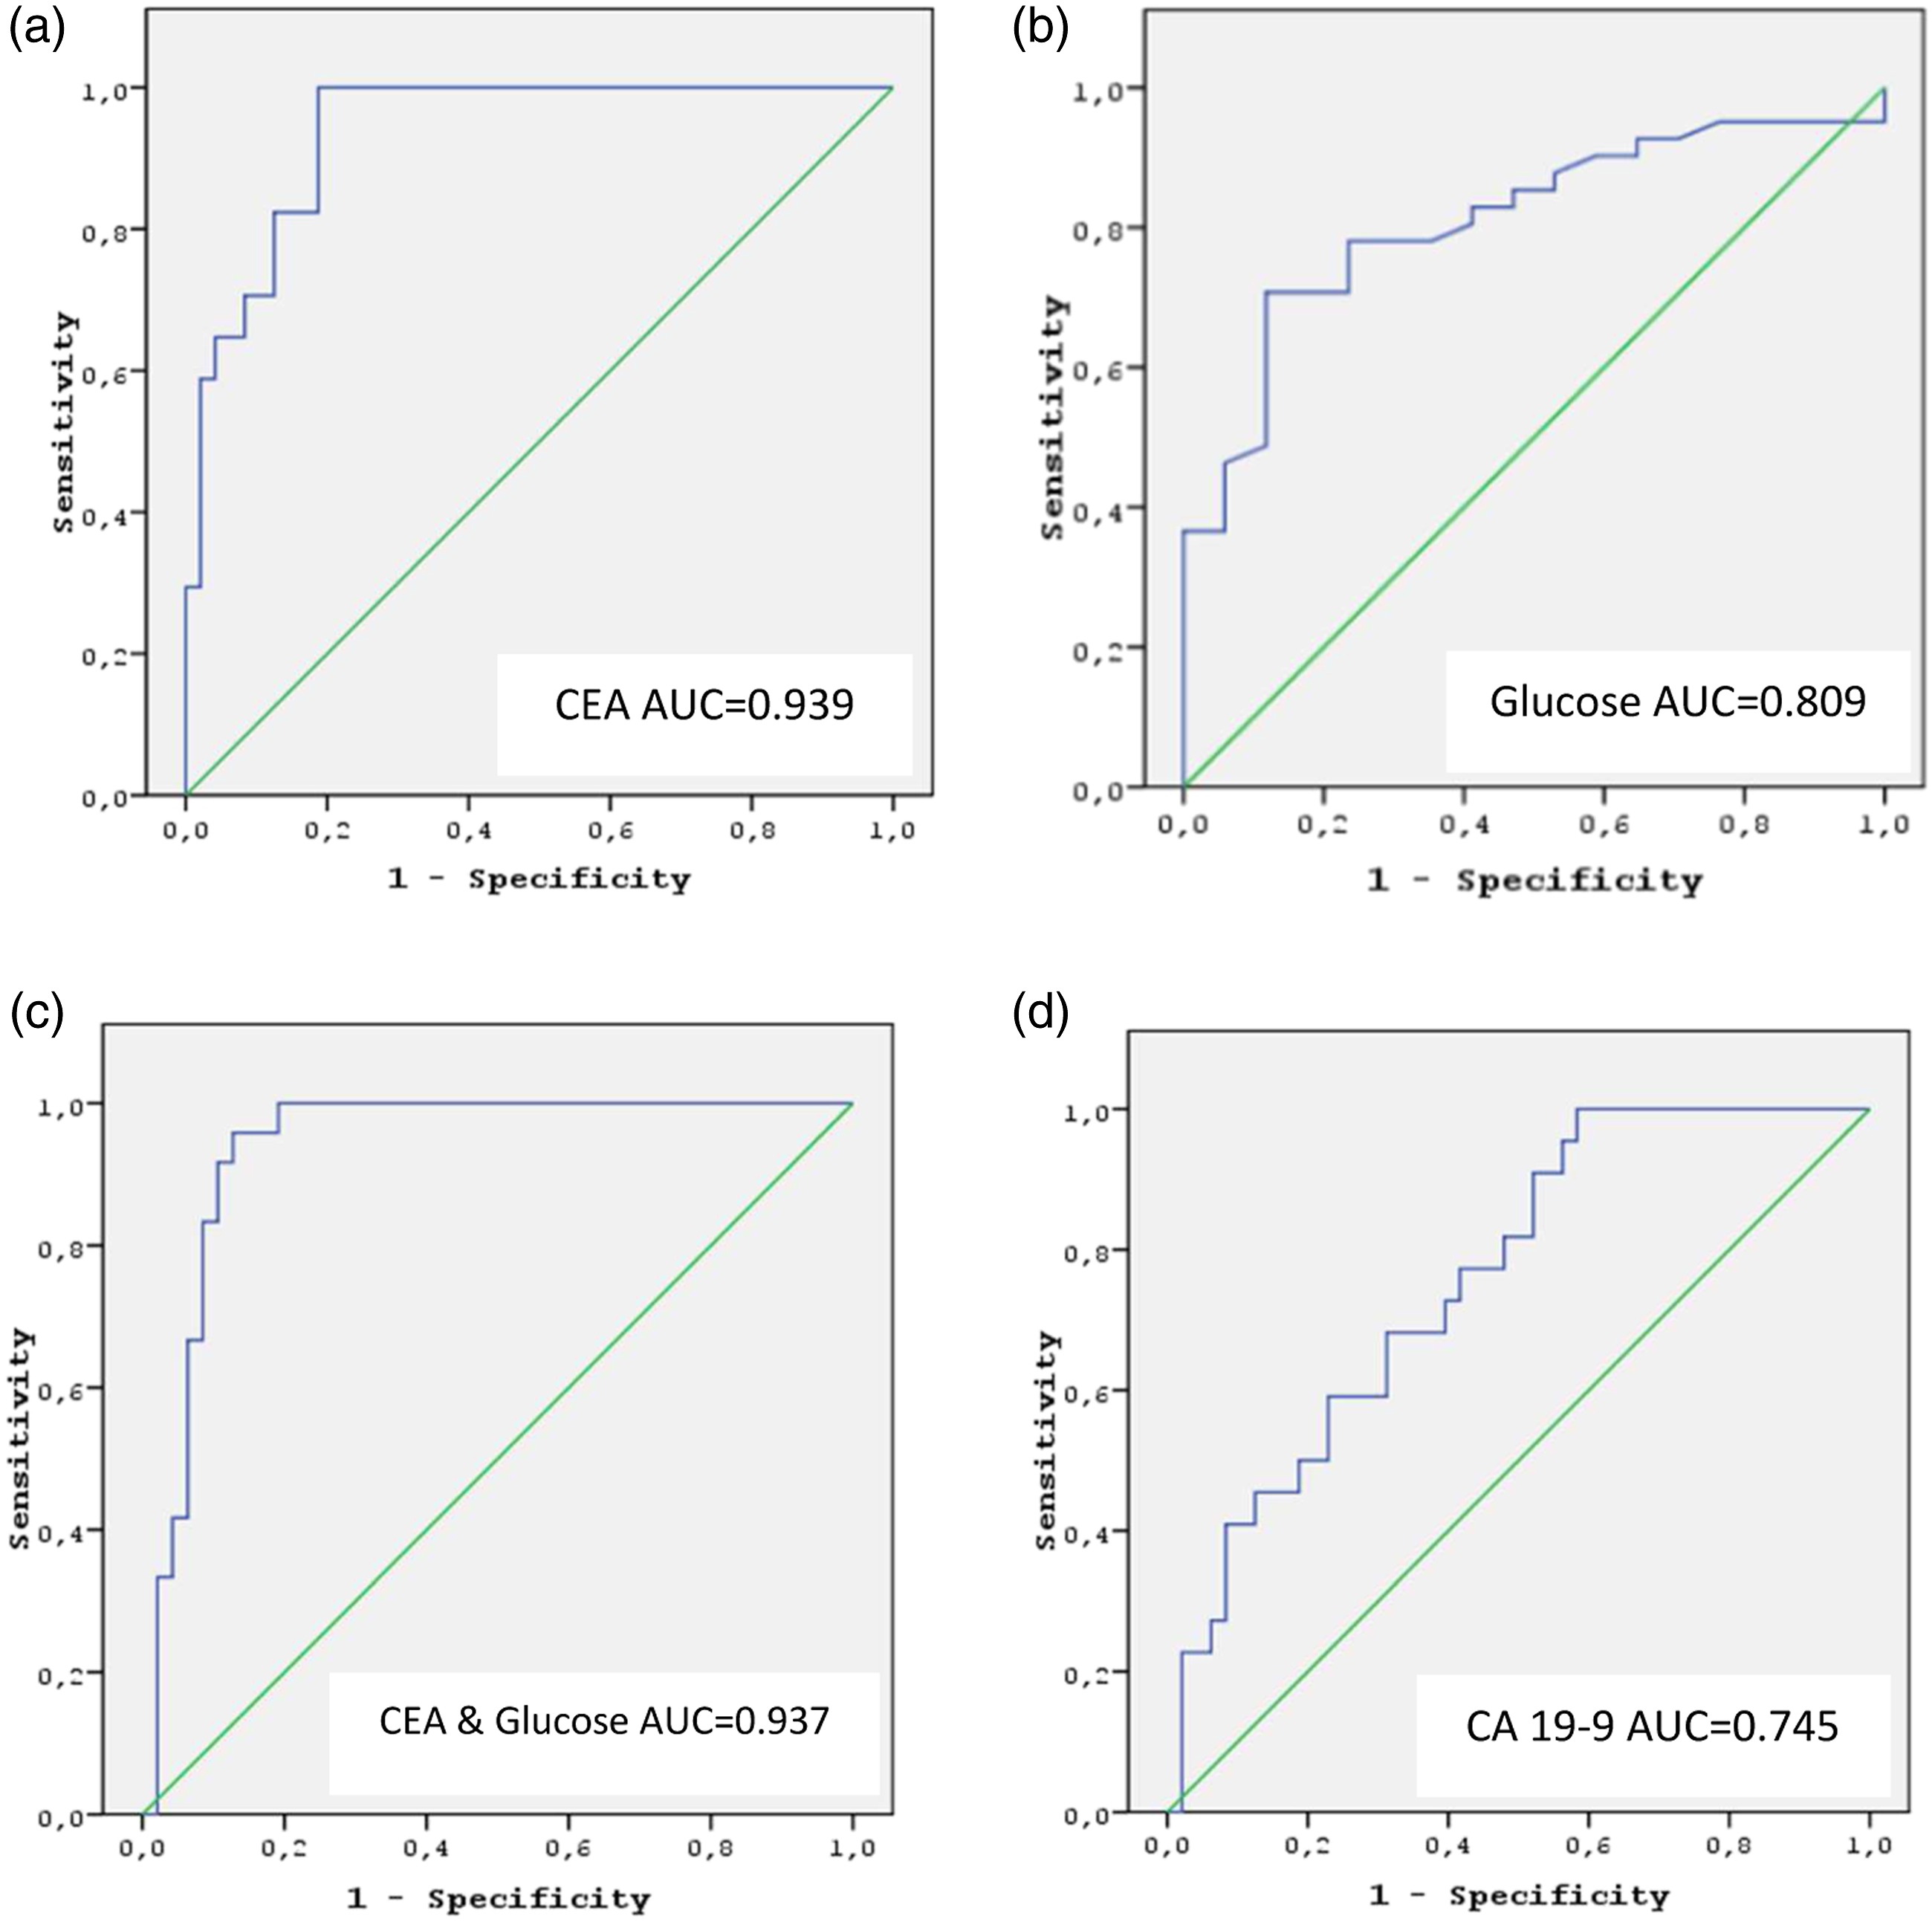
ROC of CEA (a), glucose (b), CEA and glucose combination (c) and CA 19-9 (d) for the discrimination between mucinous and non-mucinous neoplastic pancreatic cyst lesions. CA 19-9: Carbohydrate antigen 19-9; CEA: Carcinoembryonic antigen; ROC: Receiver-operating characteristic.
Test performances of CEA, glucose and CA 19-9 to distinguish between mucinous and non-mucinous neoplastic PCLs.
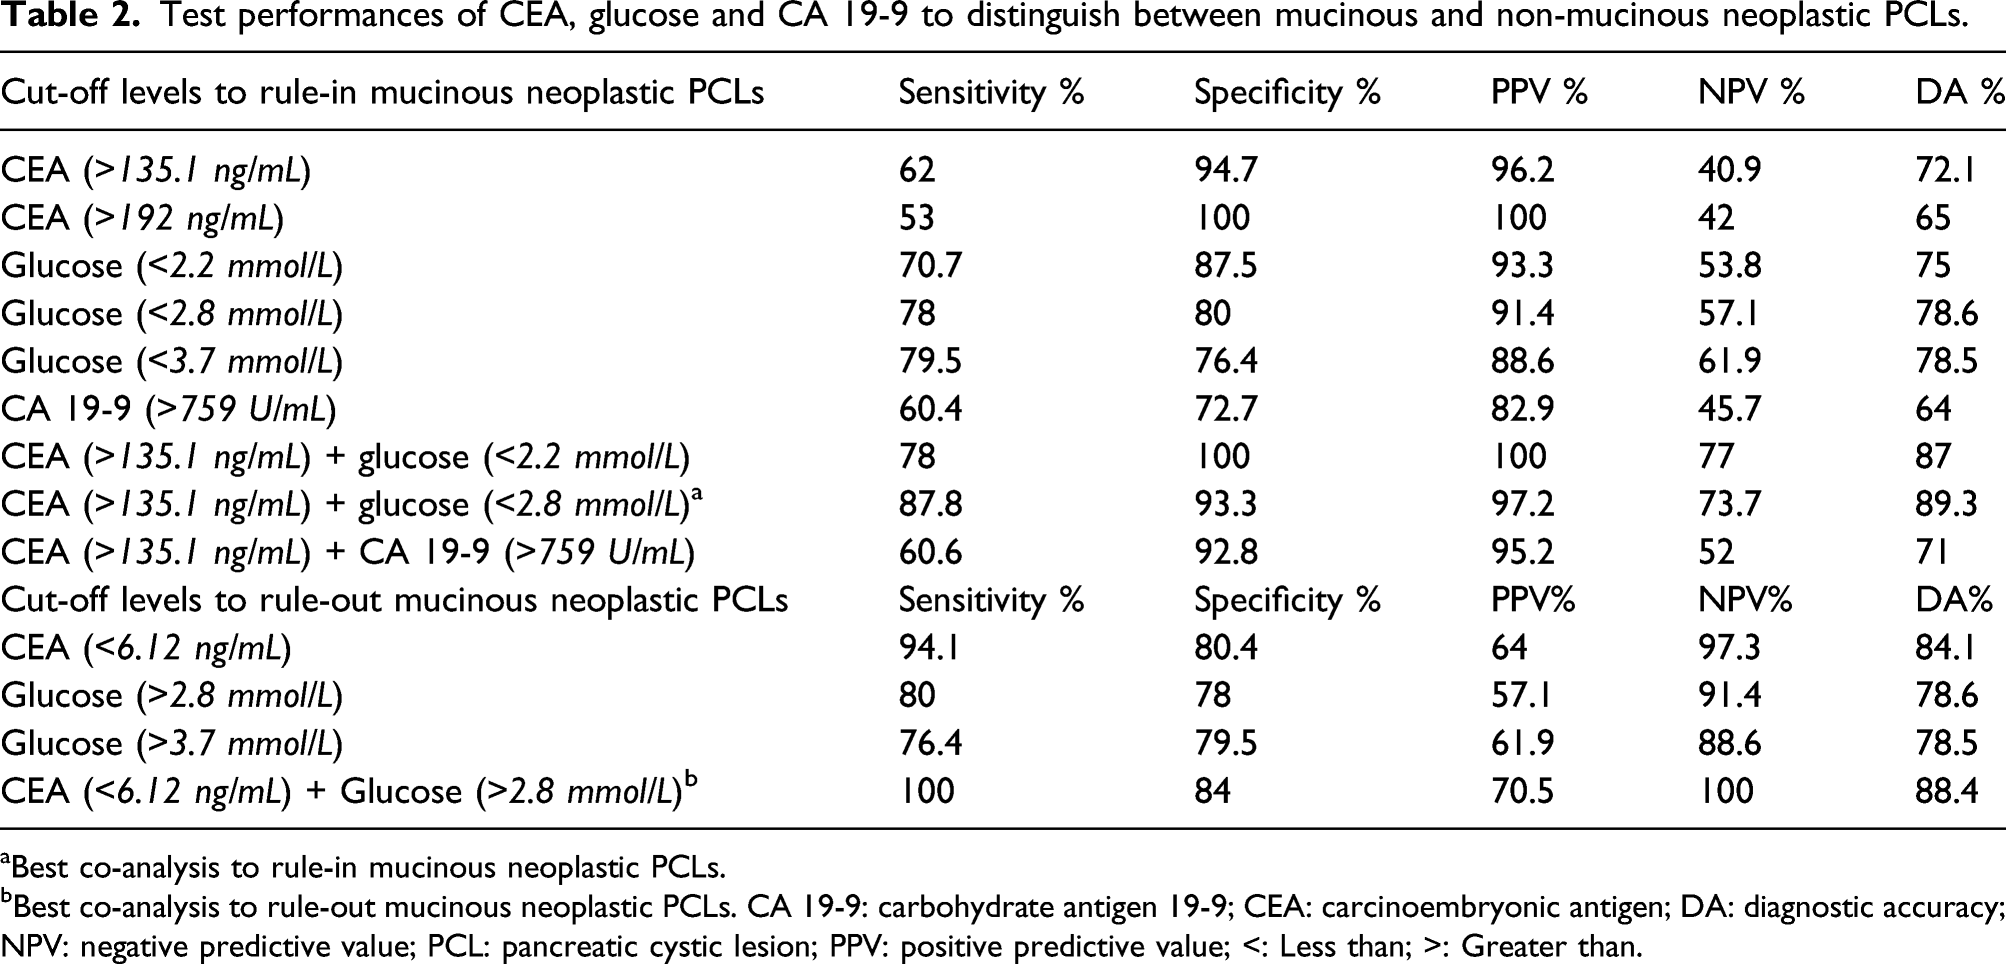
aBest co-analysis to rule-in mucinous neoplastic PCLs.
bBest co-analysis to rule-out mucinous neoplastic PCLs. CA 19-9: carbohydrate antigen 19-9; CEA: carcinoembryonic antigen; DA: diagnostic accuracy; NPV: negative predictive value; PCL: pancreatic cystic lesion; PPV: positive predictive value; <: Less than; >: Greater than.
The median (first–third quartiles) of CEA, glucose and CA 19-9 levels of the 39 patients with pauci-cellular pancreatic cyst fluid were 28 (1.53–154.22), 1.1(0.1–5.6) mmol/L and 506 (47.7–12,718), respectively. Of these cyst fluid data, 9 of them had CEA >135.1 ng/mL, 10 of them had glucose <2.8 mmol/L and six of them had both CEA >135.1 ng/mL and glucose <2.8 mmol/L.
Discussion
EUS-FNA, cytology, CT, MRI and cyst fluid biomarkers play an important role in the diagnosis of patients with PLC and in determining the risk of malignant transformation of cysts. Since there is high possibility of these PCLs to be premalignant or malignant, it is compulsory to make an accurate diagnosis before referral to surgery or conservative therapy. We aimed to compare the diagnostic performances of pancreatic cyst fluid CEA, CA 19-9 and glucose in differentiating mucinous from non-mucinous neoplastic PCLs and determine the best cut-off levels.
Thornton et al., mentioned in their meta-analysis that EUS-FNA had a specificity of 93% and sensitivity of 54% to diagnose pancreatic cystic neoplasms. 11 Pancreatic cyst fluid cytological analysis had an excellent specificity, but the sensitivity was quite poor. Insufficient sampling that causes falsely negative or non-diagnostic results is a non-negligible problem. In our study, 52 patients with non-diagnostic cytology and 39 patients with pauci-cellular cyst fluid or insufficient cyst fluid sampling had to be excluded. According to our chosen cut-off levels, of these pauci-cellular cyst fluid data, nine of them had CEA >135.1 ng/mL, 10 of them had glucose <2.8 mmol/L and six of them had both CEA >135.1 ng/mL and glucose <2.8 mmol/L, indeed, these are precisely the cases in which biochemical analysis of cyst fluid may be most clinically useful. Although the specificity of PCL cytology was nearly perfect, the unsatisfactory sensitivity findings forced the clinicians to investigate other pancreatic cyst fluid parameters in routine clinical practice. Wang et al. showed in their meta-analysis that malignant cytology had high specificity (94%) and moderately low sensitivity (51%); 12 in addition, in the meta-analysis by Thosani et al. the specificity, and the sensitivity of cytology in discriminating mucinous cystic lesions from serous cystic lesions were 88% and 63%, respectively. 13
CEA and CA 19-9 are the widely studied tumour markers; and especially CEA is the most clinically useful cystic fluid biomarker for the prediction of mucinous cytology. In our study, cyst fluid CEA and CA 19-9 levels were significantly higher in mucinous than non-mucinous PCLs in concordance with other studies.6,7,14,15 ROC analysis of CEA was performed to differentiate between mucinous and non-mucinous neoplastic PCLs. A cut-off level of 135.1 ng/mL to rule-in mucinous neoplastic PCLs had a specificity of 94.7% and sensitivity of 62%; PPV, NPV and DA were 96.2%, 40.9 and 72.1%, respectively. A multicentre study by Brugge et al. demonstrated that 192 ng/mL of cyst fluid CEA cut-off level was the best level for differentiating mucinous from non-mucinous neoplastic PCLs (sensitivity = 75%, specificity = 84% and DA = 79%). 16 The CEA cut-off level of 192 ng/mL determined by Brugge et al. was applied to our PCL data. Test performances of both 135.1 ng/mL and 195 ng/mL cut-off levels for the detection of mucinous PCLs were compared. CEA at a level of 135.1 ng/mL had a better sensitivity, a higher DA (62%, 72.1%, respectively) than at a level of 192 ng/mL (53%, 65%, respectively). Both 135.1 and 192 ng/mL, had very high specificity and PPV, but NPV was low (Table 2). The cut-off level of 135.1 ng/mL had underdiagnosis of 38% for mucinous (sensitivity 62%) and 5.3% for non-mucinous neoplastic (specificity 94.7%) PCLs. Another multicentre study found a similar misdiagnosis of 40% for mucinous and a higher misdiagnosis of 17% for non-mucinous at the cut-off level of 192 ng/mL. 15 Gaddam et al. also showed that CEA cut-off level of 105 ng/mL had 70% sensitivity and 63% specificity and at this cut-off level, 30% of mucinous PCLs were underdiagnosed. 15 In some studies, if low sensitivity was put aside, higher CEA cut-off levels have been preferred to achieve a better DA for mucinous PCLs.15,17 In our study, the DA of the cut-off level 192 ng/mL was lower than the cut-off level 135.1 ng/mL. For the detection of mucinous PCLs, high CEA levels (>800 ng/mL) had a specificity of 86–98%, a DA of 58–79%, but the sensitivity was very low (33–48%).6,15,18,19 We did not prefer to lower the sensitivity under 50%, thus a cut-off level higher than 192 ng/mL was not suitable to our data. Oh et al. showed that to diagnose mucinous PCLs, combining CEA (a lower cut-off level of 48.6 ng/mL) with cyst fluid cytology and viscosity results had high sensitivity (72.4%), specificity (94.7%) and accuracy (81.3%). 20 In our study, many subjects with inefficient cytology were excluded and qualitative viscosity results were few. Thus, we did not combine CEA levels with fluid cytology and viscosity for predicting mucinous PCLs. Park et al. recommended low cut-off level of CEA <5 ng/mL to rule-out mucinous PCLs (sensitivity between 44 and 50%, specificity ≥95%, and DA between 67 and 78%). 6 In our study, CEA 6.12 ng/mL cut-off level was chosen to exclude mucinous neoplastic PCLs, with sensitivity 94.1%, specificity 80.4%, PPV 64%, NPV 97.3% and DA 84.1%. To rule-out mucinous PCLs, this low cut-off level had 5.9% of underdiagnosis. As mentioned above, our results were in concordance with many other studies indicating that CEA is still the first-choice tumour biomarker for differentiating mucinous from non-mucinous neoplastic PCLs. The results of our study suggest that cyst fluid CEA values higher than 135.1 ng/mL rule-in, and less than 6.12 ng/mL rule-out mucinous PCLs. As can be observed, CEA values between 6.12 and 135.1 ng/mL can be considered as the grey zone for mucinous versus non-mucinous predictions. In other words, it is difficult to predict mucinous or non-mucinous by evaluating only the CEA values in the grey zone range.
In the study by Park et al., since the glucose levels were significantly lower in mucinous cysts then non-mucinous cysts (5 mg/dL [0.3 mmol/L]), (82 mg/dL [4.6 mmol/L]), respectively. P = 0.002), they suggested for the first time that pancreatic cyst fluid glucose was a potential promising biomarker. 21 In our study, glucose levels of mucinous neoplastic PCLs and pancreatic adenocarcinomas with cystic degeneration groups were significantly lower than both the non-mucinous neoplastic PCLs (P = 0.001, P < 0.001, respectively) and the non-neoplastic PCLs (P < 0.010, P = 0.010, respectively). Low values indicated a neoplastic lesion, but there was no significant difference between pancreatic adenocarcinomas with cystic degeneration and mucinous neoplastic groups (IPMN, MCN). According to our data, to rule-in mucinous neoplastic cysts, the glucose cut-off of 39.5 mg/dL (2.2 mmol/L) compared to CEA levels at cut-off 135.1 ng/mL had a higher sensitivity (70.7%) but a lower specificity (87.5%). Park et al. suggested a cyst fluid glucose cut-off level of 66 mg/dL (3.7 mmol/L), which had a reliable diagnostic performance for predicting mucinous PCLs (sensitivity 94%, specificity 64% and DA 84%). In their study, they also showed that serous cystic neoplasms (mean = 98 mg/dL, [5.5 mmol/L]) had glucose levels significantly higher (P = 0.0001) than all the other cyst types (mean = 7 mg/dL [0.4 mmol/L]). They suggested that serous cystic neoplasms can be distinguished from other cyst types with the same 66 mg/dL (3.7 mmol/L) glucose cut-off level (sensitivity = 88%, specificity = 89%, DA = 89%). 21 The cut-off level of 66 mg/dL (3.7 mmol/L) was applied to our data, and the sensitivity, specificity, PPV, NPV and DA were 79.5%, 76.4%, 88.6%, 61.9% and 78.5%, respectively. The glucose cut-off level of 50 mg/dL (2.8 mmol/L) suggested by Zikos et al. 22 (sensitivity = 88%, specificity = 78%) was applied to our PCL data. In our study, the prediction of mucinous PCLs with the cut-off of 2.8 mmol/L had sensitivity, specificity, PPV, NPV and DA, 78%, 80%, 91.4%, 57.1% and 78.6%, respectively. Considering our glucose data, DA of 2.8 mmol/L was the best within the three cut-offs. Therefore, we preferred the cut-off value of 2.8 mmol/L in the differentiation of mucinous PCL from non-mucinous PCL even though the specificity and PPV values of cut-off 2.2 mmol/L were higher. Carr et al. compared cyst fluid glucose and CEA levels in pathologically diagnosed PCLs. 23 They found that the glucose median (19 mg/dL [1.1 mmol/L]) of the mucinous cyst group was significantly lower (P < 0.001) than the others (96 mg/dL [5.4 mmol/L]) in concordance with our study. Carr et al. also examined both the glucose cut-off level = 50 mg/dL (2.8 mmol/L) recommended by Zikos et al. 22 and the CEA cut-off level = 192 ng/mL (10.8 mmol/L) recommended by Brugge et al. 16 The sensitivity, specificity and DA for the prediction of mucinous neoplastic PCLs at glucose = 2.8 mmol/L were 92%, 87%, 90% and at CEA = 192 ng/mL were 58%, 96% and 69%, respectively. 23 They showed that CEA and glucose test combination was better in differentiating pancreatic mucinous cysts than the diagnostic performance of both tests alone. 23 In our study, CEA and glucose co-analysis with different cut-off values were evaluated; and CEA (cut-off = 135.1 ng/mL) and glucose (cut-off = 2.8 mmol/L) test combination to distinguish mucinous from non-mucinous neoplastic PCLs had the best sensitivity of 87.8%, specificity of 93.3% (PPV = 97.2%, NPV = 73.7% and DA = 89.3%) than CEA or glucose measurements alone. Contrary to both our study and Carr et al.’s study; Zikos et al. showed that, evaluating CEA and glucose levels together did not have better DA than glucose or CEA results alone.22,23 In our study, CEA cut-off level 6.12 ng/mL and glucose cut-off level 2.8 mmol/L were also examined to rule-out mucinous neoplastic PCLs. Co-analysis was also found to be useful in non-mucinous discrimination according to the evaluation with CEA or glucose cut-off values alone. With CEA 6.12 ng/mL and glucose 2.8 mmol/L cut-offs, sensitivity increased to 100%, specificity to 84%, PPV to 70.5%, NPV to 100% and finally DA to 88.4%. In the light of our findings, co-analysis of pancreatic cyst fluid CEA and glucose should be regarded as reliable test combination. Moreover, in routine clinical practice, it is an important issue that centres performing pancreatic cyst fluid analysis should determine cut-off levels with the best diagnostic performance for differentiating mucinous from non-mucinous PCLs. Another important aspect was that CEA levels in grey zone (6.12–135.1 ng/mL) can be combined with glucose for a better prediction of mucinous PCL. There was a significant difference (P < 0.001) between the mucinous and non-mucinous PCL glucose medians at grey zone. Since there were very few subjects, the statistical comparison was not efficient. More data in the grey zone should be statistically analysed.
In pancreatic cystic fluid, like CEA, CA 19-9 measurements, have also been recommended to distinguish mucinous PCLs.4,7,24 In our study, pancreatic cystic fluid CA 19-9 levels were significantly higher in mucinous neoplastic PCLs than non-mucinous neoplastic lesions (P < 0.001). To distinguish mucinous neoplastic PCLs by pancreatic cyst fluid CA 19-9, a cut-off level of 759 U/mL was used (sensitivity 60.4%, specificity 72.7%) and showed low diagnostic performance. Pancreatic cyst fluid CA 19-9 was not as reliable as CEA or glucose. Nevertheless, co-analysis with CEA was examined. The co-analysis of CEA and CA 19-9 had sensitivity of 60.6%, specificity of 92.8% and DA of 71%; the test combination was not better than testing CEA alone. Since the co-analysis predicted a lower degree of diagnostic reliability as testing CEA alone, we concluded that the diagnostic value of cyst fluid CA 19-9 was limited.
Various immunoassay techniques for the detection of CA 19-9 and CEA using different monoclonal antibodies lead to different results. Thus, CEA and CA 19-9 values determined on patient samples by different testing procedures cannot be directly compared. Wide variety of antibodies developed by different manufacturers recognize different parts of the tumour markers, and antigen heterogeneity may account in part for inter-method differences.25,26 Furthermore, the antigenic determinants of CEA have been characterized, and the available monoclonal antibodies were classified into five specific epitope groups. 27 The antibodies used by different CEA immunoassay kit manufacturers react with different epitopes. Since there are above mentioned well known analytical differences in measuring CEA by the immunoassay methods, each laboratory should determine their own cut-off levels; and moreover, pancreatic cyst fluid CEA and CA 19-9 cut-off levels with different commercially available assays are not compatible in different laboratory studies. In addition, commercially available different CEA and CA 19-9 test methods are validated for analysis of plasma and serum but not cyst fluid. Analytical validity studies for CEA and CA 19-9 in pancreatic cyst fluid analysis revealed inconsistencies that require further investigation. Moparty et al. investigated the reproducibility of CEA Siemens® Centaur and Roche® Elecsys assays in pancreatic cyst fluid and found that intra-assay variability was low for both assays (CV% < 5% in triplicate analyses). However, Siemens® Centaur CEA levels were approximately 50% lower than CEA Roche® assay. In their study, linearity and recovery were assessed for three pancreatic cyst fluid samples by serial dilution and addition of known concentrations of CEA. Recovery of CEA was between 49% and 111%. The results of CEA of the diluted samples were only within 20% of the results of the undiluted pure pancreatic cyst fluids. 28 In another study by Boot et al., the assay validity of the Roche® Elecsys CEA and CA 19-9 tests in pancreatic cyst fluid was evaluated by investigating the linearity of 21 diluted samples. 29 In a very informative review article written by Boot, the use of different cut-off values in the diagnosis of mucinous pancreatic cyst in studies with a wide variety of commercial assays is discussed. Boot stated that these differences in the detected cut-off values are assay dependent. 30 On the other hand, glucose, measured by enzymatic photometric hexokinase or glucose oxidase-peroxidase methods, is a cheaper, faster and widely used enzymatic assay. It has been reliably studied for a long-time in different body fluids; 31 therefore, glucose cut-off levels of pancreatic cyst fluid are more comparable than the tumour biomarkers.
The most important limitation of this study is that this is a retrospective study. There is a stubborn fact that cyst fluid biochemical tests cannot be put aside and in routine clinical practice cyst fluid cytology, radiological imaging, cyst fluid biomarkers were used for final diagnosis. If we had included the patients in the study without paying attention to this point, it would have unavoidably led to potential bias. Taking this into account, to minimize bias, only patients who have both independently evaluated radiological imaging reports and cytological reports were included in our study. Patients without either of two reports were excluded, plus these reports were independently evaluated from the gastroenterological final diagnosis, which was applied differently from the routine diagnosis. Other limitations of our study are molecular analysis of pancreatic cyst fluid is not performed in routine practice in our hospital, and many patients with insufficient cytological and/or imaging data had to be excluded.
We concluded that co-analysis of CEA (cut-off level 135.1 ng/mL) and glucose (cut-off level 2.8 mmol/L) in pancreatic cyst fluids had the best testing performance for predicting mucinous neoplastic PCLs. To rule-out mucinous PCLs co-analysis of CEA (cut-off level 6.12 ng/mL) and glucose (cut-off level 2.8 mmol/L) adds value to prediction.
Footnotes
Acknowledgements
None.
Contributorship
BB literature search, study design, study protocol development, receiving ethical approval, data analysis, manuscript writing. NO literature search, study design, study protocol development, data analysis, manuscript writing. GA study protocol development, study protocol development, manuscript writing. SK literature search, receiving ethical approval, data analysis, manuscript writing. AA, DN, MH data analysis. All authors reviewed and edited the manuscript and approved the final version.
Declaration of conflicting interests
The author(s) declared no potential conflicts of interest with respect to the research, authorship, and/or publication of this article.
Funding
The author(s) received no financial support for the research, authorship, and/or publication of this article: This research received no specific grant from any funding agency in the public, commercial, or not-for-profit sectors.
Ethical approval
The ethic committee of Ege University approved the study (study reference number: 20-3.1T/1).