
Abstract
Background
Ionized hypocalcemia is common in critically ill patients with COVID-19 and is associated with adverse outcomes. We previously developed a linear model that estimates ionized calcium (ICa) by adjusting total calcium (TCa) for the three components of the anion gap and albumin. On internal validation, it outperformed the popular method that corrects TCa for albumin alone (cTCa) in diagnosing low ICa. In this study, we sought to externally validate our ICa model in hospitalized COVID-19 positive patients.
Methods
We retrospectively studied all 200 patients with COVID-19 who were admitted to the State University of New York Downstate Medical Center between March 11th and April 30th 2020 and referred to the nephrology service for renal failure, and who had ICa measured on a venous blood gas within 25 min of a comprehensive metabolic panel. We compared the performance of the ICa model and cTCa in diagnosing low ICa by ROC analysis, and also examined the accuracy of the absolute values predicted by the two methods relative to measured ICa.
Results
On ROC analysis, the ICa model was better than cTCa (area under ROC curve: 0.872 [0.025] vs. 0.835 [0.028]; p = 0.045). The ICa model estimated ICa accurately, but the cTCa method seemed to overcorrect TCa, as a substantial number of patients with clearly normal cTCa values had low ICa.
Conclusions
In an external validation cohort, the ICa model estimated ICa accurately and was better than cTCa in the diagnosis of low ICa. This finding can be useful in guiding direct ICa testing.
Keywords
Introduction
New York City was the epicenter of the COVID-19 pandemic, affecting more than 3400 persons per 100,000 in the borough of Brooklyn alone. 1 Many people were critically ill with multiorgan system involvement and required intensive care. Low ionized calcium (ICa) is a common abnormality among critically ill COVID-19 patients and has been found to be an important predictor of COVID-19 positivity at triage and of a poor outcome in infected patients, in analyses that accounted for pH and other covariates.2-4 Although low ICa can be diagnosed with the ion-selective electrodes available on blood gas analyzers and other point-of-care analyzers, direct measurement is still not routine, because of its cost, labor and sample requirements,5-8 and the ferocity of the pandemic has further strained hospital resources. As a result, it is still common clinical practice to infer the presence of an abnormal ICa indirectly, using an equation that “corrects” the concentration of total calcium (TCa) for that of albumin, with the resultant corrected value (cTCa) compared to the reference range for TCa. 9 The cTCa equation was popularized in the 1970s, without validation against ICa. Subsequent external validation studies, which incorporated ICa, found the diagnostic performance of cTCa to be poor,8,10-12 but by then its routine use in clinical practice had been cemented. Commonly suggested reasons for the poor performance of cTCa include its failure to account for alterations in the affinity of albumin for calcium caused by changes in pH and free fatty acids in critical care patients, or for the differences among centers in the albumin assay.8,10-14 Another suggested reason is that cTCa does not account for variation in the level of small anions that can bind calcium.13,15-17
To account for binding of calcium to small anions and albumin, we recently derived a novel linear regression equation (ICa model) that estimates ICa in critical care patients from routine measurements of TCa, serum albumin, and the three components of the anion gap—sodium (Na), chloride (Cl), and total carbon dioxide (tCO2). 13 In that study, the serum chemistry measurements were made using the Siemens ADVIA Chemistry System 1650 and 1800 analyzers, while ICa was measured using the Radiometer ABL800 FLEX analyzer. The model’s output consists of the most likely arterial ICa value for a given patient together with a 95% prediction interval (PI), the range that should include the patient’s true value 95% of the time. Upon internal validation, the model significantly outperformed cTCa in detecting low ICa. Since external validation is essential to demonstrate a model’s predictive value, 18 in the present study, we tested the ability of the ICa model to diagnose low ICa and to estimate the concentration of ICa at a different clinical site using a different chemistry analyzer in patients who had closely timed chemistry and venous blood gas (VBG) panels during hospitalization for severe COVID-19 infection, and who, in the course of which, were referred to the nephrology service for renal failure.
Methods
Data collection and pairing
In March 2020, the State University of New York (SUNY) Downstate Medical Center was designated as COVID-19-only hospital by state directive. 19 We retrospectively collected serum comprehensive metabolic panel and VBG panel results of every COVID-19 positive patient referred to the nephrology service at our center between March 11th and April 30th 2020, excluding metabolic panels missing TCa, albumin, Na, Cl, or tCO2 and VBGs missing ICa. The diagnoses for which patients were seen by the nephrology service were either acute kidney injury or pre-existing end stage renal disease (ESRD), with the majority admitted to intensive care. Age and sex were recorded for each patient. In addition, we recorded and paired every metabolic panel with a VBG panel—if the panels were separated by no more than 25 min. Limiting each patient to the single most closely-timed pair of panels, and choosing the earliest pair in case of ties, left 200 pairs, with a mean intra-pair time gap of 0.87 min (range: 0–22 min). The protocol was approved by the institutional review board with a waiver of the need for informed consent (IRB no. 1584306-6).
Analytic methods
Serum metabolic panels were performed on the Beckman AU5800 analyzer (Beckman Coulter, Brea, CA, USA). The TCa assay uses the Arsenazo III method, with a linear range (LR) of 1.00–4.49 mmol/L (4.0–18.0 mg/dL) and an expected coefficient of variation (%CV) of 1.34% at a TCa of 2.03 mmol/L (8.12 mg/dL); the local reference range (LRR) is 2.05–2.50 mmol/L (8.2–10.0 mg/dL). Albumin was measured by the bromocresol green method (LR: 15–60 g/L; %CV: 1.5% at 29 g/L; LRR: 35–57 g/L). TCO2 was measured by an enzymatic method (LR: 2.0–45.0 mmol/L; %CV: 4.0% at 31 mmol/L; LRR: 21–31 mmol/L). Indirect potentiometry was used to measure Na (LR: 50–200 mmol/L; %CV: 0.9% at 127 mmol/L; LRR: 136–145 mmol/L) and Cl (LR: 50–200 mmol/L; %CV: 0.9% at 83 mmol/L; LRR: 98–107 mmol/L). ICa was obtained from whole blood VBG panels analyzed on the ABL837 FLEX analyzer (Radiometer, Copenhagen), with ICa measured by calcium electrode (LR: 0.23–3.86 mmol/L; local %CV: 0.4% at 1.03 mmol/L; LRR: 1.15–1.29 mmol/L). VBGs were collected using the PULSATOR sampler (Smiths-Medical, Keene, NH, USA).
Data analysis
Continuous variables are summarized as the mean and SD and compared using the paired t-test and simple correlation. Hypocalcemia in VBGs was defined as ICa <1.11 mmol/L, as in our prior study. 13 For each patient, the anion gap was calculated as: Na (mmol/L) – Cl (mmol/L) – tCO2 (mmol/L), and cTCa (mmol/L) was calculated as: TCa (mmol/L) + 0.02 × [40 – albumin (g/L)]. 9 ICa (mmol/L) was estimated by the ICa model as: 0.219 +0.365 × TCa – 0.0034 × albumin – 0.0042 × Na + 0.0073 × Cl + 0.0047 × tCO2; the average 95% PI of this estimate is: ± 0.115 mmol/L (i.e., an average range of 0.23 mmol/L).13,20
The ICa and cTCa models were examined and compared in two ways. Calibration was assessed by examining their mean predictions relative to the observed mean ICa values in the entire cohort and in subgroups. Diagnostic discrimination for ionized hypocalcemia was assessed with ROC curves. Since the hypothesis being tested is that the ICa model would outperform cTCa in ranking patients for hypocalcemia, the areas under the curves (AUC) and SE were compared using a one-tailed test in accordance with the method of Hanley and McNeil. 21 The Transparent Reporting of a multivariable prediction model for Individual Prognosis or Diagnosis (TRIPOD) guideline was utilized, 22 and the checklist is available in the Supplement. IBM SPSS Statistics for Windows, Version 24.0 (Armonk, NY: IBM Corp) was used.
Results
Baseline characteristics and simple comparisons
Demographic and laboratory data.
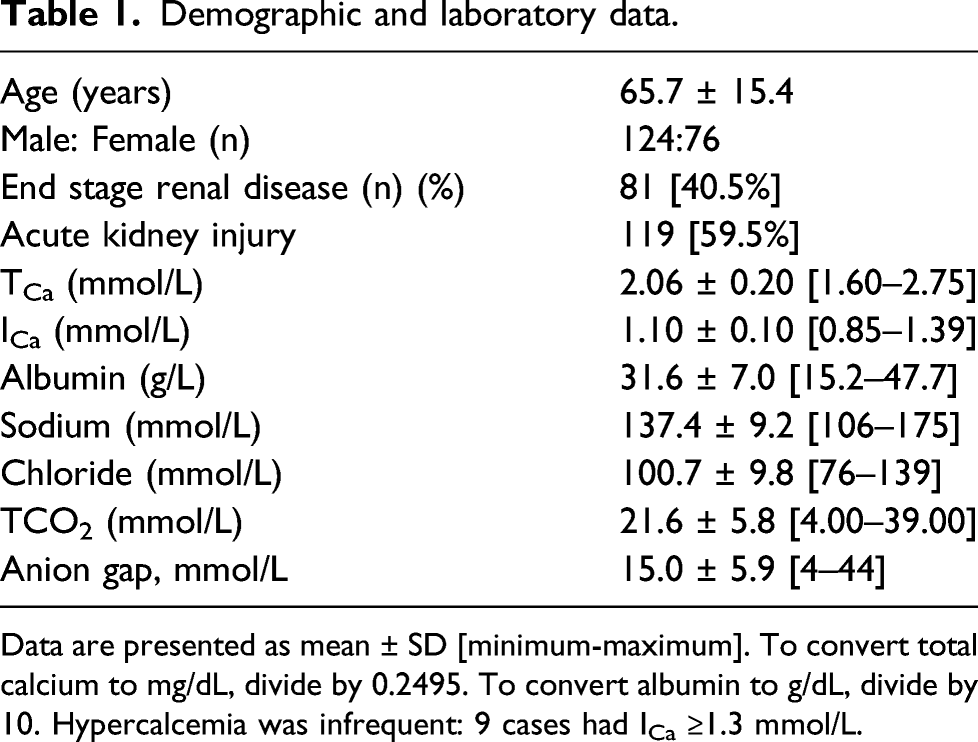
Data are presented as mean ± SD [minimum-maximum]. To convert total calcium to mg/dL, divide by 0.2495. To convert albumin to g/dL, divide by 10. Hypercalcemia was infrequent: 9 cases had ICa ≥1.3 mmol/L.
Diagnostic performance and calibration
The AUC of the ICa model was better than that of cTCa (0.872 [0.025] versus 0.835 [0.028]); p = 0.045; Figure 1) and much better than that of TCa (0.787 [0.032]). The AUC difference remained significant when we compared novel cTCa and ICa models derived and internally validated in the present cohort (see Supplemental Results). ROC curves illustrating the overall diagnostic performance for hypocalcemia of the ICa model (solid line) and cTCa (broken line). The AUCs are 0.872 (0.025) for the ICa model and 0.835 (0.028) for cTCa (p = 0.045). A diagonal line depicts the points of equal sensitivity and specificity. Going from upper left to lower right, it intersects the ICa curve at predicted ICa <1.120 mmol/L (sensitivity and specificity ∼81%) and the cTCa curve at cTCa < 2.230 mmol/L (sensitivity and specificity ∼77%).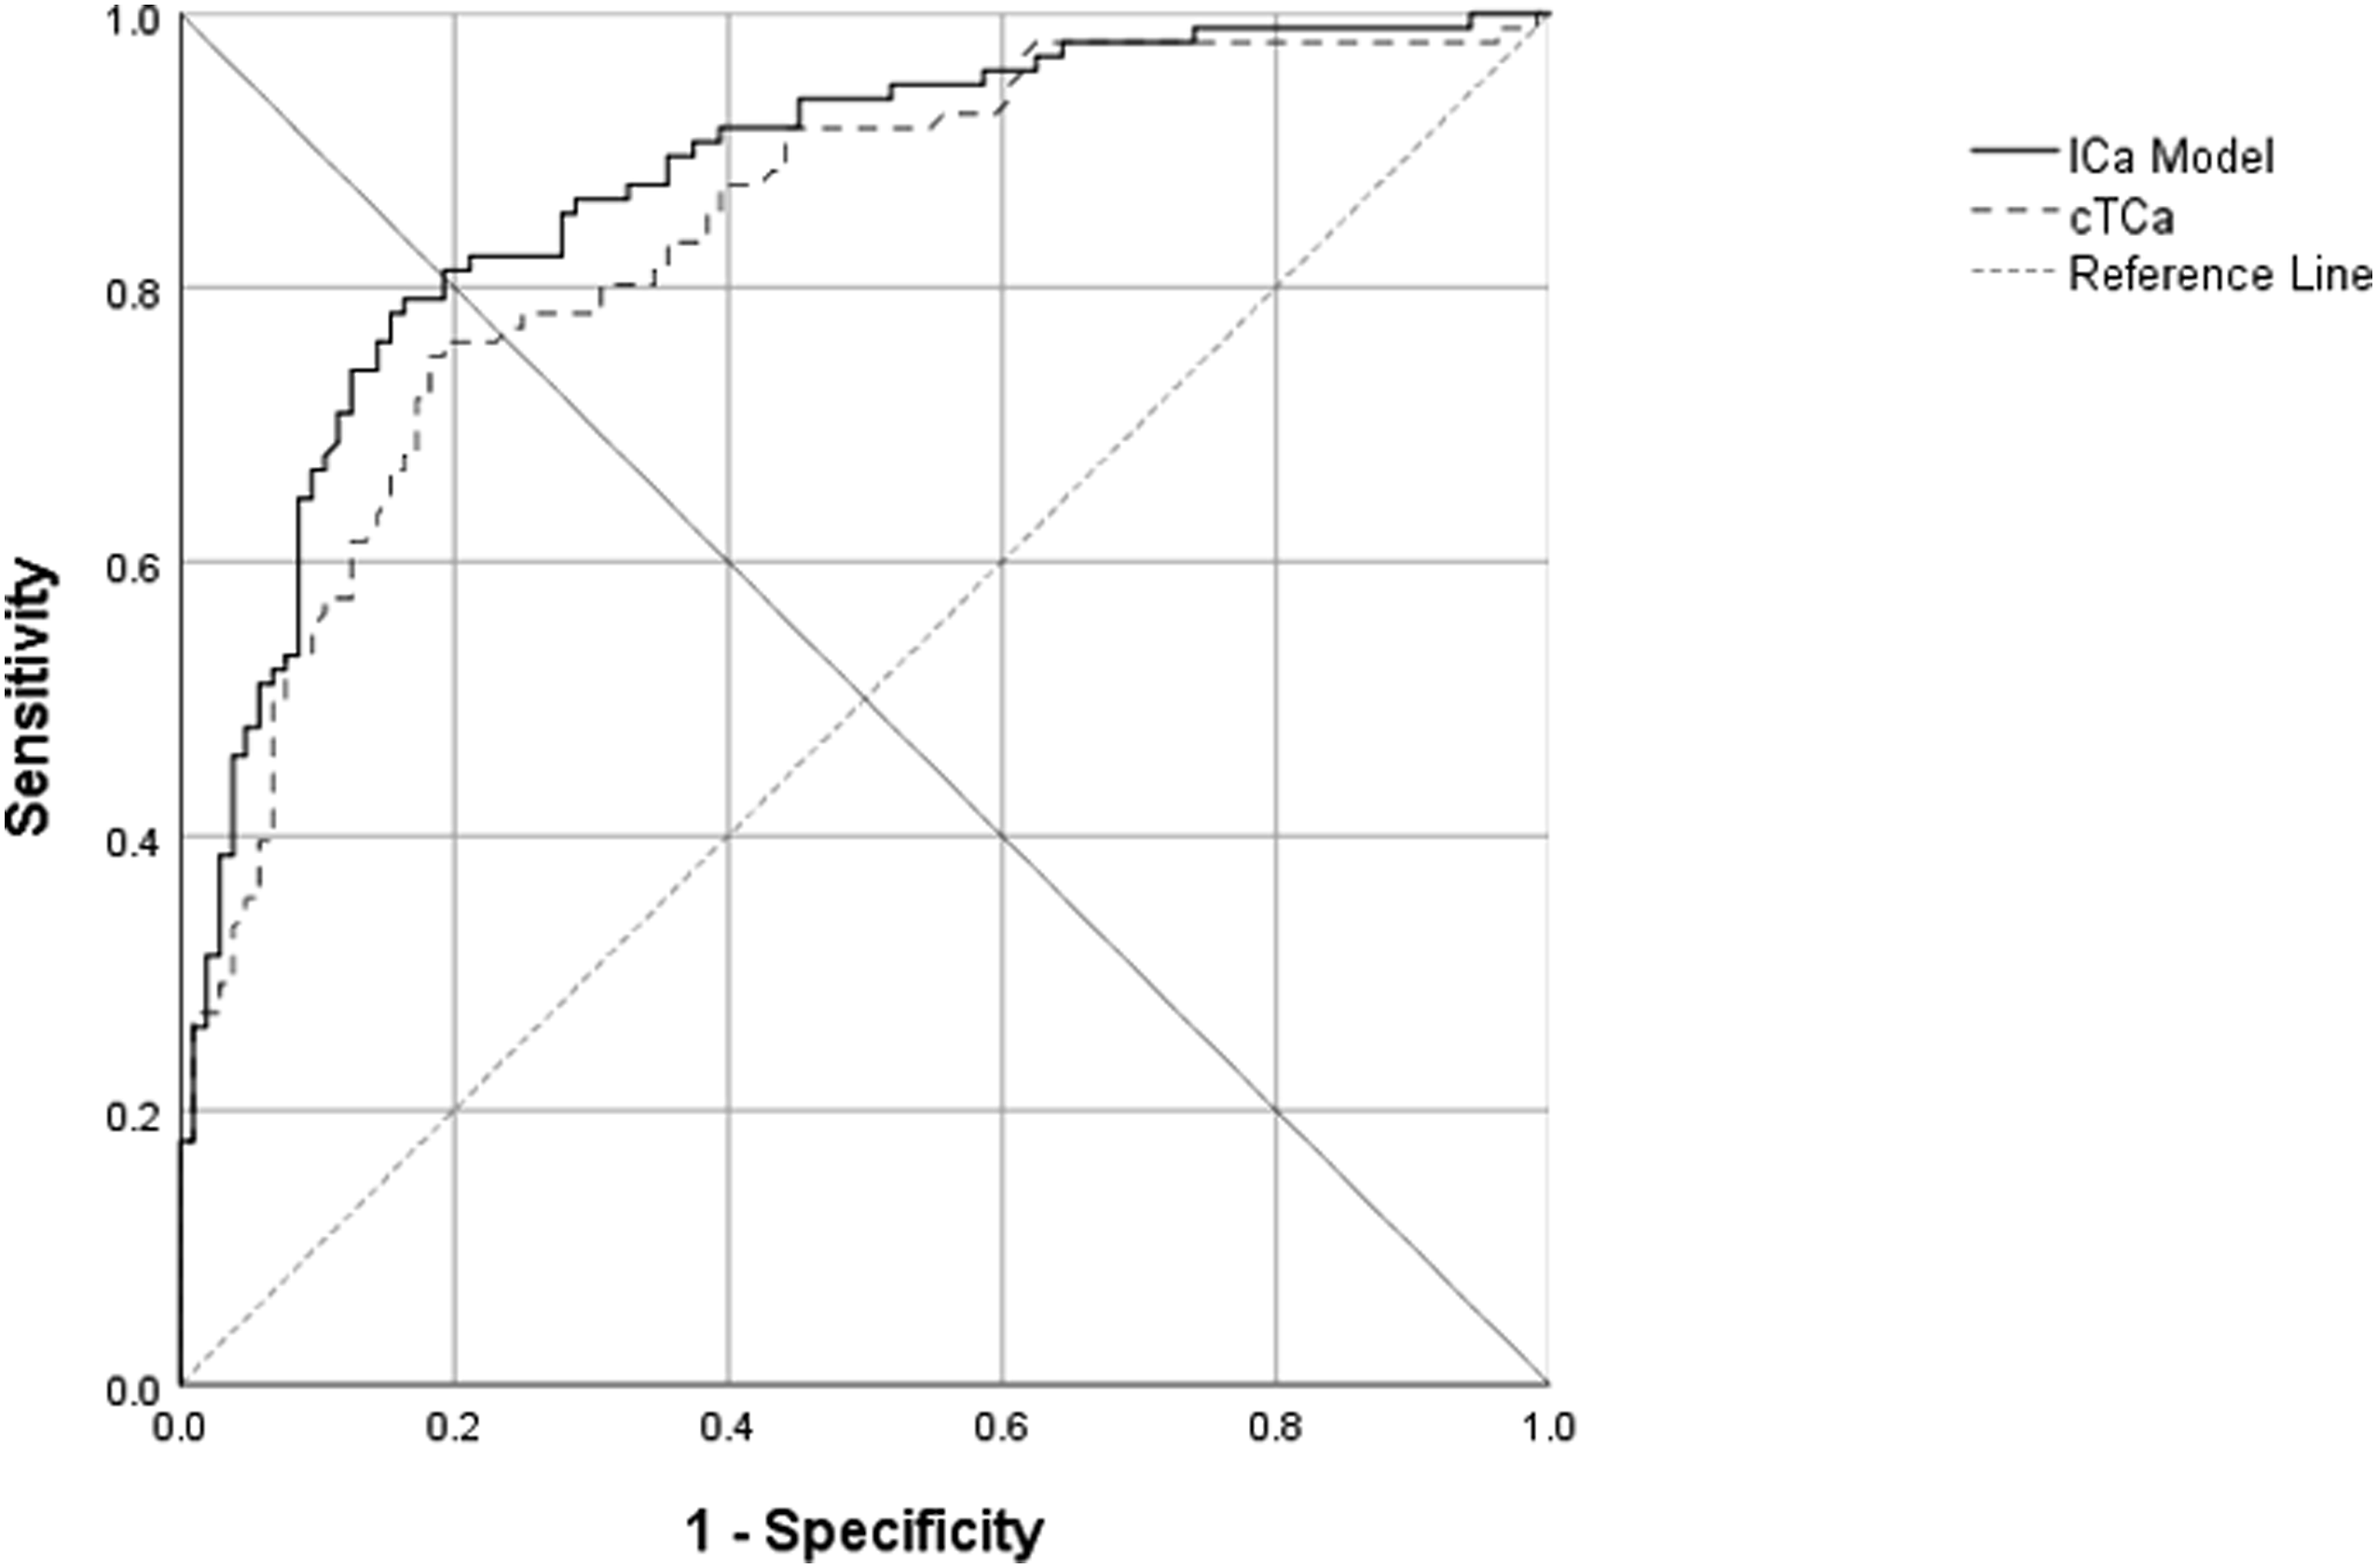
ICa values and hypocalcemia rates observed across six prediction categories of the ICa model (A) and of the cTCa equation (B).
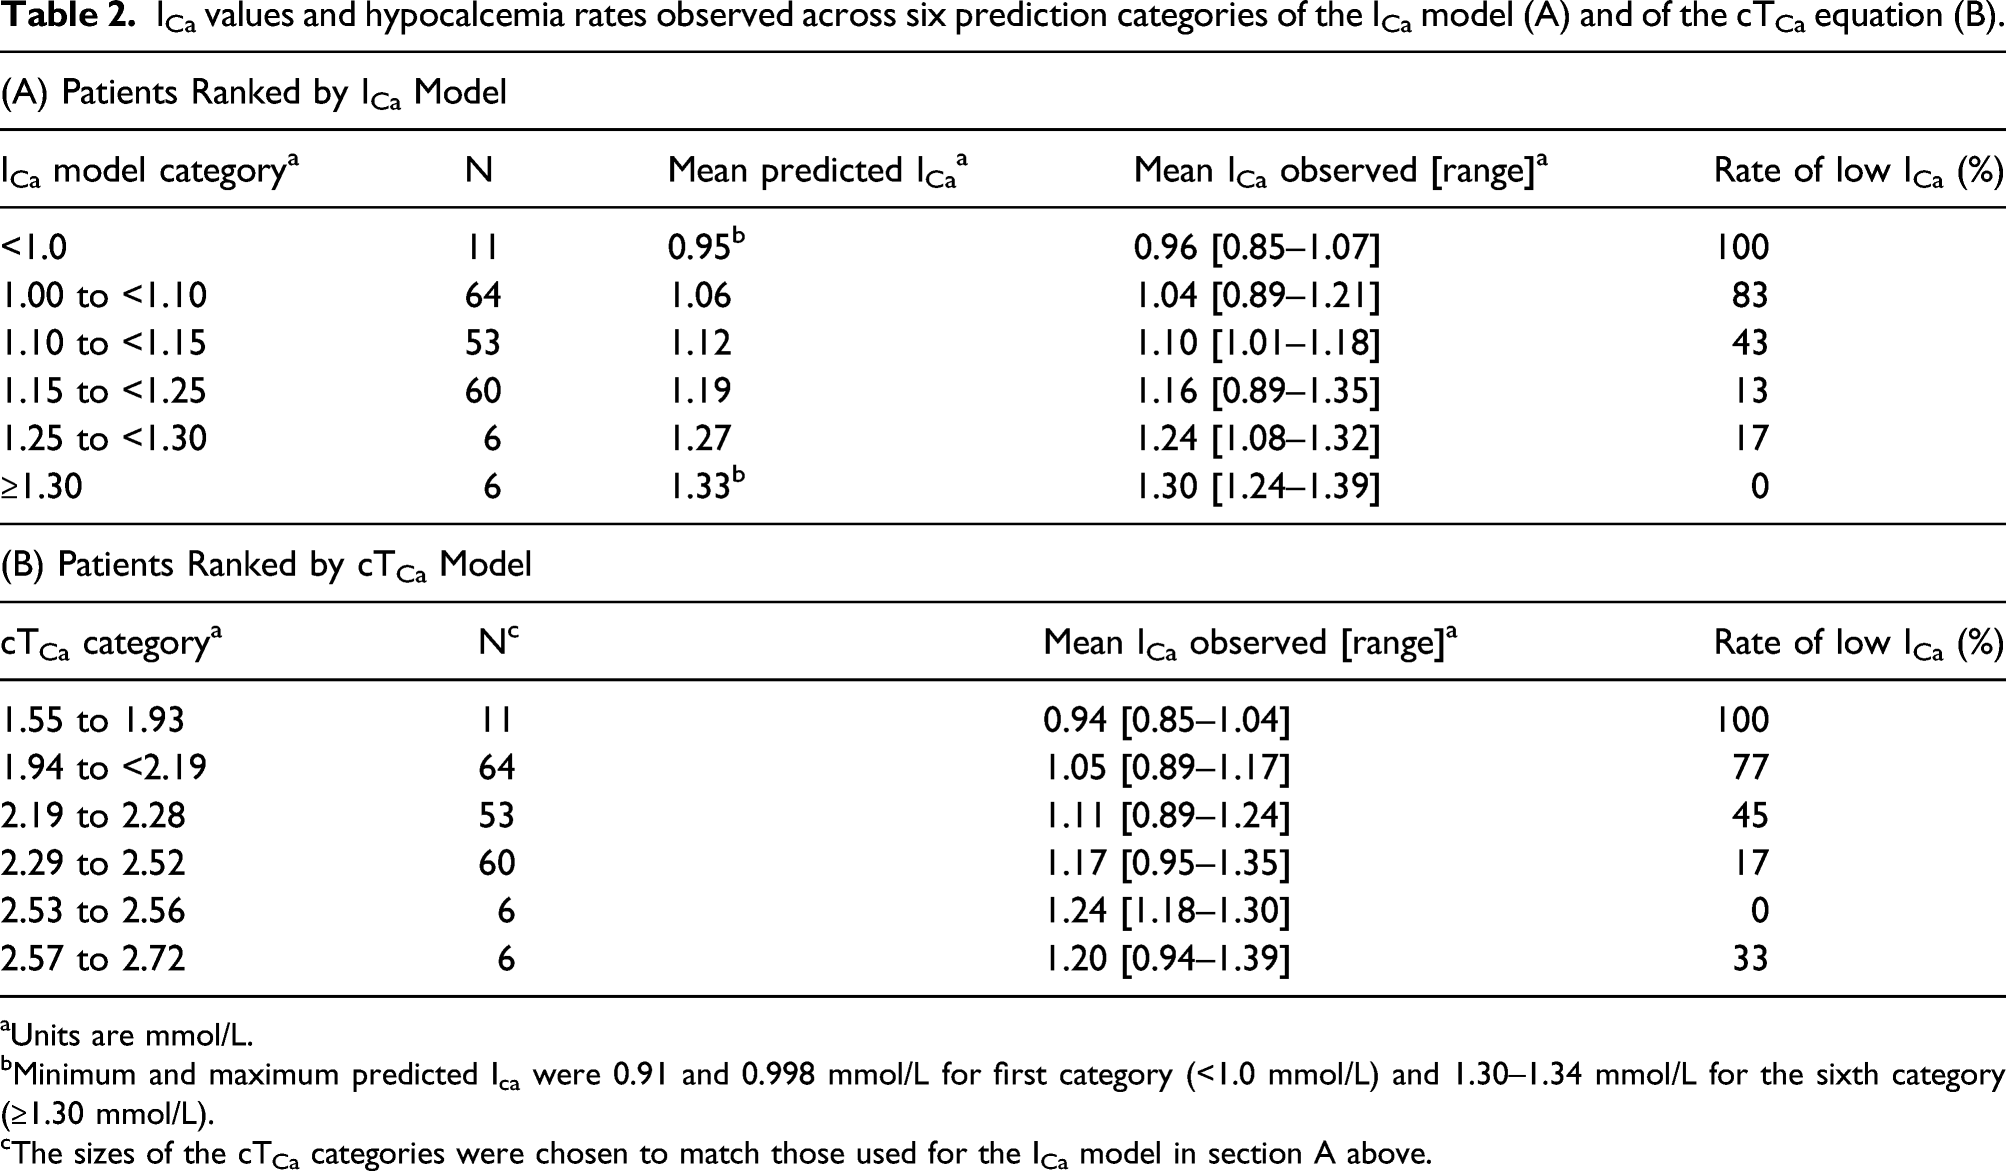
aUnits are mmol/L.
bMinimum and maximum predicted Ica were 0.91 and 0.998 mmol/L for first category (<1.0 mmol/L) and 1.30–1.34 mmol/L for the sixth category (≥1.30 mmol/L).
cThe sizes of the cTCa categories were chosen to match those used for the ICa model in section A above.
Table 2B shows the performance of cTCa with the patients ranked into subgroups identical in size to those of Table 2A. The rates of hypocalcemia observed across the 6 subgroups show, as in the ROC analysis, that ranking by cTCa was worse than ranking by the ICa model. A more significant shortcoming of cTCa, as the overall mean cTCa of 2.23 (0.18) mmol/L suggests, was its misleading calibration relative to ICa. For example, the cTCa values in the third subgroup ranged from 2.19–2.28 mmol/L. Since each value was well above the LLN for TCa, a negligible risk of hypocalcemia would be expected. However, the mean ICa in this subgroup was only 1.11 mmol/L, and the rate of hypocalcemia was substantial (45%). This problem is evident in the fourth and sixth cTCa subgroups too.
Discussion
Abnormal ICa is detected poorly by cTCa, which adjusts TCa for albumin alone.8,10-12 Since calcium binds to small anions as well as to albumin, the further adjustment of TCa for the anion gap has been suggested as a possible improvement.13,15-17 We previously derived a model that estimates ICa by adjusting TCa for the components of the anion gap and albumin. On internal validation, it was better than cTCa in the diagnosis of ionized hypocalcemia. 13 In the present study, we confirmed that ICa varies inversely with the anion gap, and externally validated our ICa model in a cohort of hospitalized patients with COVID-19 who developed concomitant renal injury or had pre-existing renal disease, conditions in which low ICa is prevalent and of clinical importance.2-4,8 On ROC analysis, the ICa model was better than cTCa in the relative ranking of patients for the diagnosis of hypocalcemia (Figure 1). This was also evident by comparing the respective hypocalcemia rate trends observed across subgroups ranked by the ICa model and by the cTCa equation (Table 2).
In absolute terms, the cTCa equation appeared to “overcorrect” TCa by assigning values well above the LLN to several subgroups in Table 3 that proved to have significant rates of ionized hypocalcemia. Since cTCa values are intended to be judged by the reference range for TCa, reliance on cTCa will cause the diagnosis to be entirely overlooked in those patients. This poor alignment of cTCa with ICa could be the result of the absence of critically ill patients in the cTCa equation’s original derivation cohort, or calibration differences between the original and the local laboratories, and it could hypothetically be mitigated by introducing a variety of local center corrections, with the simplest being a fixed reduction to cTCa of, for example, 0.17 mmol/L (equivalent to changing the reference value of albumin used in the cTCa equation from 40 g/L to the current cohort’s mean of 31.6 g/L).14,23 It is noteworthy that the ICa model required no such local correction in this external validation study. It provided accurate absolute estimates of mean ICa within the cohort overall and its subgroups, with only a small positive bias of approximately 0.02 mmol/L (Table 2). A bias of this size is clinically inconsequential, and especially so in respect to the size of the ICa model’s expected 95% PI (±0.115 mmol/L), a degree of imprecision similar to that of a recent canine ICa model. 17 Such imprecision is inevitable when regression equations are applied to individual patients, with an extreme example being the 95% PI of glomerular filtration rate estimating (eGFR) equations.24-26 Consequently, although the ICa model’s estimates are accurate on average, owing to their imprecision, they cannot replace direct ICa measurement, the gold standard for guiding treatment decisions at the individual patient level. Low ICa is associated with increased risk in COVID-19, but its measurement is relatively costly. Therefore, we propose that clinicians can more efficiently screen for low ICa and, in turn, decide when confirmatory ICa testing is needed by using the ICa model’s point prediction in one of two ways—either by simply comparing it to a cutoff (e.g., <1.15 mmol/L) or by combining it with its 95% PI to define a range (i.e., point prediction ±0.115 mmol/L) that can be used to intuitively assess the likelihood of low ICa.
Although the ICa model may not be easy to memorize, its output can be feasibly reported in metabolic panel reports, as is common practice for cTCa, anion gap, eGFR, and other forms of laboratory-based clinical decision support. Alternatively, the model output could be easily obtained with an internet-based calculator or smartphone app (one is available on the qxmd.com website). 20
The strength of our study is that it tested a prior hypothesis and that the patients studied had COVID-19 and renal failure, conditions in which identification of low ICa can have a clinical impact. Nonetheless, since most of these patients were critically ill, the application of the ICa model to less seriously ill patients, such as outpatients with ESRD, cannot be established from the present study, although the model has performed well in such patients in our informal experience. Further validation on other analytic platforms is also warranted. Other limitations of the study include its retrospective data collection, so the possibility that some VBG samples were processed with an excessive delay, potentially resulting in an artifactual fall in pH and reciprocal rise ICa, 8 cannot be excluded, and that the cohort studied was relatively small and generated by referrals.
In summary, we externally validated our linear ICa model in a novel laboratory environment by showing that it accurately predicted ICa and was better than cTCa in diagnosing ionized hypocalcemia. The point predictions of the model, together with their 95% PI, can be used to help clinicians decide when direct ICa measurement is needed in individual patients.
Supplemental Material
sj-pdf-1-acb-10.1177_00045632211049983 – Supplemental Material for Predicting ionized hypocalcemia: External validation of an ionized calcium prediction model in patients with COVID-19 and renal failure
Supplemental Material, sj-pdf-1-acb-10.1177_00045632211049983 for Predicting ionized hypocalcemia: External validation of an ionized calcium prediction model in patients with COVID-19 and renal failure by Ernie Yap, Yohannes Melaku, Isha Puri, Jie Ouyang and Philip Goldwasser in Annals of Clinical Biochemistry
Footnotes
Declaration of conflicting interests
The author(s) declared no potential conflicts of interest with respect to the research, authorship, and/or publication of this article.
Funding
The author(s) received no financial support for the research, authorship, and/or publication of this article.
Ethical approval
The protocol was approved by the SUNY Downstate Health Sciences University Institutional Review Board & Privacy Board with a waiver of the need for informed consent (IRB no. 1584306-6).
Guarantor
EY.
Contributorship
EY and PG contributed to the study design, statistical analysis, and results interpretation. YM, IP, and JO contributed to data acquisition. Each author contributed important intellectual content during manuscript drafting or revision and accepts accountability for the overall work by ensuring that questions pertaining to the accuracy or integrity of any portion of the work are appropriately investigated and resolved.
Supplemental material
Supplemental material for this article is available online.
References
Supplementary Material
Please find the following supplemental material available below.
For Open Access articles published under a Creative Commons License, all supplemental material carries the same license as the article it is associated with.
For non-Open Access articles published, all supplemental material carries a non-exclusive license, and permission requests for re-use of supplemental material or any part of supplemental material shall be sent directly to the copyright owner as specified in the copyright notice associated with the article.