
Abstract
Background
We aimed to evaluate the analytical performance and clinical diagnostic accuracy of the SuperFlex point-of-care testing (POCT) high-sensitivity cardiac troponin I (hs-cTnI) assay system.
Method
The imprecision, the limit of blank, the limit of detection, the limit of quantitation, linearity and comparability were assessed as per the Clinical and Laboratory Standards Institute guidelines. Also, the 99th-percentile reference value and diagnostic accuracy were evaluated.
Results
The reproducibility and total imprecision were 1.52–1.92% and 2.69–2.92%, respectively. Limit of blank and limit of detection were 1 ng/L and 1.8 ng/L, respectively, and limit of quantitation was 12 ng/L at 10% coefficient of variation (CV). The results met the requirements of linearity, and the correlation coefficient was 0.996. The SuperFlex POCT results had good agreement with those obtained by the Siemens Advia 2400. The CV% was 7.24% at the 99th percentile concentration (p99th) of 25.6 ng/L (95% confidence interval: 22.0–33.3 ng/L) from 620 healthy subjects. The sex-partitioned CV% and p99th were 7.15% at 27 ng/L (males; n = 308) and 7.35% at 24 ng/L (females; n = 312), respectively (P < 0.0001). The hs-cTnI detection rate of all observed healthy individuals from limit of detection to 99th was 82.57% by the SuperFlex POCT assay, 89.90% for the males and 75.48% for the females. The sensitivity, specificity, positive predictive value and negative predictive value of diagnostic performance for acute myocardial infarction were 100%, 81.25%, 57% and 100%, respectively.
Conclusions
The SuperFlex POCT system showed the analytical performance characteristics required for enabling the clinical use of a hs-cTnI assay.
Introduction
High-sensitivity cardiac troponin (hs-cTn) is increasingly being used in clinical practice owing to its high sensitivity and important role in risk stratification, prognosis evaluation and treatment guidance of acute coronary syndrome (ACS).1–3 In 2011, the European Society of Cardiology officially included it in the diagnosis and treatment guidelines of non-ST elevation acute coronary syndrome (NSTE-ACS). 4 Continuous advancements in the analytical performance of cardiac troponin (cTn) testing methods will improve rapid rule-in/rule-out diagnosis of myocardial infarction (MI). According to Apple’s scoring guidelines 5 and the International Federation of Clinical Chemistry (IFCC)’s statement, 6 the 99th percentile of cTn in healthy people should be used as the critical value to diagnose acute myocardial infarction (AMI), and a hs-cTn assay should measure at least 50% of healthy individuals above the assay limit of detection (LoD) along with a coefficient of variation (CV) of ≤ 10% at the 99th percentile. 6
Accurate and efficient AMI diagnosis is important for the early initiation of appropriate evidence-based therapy. 7 To meet the turnaround time (TAT) requirements in the emergency department (ED), several high-sensitivity cardiac troponins I and T (hs-cTnI and hs-cTnT, respectively) point-of-care (POC) assays have been developed and used in clinical practice.8–10 In this study, we assessed the analytical characterization and clinical performance of the SuperFlex point-of-care testing (POCT) system for the hs-cTnI assay and compared the same to those of the Siemens Advia 2400 system.
Materials and methods
All studies were performed using residual patient serum samples without haemolysis, lipaemia and icterus obtained from the Department of Laboratory Medicine at the Beijing Chao-Yang Hospital from June to July 2019. PerkinElmer SuperFlex (matching original reagent, Lot: 86001108770, Waltham, MA, USA) and a Siemens Advia Centaur® XP (matching original reagent, Lot: 37399149, Tarrytown, NY, USA) were used as assay systems. This study was approved by the Institutional Medical and Ethics Committee of Beijing Chaoyang Hospital.
SuperFlex POC analysis
The SuperFlex POC system consists of the following components: a sample adding module, a reading module, a magnetic bead processing module, a reagent strip loading channel, a control system and the software. A total of 100 μL of the sample was used in a single reagent strip reaction. In the SuperFlex platform, the magnetic beads are coated with an antibody (or antigen) as the reaction solid-phase carrier. The acridine ester-labelled anticardiac troponin I (anti-cTnI) antibody and the anti-cTnI antibody-coated magnetic particles were successively added into the sample hole. The cardiac troponin I (cTnI) antigen in the sample combines with the anti-cTnI antibody coated on the magnetic particle and the anti-cTnI antibody labelled with acridine ester to form a sandwich complex consisting of a magnetic particle-coated anti-cTn1 antibody/cTnI antigen/labelled-anti-cTnI antibody. After washing, the reaction complex was extracted and eluted in the reaction pore with pre-excitation solution, followed by the addition of the excitation solution to determine the luminescence value of the chemiluminescence reaction. The luminescence intensity was positively correlated with the cTnI concentration of the sample. The analyser was operated according to the manufacturer’s instructions, and internal quality controls were tested every day to ensure normal test results.
Assessment of analytical performance
Precision
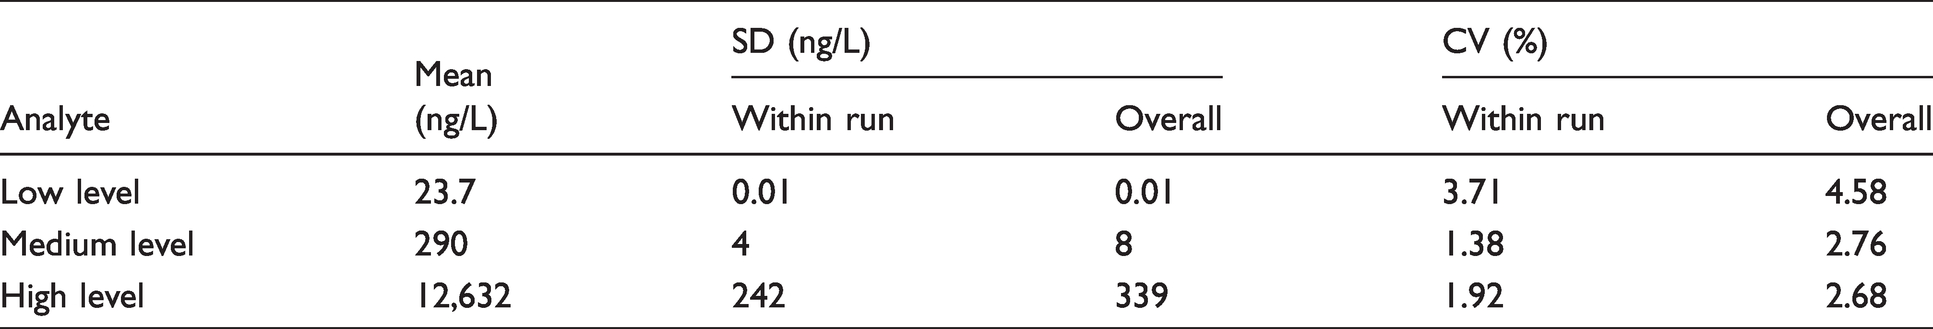
Precision testing was performed based on the CLSI EP15-A3. 11 The precision of the method was evaluated using the low, medium and high levels of cTnI controls. The concentrations were 23.7 ng/L, 290 ng/L and 12632 ng/L, respectively. Each concentration was measured four times a day on five consecutive days.
Limit of blank, LoD and limit of quantitation
The limit of blank (LoB), LoD and limit of quantitation (LoQ) were assessed based on the CLSI EP17-A2. 12 The LoB panel consisting of five blank buffer samples of different lots without cTnI was analysed in four runs per day on three consecutive days to obtain 60 total blank replicates. The LoD panel consisting of five samples of low cTnI concentrations (approximately 5 ng/L) was analysed in four runs per day on three consecutive days to obtain 60 total detection replicates. The LoQ panel consisting of 10 low-cTnI samples was measured in two runs every day, and twice every run on 10 consecutive days. The precision profile was generated by the power fit model. The LoQ estimate was determined as the measurand concentration based on an accuracy goal of within-laboratory precision of 10% CV.
Linearity
Linearity was assessed based on the CLSI EP06. 13 Two samples with high (96,750 ng/L) and low (6.5 ng/L) cTnI concentrations were mixed in different proportions to generate 11 samples. Each sample was detected repeatedly, and the mean value was calculated. The regression equation was obtained by statistical analysis with the expected concentration values.
Method comparison
Referring to CLSI EP9 evaluation scheme, 14 a total of 123 serum samples (cTnI ranging from 0 to 40,000 ng/L) were analysed on the SuperFlex POC and Siemens Advia Centaur® XP analysis systems. The cTnI results obtained with the SuperFlex POC were compared with those obtained with the Siemens Advia Centaur® XP. The Passing-Bablok regression and Bland-Altman plot were used to further analyse the results. The calibrators of SuperFlex POC and Siemens Advia Centaur® XP analysis systems were measured together with 25 patient samples for cTnI. The commutability of the two calibrators between the two analysis systems was estimated. The calibrators with results inside the 95% prediction intervals were considered commutable. 15
Reference-range study
We used SuperFlex POC to analyse the residual patient serum samples from 620 healthy subjects (308 males and 312 females, age range: 21–92 years). The exclusion criteria for the healthy population were: age <18 years, vascular or cardiovascular disease, kidney disease, infectious disease, blood system disease, diabetes mellitus, cancer and other diseases. The exclusion methods included clinical physical examination, biochemical detection, chest X-ray fluoroscopy and echocardiography. The 99th percentile was calculated in all individuals and the sex-partitioned groups according to CLSI EP28-A3 16 and the IFCC recommendations. 17 The 95% confidence interval (CI) was also computed based on binomial probability. The Mann-Whitney test was used to determine the between-sex differences in cTnI concentrations.
Diagnostic accuracy
The diagnostic performance was evaluated based on the diagnostic cut-off value of AMI, and sex-specific subgroups were assessed by sex-specific 99th percentile concentrations previously established using healthy populations.
Statistical analysis
The MedCalc v19.0.6 software and MS Excel 2010 were used for statistical analysis.
Results
Precision
For the SuperFlex POCT precision study, the within-run CVs were 3.71%, 1.38% and 1.92% for low, medium and high concentration cTnI quality control materials, respectively. Accordingly, the total precision values were 4.58%, 2.76% and 2.68%, respectively (Table 1).
Precision evaluation results for SuperFlex cTnI measurements.
LoB, LoD and LoQ
The LoB was determined by assay to be 1 ng/L.
The LoD panel consisting of five samples of low cTnI concentrations (approximately 5 ng/L) was analysed and each sample was tested 12 times, i.e. to give a total of 60 results, and the pooled SDs was calculated as 0.5 ng/L.
LoD was calculated according to the formula: LOD = LOB + cβSDs.
cβ = 1.645/(1–1/(4 × f)) where
f = N(total number of all sample results)–n(number of samples) and therefore:
LOD=LOB + cβSDs = 1 ng/L + 1.652511 ×
0.5 ng/L = 1.8 ng/L
60–5 = 55;
cβ1.645/(1–1/(4 × 55))=1.652511
To calculate the LoQ value at 10%, the relationship between the error of the measurement and cTnI concentrations were interpolated by means of a reciprocal regression equation (Figure 1). The LoQ at 10% CV was calculated to be 12 ng/L.
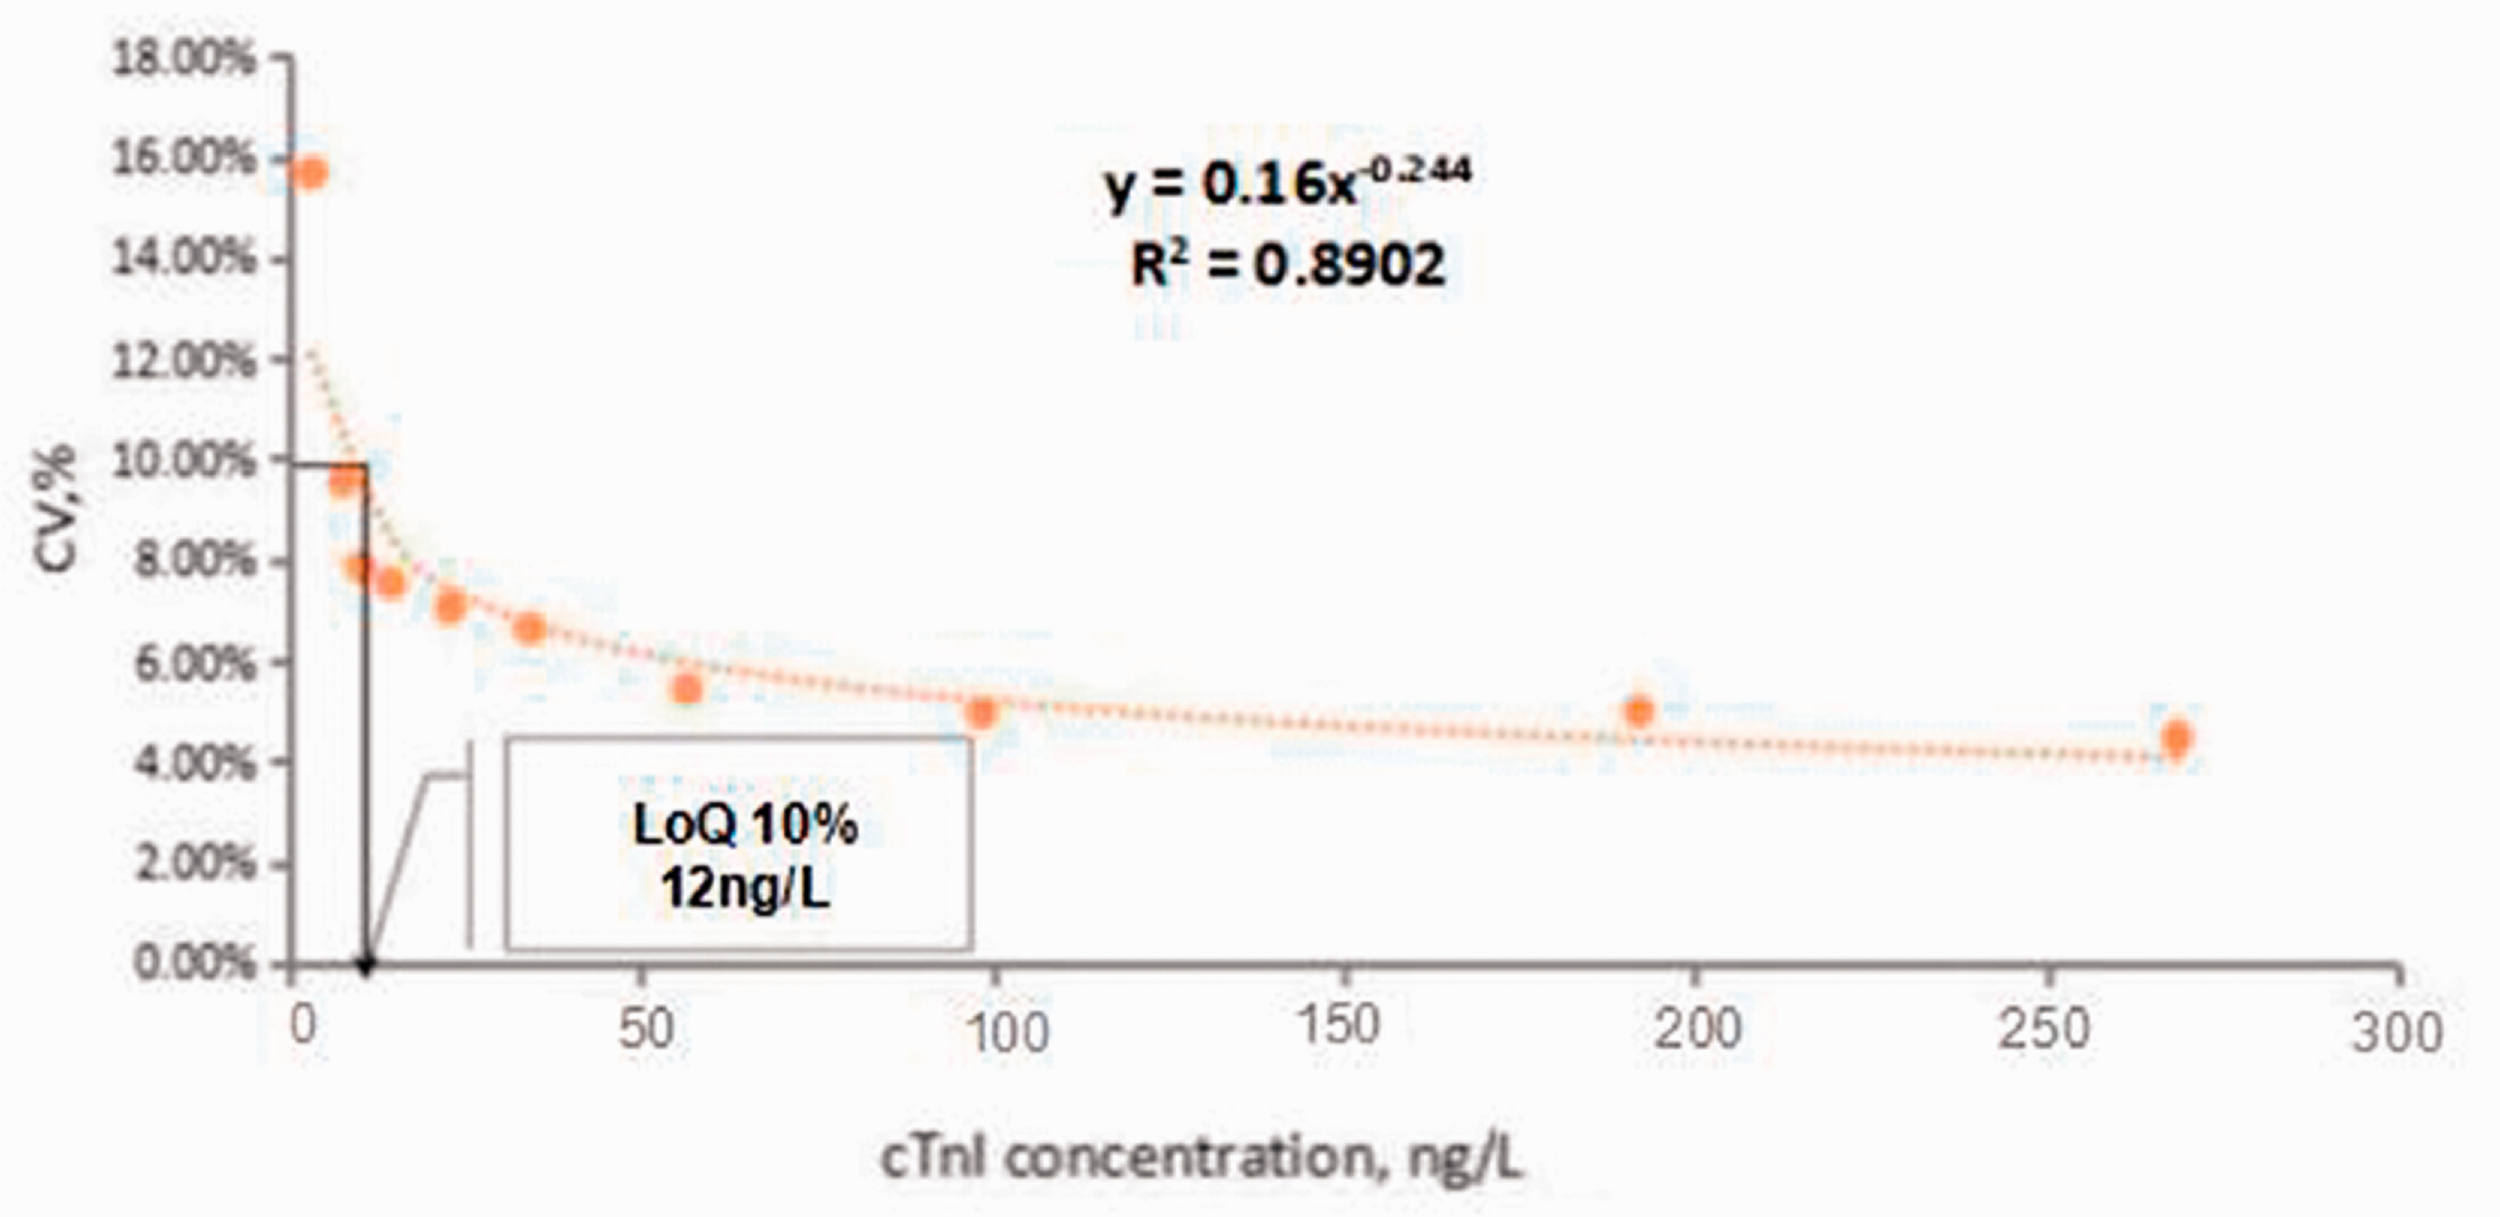
Imprecision profile (as %CV) vs. measurement concentration for the SuperFlex POC hs-cTnI method. The LoQ estimate was determined as being 10% CV.
Linearity
The SuperFlex POCT assay was linear within the range of cTnI concentrations from 96,750 ng/L to 6.5 ng/L. The regression equation between the measured value (Y) and the expected value (X) is as follows: Y = 0.975 × X + 3454, with a correlation coefficient of 0.991.
Correlation and commutability study
The Passing-Bablok regression analysis (Y = 0.6413 + 0.7766X, R = 0.97, n = 123) did not identify the regression between the (Y) and (X) cTnI values as being significantly different. The Bland-Altman plot showed mean difference of −1620.6 (SuperFlex POCT vs. Siemens device) with the 95% limits of agreement (LoA) of −7.3825%–4.1413% (Figure 2). The results of SuperFlex POCT agreed well with those obtained using the Siemens device. The two test system calibrators were out of the 95% prediction intervals and were incommutable for SuperFlex POCT vs. the Siemens device (Figure 3).
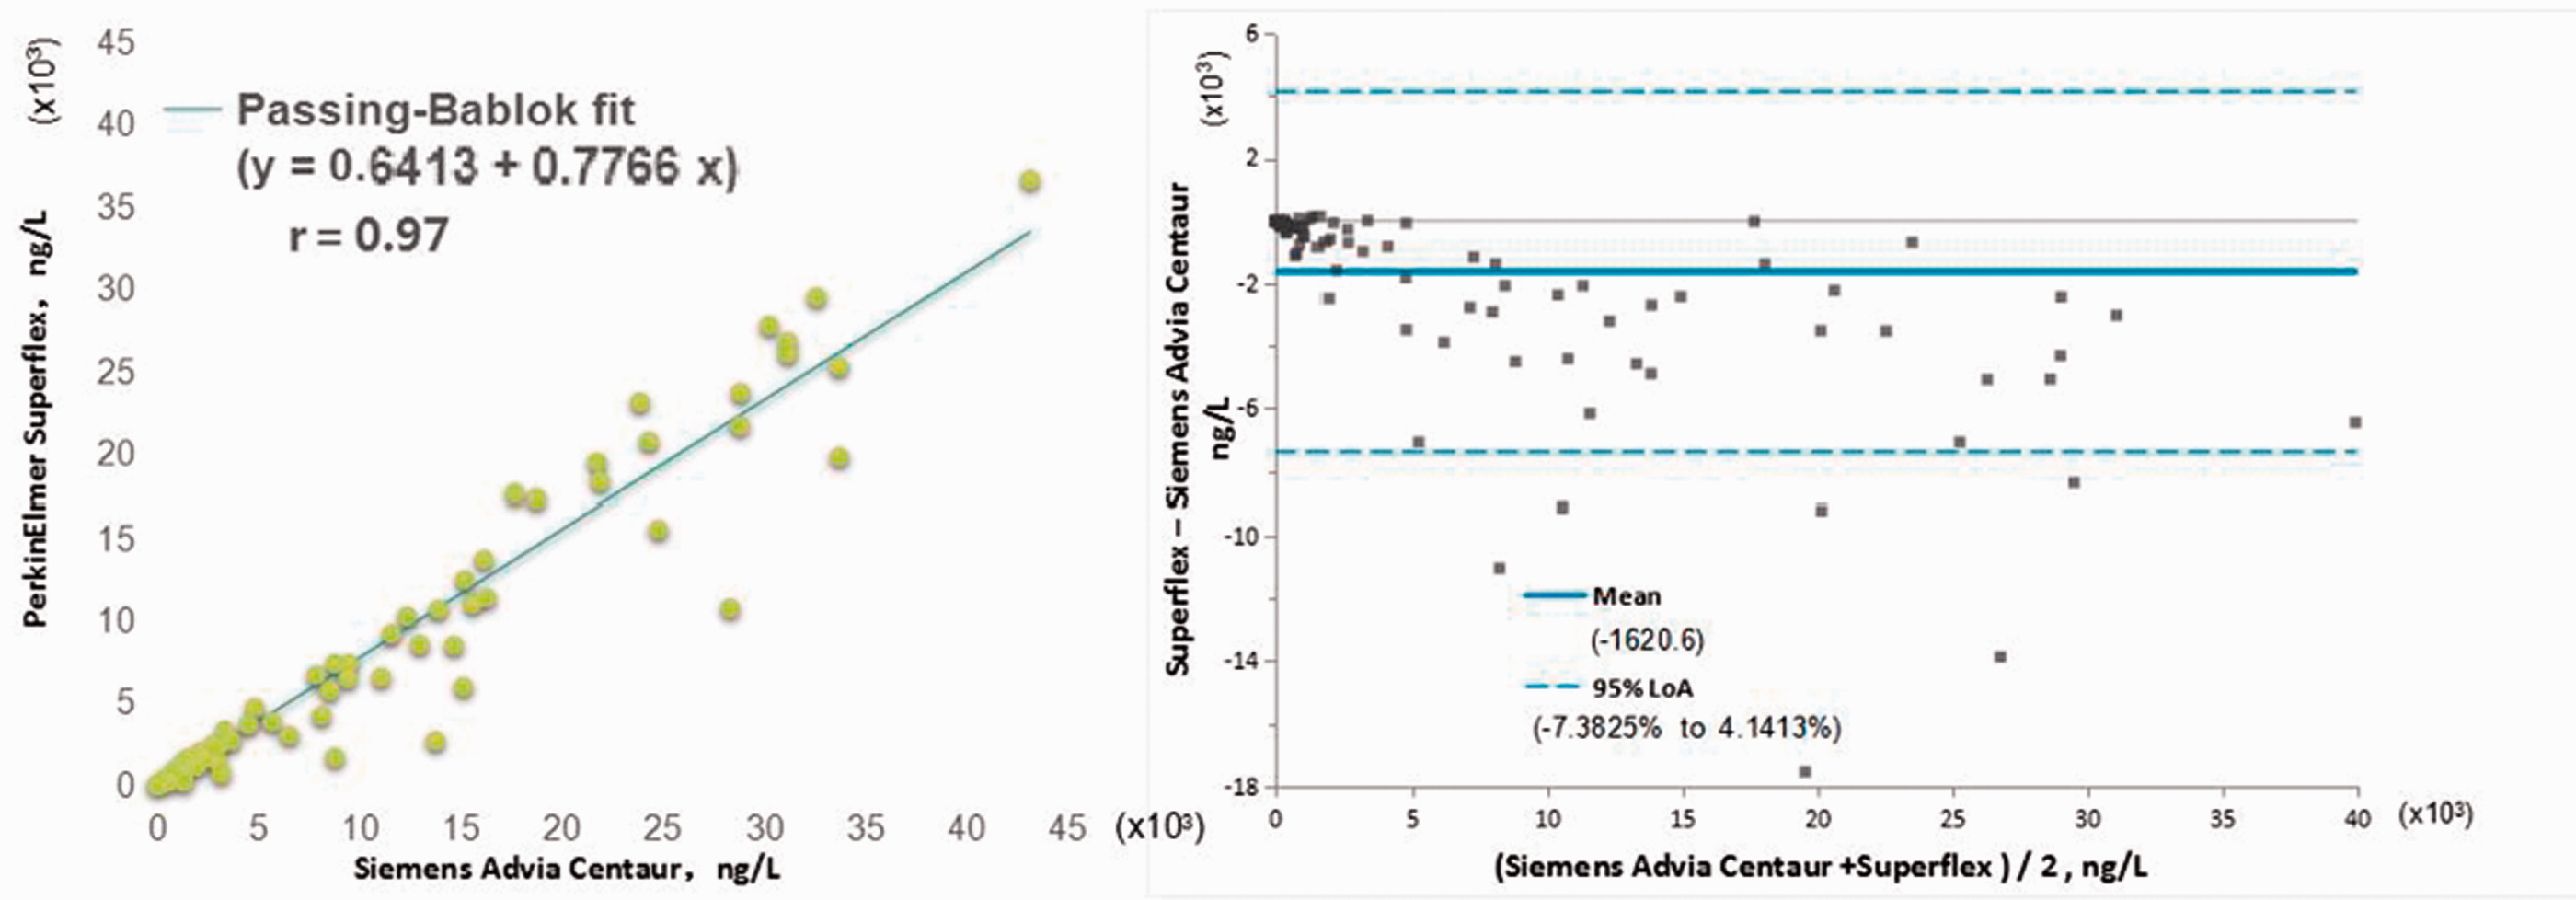
Passing-Bablok regression and Bland Altman plots of the differences between PerkinElmer SuperFlex POC hs-cTnI and Siemens Advia Centaur hs-cTnI.
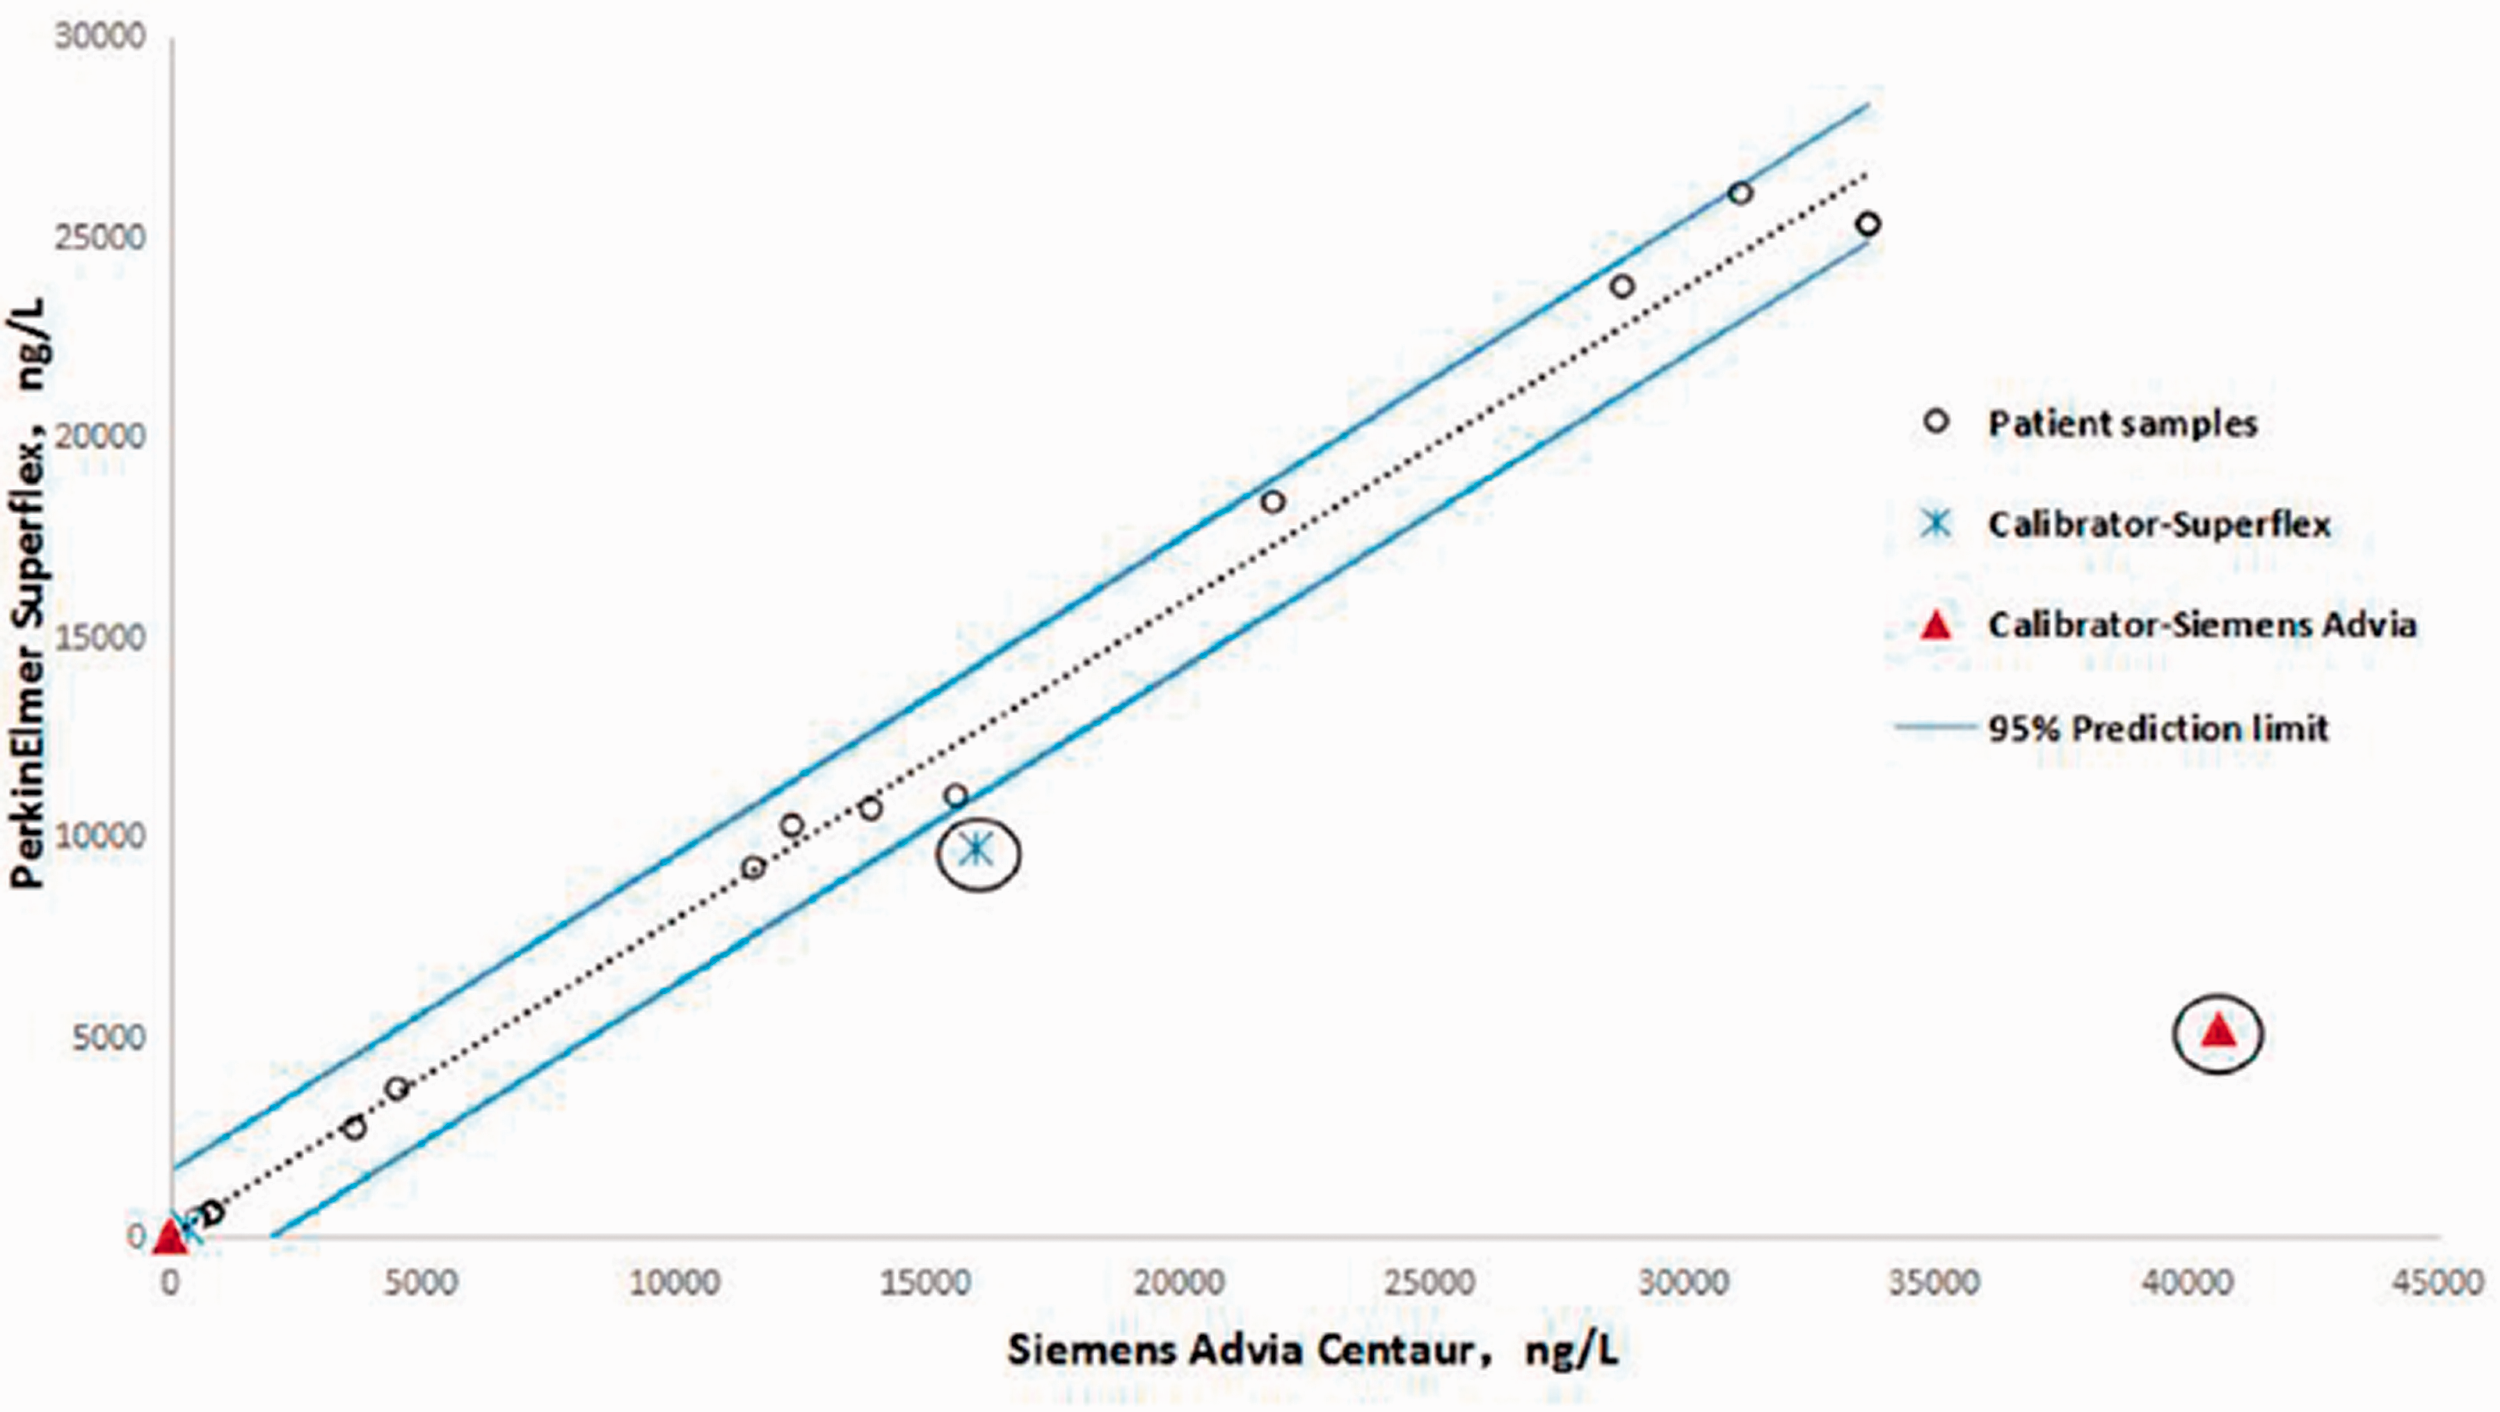
Commutability of the two test system calibrators for cTnI between PerkinElmer SuperFlex POC system and the Siemens Advia Centaur system. The dashed lines indicate the limits of the 95% prediction intervals. The cross represents the SuperFlex calibrators, and the triangle represents the Siemens Advia Centaur calibrators.
99th percentile concentration and the associated imprecision
Samples with cTnI values higher than the 99th percentile were selected and diluted in proportion to obtain 10 samples with different concentrations: 289 ng/L, 196 ng/L, 98 ng/L, 57 ng/L, 34 ng/L, 23 ng/L, 14 ng/L, 10 ng/L, 8 ng/L and 3 ng/L. The concentration levels ranged from close to the detection limit, to higher than the 99th percentile concentration. Each sample was divided into 20 parts and frozen at −20°C.
One sample of each concentration was detected twice a day for 20 consecutive days. The mean value, SD and CV% of samples at each concentration level were calculated. The CV% was 7.24% at the 99th percentile concentration (p99th) of 25.6 ng/L (95% CI: 22.0–33.3 ng/L) from 620 healthy subjects. The sex-partitioned CV% and p99th were 7.15% at 27 ng/L (males; n = 308) and 7.35% at 24 ng/L (females; n = 312), respectively. The histograms of distributions of reference values are displayed in (Figure 4). The difference between the central tendencies of both the sex- and age-specific distributions was significant (P < 0.0001). The SuperFlex POCT assayed hs-cTnI concentrations were > LoD in 82.57% of all observed individuals, including in 89.90% and 75.48% of males and females, respectively.
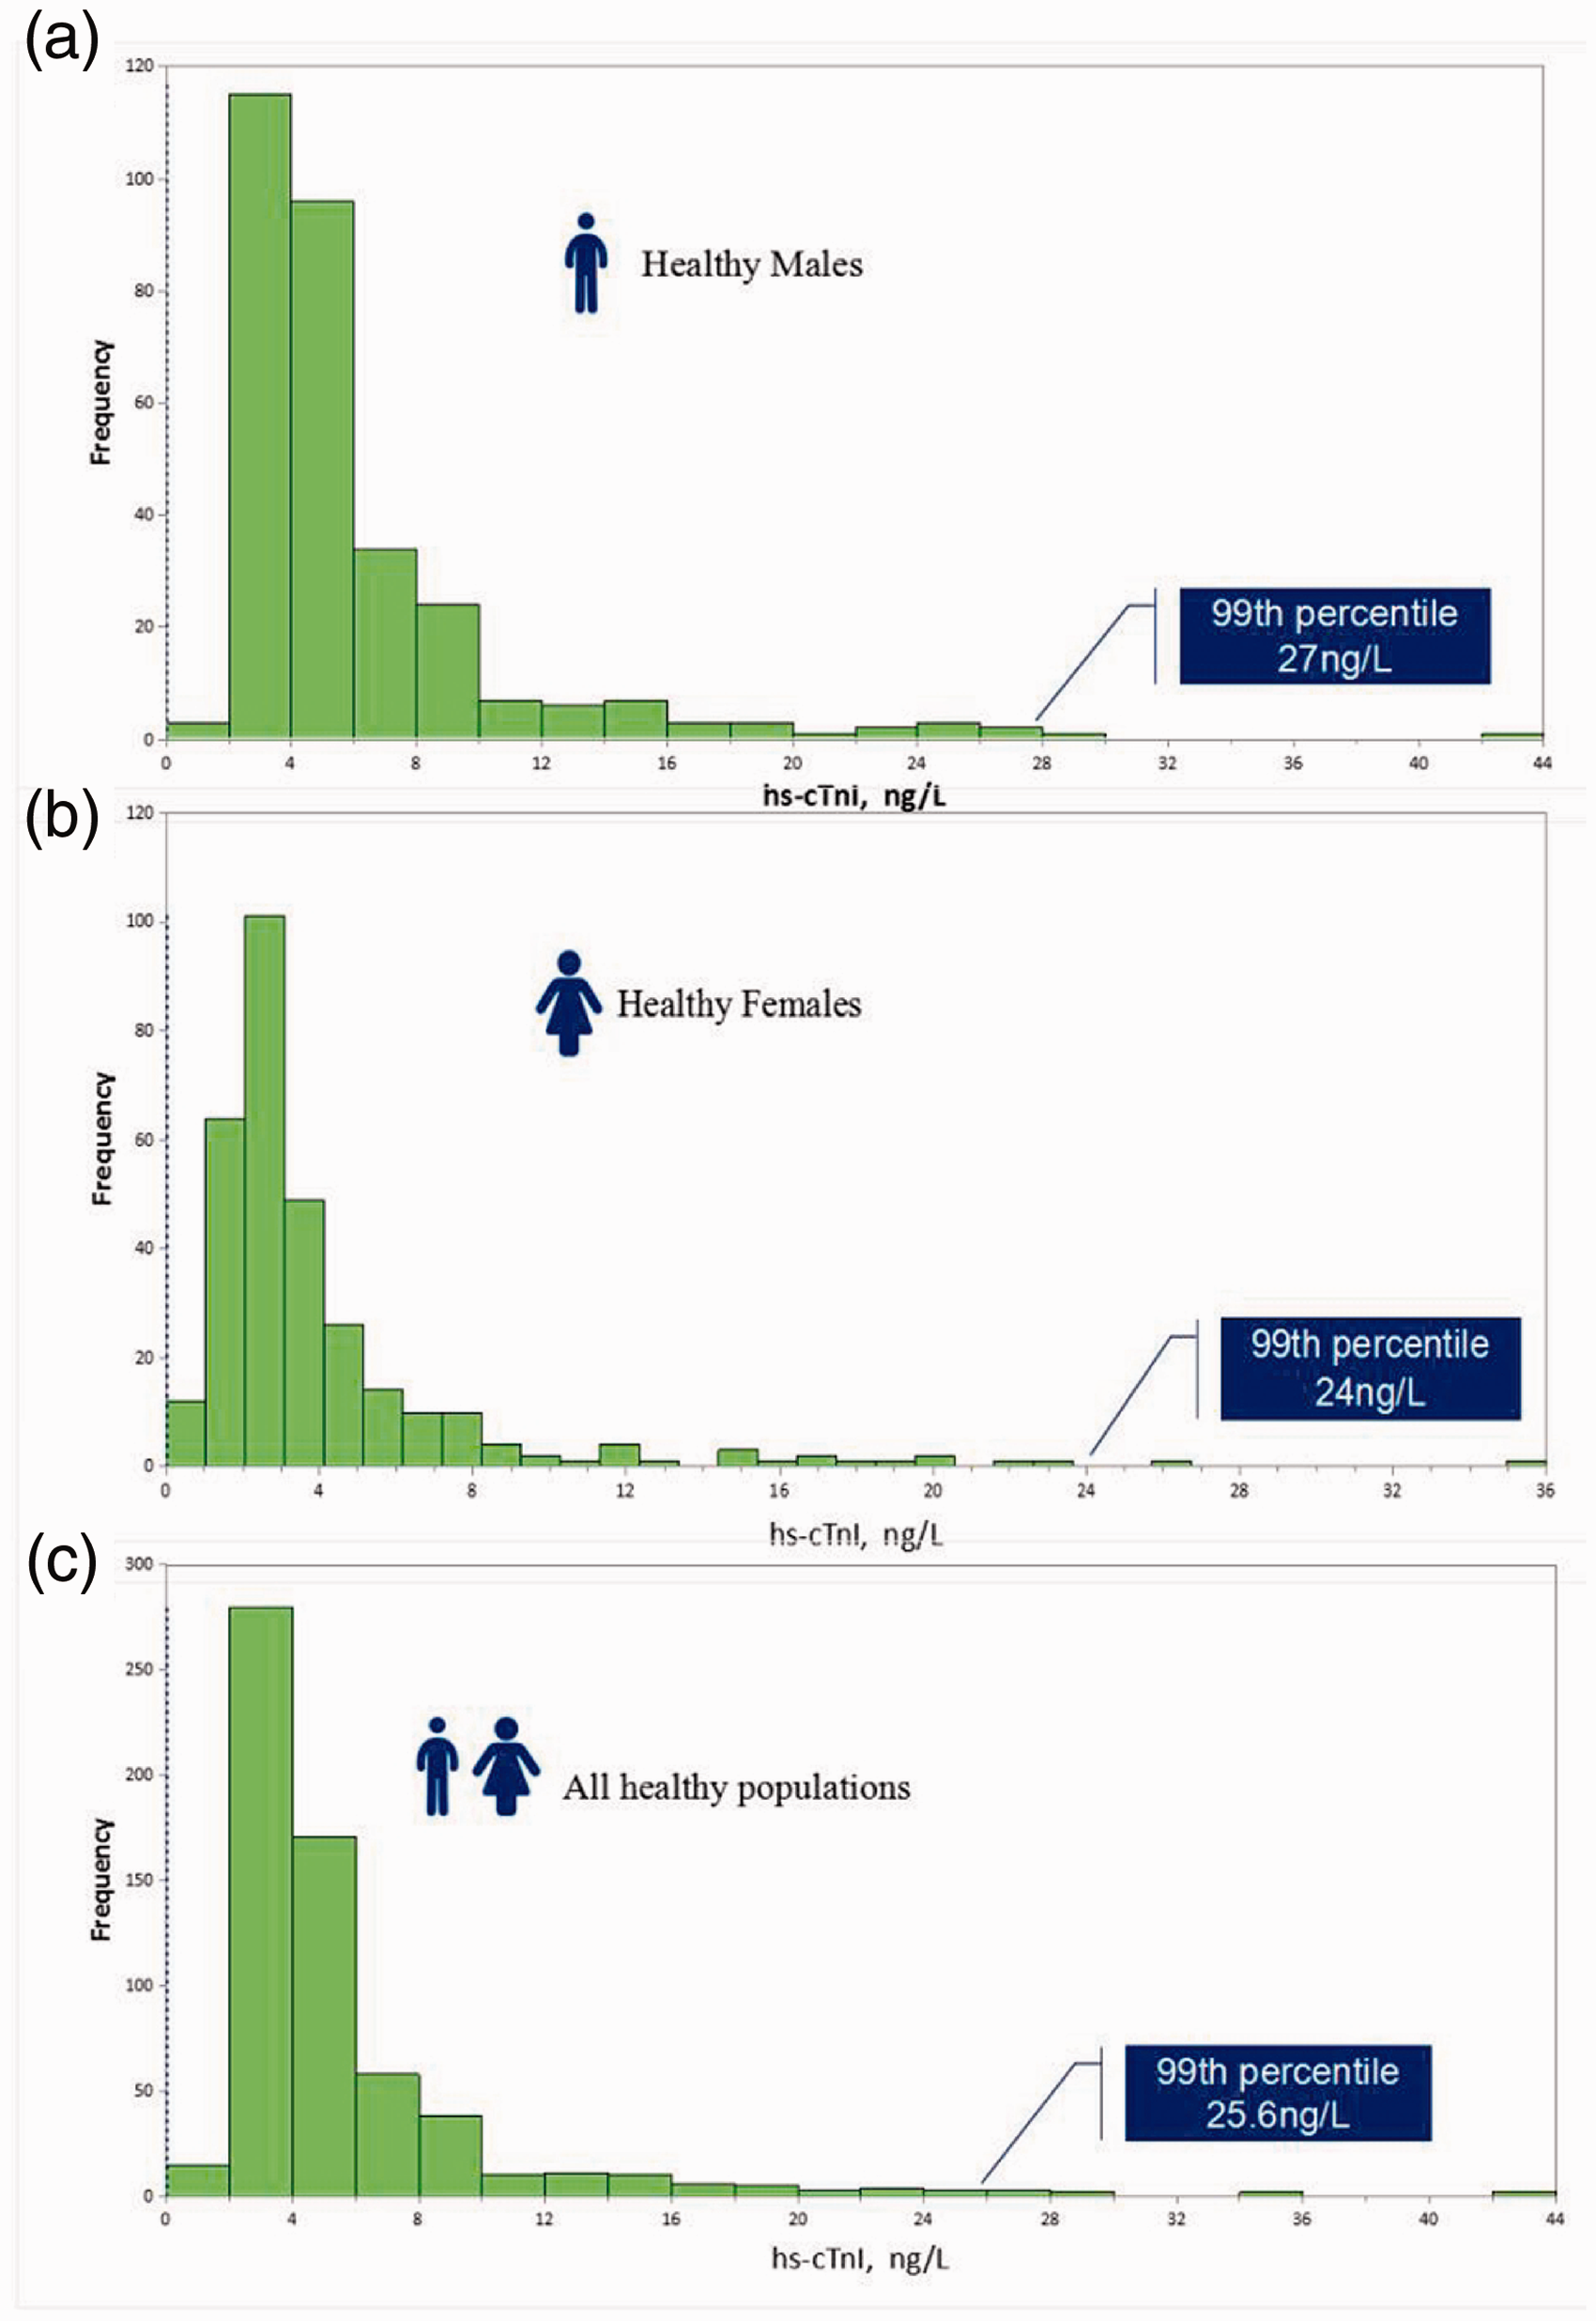
Histograms representing distributions of reference values. Distribution of reference values in: (a) in reference males, (b) in reference females, (c) all reference individuals.
Diagnostic performance
This study included 200 patients with chest pain, including 40 patients with MI, whose ages ranged from 36 to 91 years old, and comprised 30 male and 10 female patients. MI was diagnosed for this patient group with the detection of a rise and/or fall of cardiac biomarker values and dynamic evolution of electrocardiogram including new or presumed new significant ST-segment-T wave (ST-T) changes or new left bundle branch block or development of pathological Q waves. The cTnI of these 40 cases of MI were positive. The cTnI of 30 cases from 160 cases of non-MI individuals were positive. The diagnostic performance of the SuperFlex POCT assay was calculated by sensitivity, specificity, positive predictive value (PPV) and negative predictive value (NPV). Clinical sensitivity was calculated as the number of patients correctly diagnosed with MI/total number of patients with MI = 40/40 = 100%. The specificity was calculated as patients correctly diagnosed as non-MI/number of negative tests = 130/160 = 81.25% (Table 2). PPV (i.e. probability of a diagnosis of MI in patients with elevated cTnI) = 40/70 = 57%, indicating that approximately 57% of patients with cTnI ≥ 25.6 ng/L (p99th) were diagnosed with MI. The NPV (i.e. probability of a diagnosis of non-MI in patients without elevated cTnI) = 100%, indicating that patients with a cTnI level of less than 25.6 ng/L were diagnosed with diseases other than MI (Table 2).
Diagnostic performance of SuperFlex cTnI measurements.
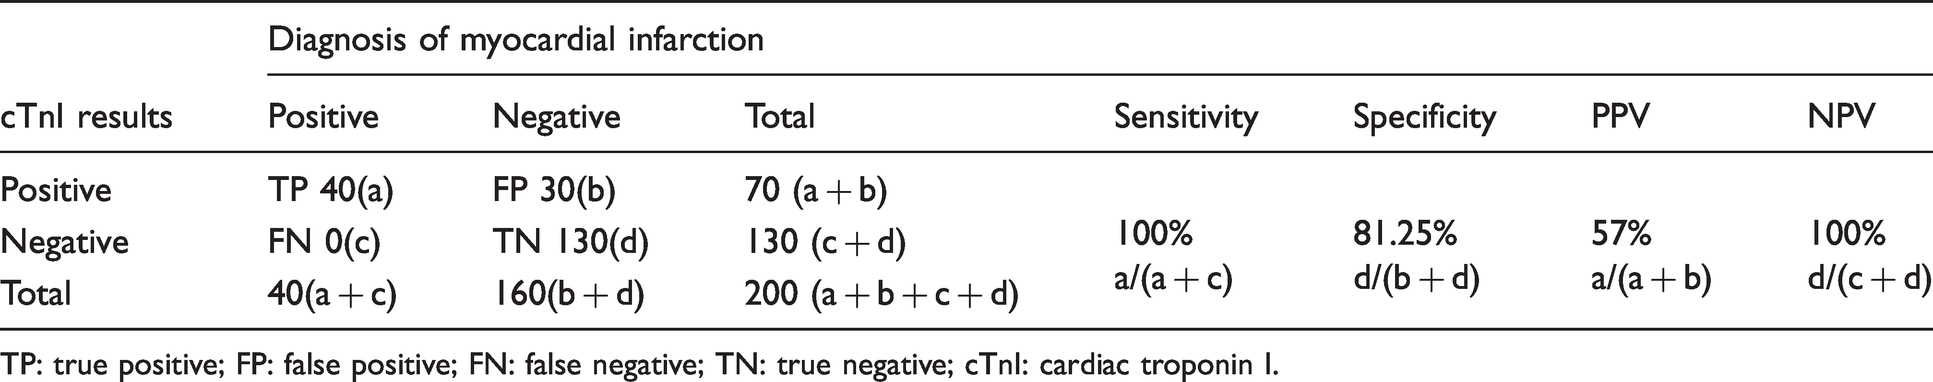
TP: true positive; FP: false positive; FN: false negative; TN: true negative; cTnI: cardiac troponin I.
Discussion
The hs-cTnI is one of the optimum markers of MI in patients with NSTE-ACS. Large multicentre studies have shown that hs-cTnI can increase the accuracy of MI diagnosis, especially in the early stage of chest pain and can achieve faster rule in and rule out. POC cTn testing is frequently implemented to reduce the TAT for reporting results for rapid and clinically effective assessment of ACS and diagnosis of AMI. Therefore, it is vital to evaluate the performance of the POC cTn assay and to compare it to that of central laboratory cTn assays to ensure analytical quality. 18
At present, the commonly used clinical detection methods of troponin include ELISA, colloidal gold and chemiluminescence methods. Although ELISA has been used in clinics for nearly 20 years, it still has some deficiencies, such as poor quantitative accuracy, long operation time and low automation. The colloidal gold method is flexible and simple, but its sensitivity is low and specificity is poor. The SuperFlex system is a magnetic particle chemiluminescence immunoassay for cTnI and combines chemiluminescence technology with immunomagnetic particles, resulting in higher detection sensitivity and specificity. It achieves better performance parameters, has high flexibility and can carry out different tests at the same time or operate a single test with a simple liquid cleaning system to obtain a shorter detection time and greatly reduce cost. Therefore, it is very important to improve the existing technology to allow for more effective clinical detection of cTnI.
According to the proposal by Apple, 5 the first-tier criteria designate analytical sensitivity for various generations of cTn assays based on the percentage of the normal population with measurable values above the LoD but below the 99th percentile reference limit. The four generations of cTn assays are as follows: Level 1, contemporary, <50%; Level 2, first generation, hs, 50 to 75%; Level 3, second generation, hs, 75 to 95%; and Level 4, third generation, hs, ≥95%. The second tier of criteria designate cTn assay imprecision as ‘guideline acceptable, CV ≤ 10%’, ‘clinically useable, 10% < CV ≤ 20%’ or ‘not acceptable, CV > 20%’ based on imprecision. The SuperFlex POCT assay measured hs-cTnI concentrations above the LoD in 82.57% of all observed individuals with a CV of 7.24% at the 99th percentile concentration. This means it meets the requirements for designation as a second-generation high sensitivity assay, making it comparable with the large platforms of popular manufacturers. 6 , 19 Twenty-five single fresh frozen serum samples and two calibrators for hs-cTnI analysis were measured using the SuperFlex POCT method and Siemens method for the comparability and commutability study. The two calibrators were not commutable for the two methods. The current cTnI calibrators of different materials selected by each manufacturer lead to inconsistent cTnI results between assays and methods for reasons outside of variations of detection and capture antibodies with different antigen epitope specificities. The lack of commutability of calibrators may be one reason for the incomparable results. Therefore, further efforts should be focused on the standardization and harmonization of cTnI detection, with the establishment of commutable cTnI calibration traceability.
For the SuperFlex POCT high sensitivity troponin assays, the results indicate men have higher 99th percentile concentrations than women and support the use of sex-specific cut-offs. The clinical significance of sex-specific cut-offs for hs-cTn assays has been reported in other studies.20–22 In the current study, we found 30 patients (18.75%) with cTnI ≥ 25.6 ng/L from 160 non-MI patients. Among these 30 patients, 100% (30/30) were found to have heart diseases, such as angina pectoris, myocarditis, heart failure, atrial fibrillation, severe coronary heart disease and tachycardia. The test results showed that cTnI may also increase in non-MI patients with coronary artery or non-coronary artery disease with MI.
The limitation of the study is that the sample size is small for the clinical performance evaluation of the SuperFlex POCT hs-cTnI assay, which will result in some difference in test results. Therefore, a future study should be performed with a larger patient sample.
In conclusion, this study showed that the SuperFlex POCT hs-cTnI assay meets the performance characteristics of a high sensitivity assay and it can be comparable with the large platforms of popular manufacturers.
Footnotes
Declaration of conflicting interests
The author(s) declared no potential conflicts of interest with respect to the research, authorship, and/or publication of this article.
Funding
The author(s) disclosed receipt of the following financial support for the research, authorship, and/or publication of this article: This study was supported by the National Natural Science Foundation of China (NNSFC) (81501802), the Beijing Municipal Administration of Hospitals Clinical Medicine Development of Special Funding Support (ZYLX202137 and ZYLX201811), and 1351 Talent Training Plan (CYMY-2017–01 and CYXX-2017–01). The views expressed are those of the authors and not necessarily those of the aforementioned funders, the NNSFC, or the Beijing Municipal Administration of Hospitals.
Ethical approval
This study was approved by the Institutional Medical and Ethics Committee of Beijing Chaoyang Hospital (REC reference 2018-ke-101).
Guarantor
QTW.
Contributorship
Qingtao Wang conceived the study. Rui Zhang developed the method and wrote the first draft of the article. Jie Shi, Rui Zhao and Yichuan Song collected patients’ information and samples and they were involved in statistical analysis. All authors reviewed and edited the article and approved the final version of the article.