
Abstract
Background
Combined lipid and glucose point-of-care testing (POCT) devices could facilitate widespread population screening for cardiovascular disease (CVD) and diabetes as part of the NHS Vascular Risk Assessment and Management Program (NHS Health Checks). An evaluation of the Cholestech LDX and CardioChek PA POCT analysers was performed in collaboration with the Wolverhampton City Primary Care Trust (PCT).
Methods
Intra-/inter-batch imprecision, between-analyser variation and the effect of haematocrit and ascorbic acid assay interference were investigated. Accuracy of the POCT capillary whole blood total cholesterol (TC), high-density-lipoprotein cholesterol (HDL-C) and glucose measurements was estimated by comparison with those from the laboratory analysis of paired venous samples. POCT usability and clinical governance were also assessed.
Results
The LDX exhibited lower intra- and inter-batch imprecision and external quality assessment (EQA) scheme between-analyser variation for the measurement of TC, HDL-C and glucose when compared to the CardioChek. Ascorbic acid negatively interfered in all three assays on both POCT analysers and results reported by the CardioChek were influenced by the specimen haematocrit. The LDX displayed closer agreement with the laboratory methods for the measurement of TC and HDL-C but both the LDX and the CardioChek displayed positive bias for the measurement of glucose.
Conclusions
POCT has clear advantages for delivering NHS Health Checks over the laboratory-based approach although device performance does differ. Users should also be aware of the potential clinical governance and interference issues associated with these devices.
Introduction
Cardiovascular disease (CVD) and diabetes mellitus are major public health problems worldwide. 1 Globally CVD remains the leading cause of morbidity and premature mortality and in the UK and accounts for approximately 32% of deaths each year.1,2 Furthermore, patients with diabetes have a fivefold increased risk of developing CVD compared to those without diabetes.3–5 Early diagnosis and intervention are essential for reducing the risk of, or developing the progression of, the macrovascular and microvascular complications associated with diabetes. It may take several years from the onset of diabetes before it is recognized, by which time half of the patients with newly diagnosed type 2 diabetes already show signs of these associated complications.6,7 The NHS Vascular Risk Assessment and Management Program was launched in 2009 to screen the UK population aged 40–75 years to identify individuals at high risk of developing CVD and hitherto undiagnosed diabetes.8,9 Each NHS health check combines a series of simple measurements, which include blood pressure, body mass index (BMI) and blood tests for glucose, total cholesterol (TC), high-density lipoprotein cholesterol (HDL-C) and creatinine along with an assessment of lifestyle (including smoking status and family history of premature CVD. 8 These data permit calculation of an individual's 10-year CVD risk thus identifying those most likely to benefit from preventative intervention.
The National Cholesterol Education Program (NCEP) recommends that TC and HDL-C assays should have percentage coefficients of variation (%CVs) for imprecision of ≤3% and ≤6%, respectively, and mean bias limits of ±3% and ±10%, respectively.10–12 Provided that analytical performance was acceptable, point-of-care testing (POCT) has advantages over the traditional laboratory approach when carrying out widespread community CVD and diabetes population screening as part of the NHS Health Check initiative. We report on a comprehensive laboratory and field evaluation carried out in collaboration with Wolverhampton City Primary Care Trust (PCT) of two of the main POCT lipid and glucose analysers currently in use in the UK: the Cholestech LDX (Hayward, USA) and the Polymer Systems Technology CardioChek PA (Indianapolis, USA).
Methods
Imprecision
Intra-batch imprecision (n = 15) was evaluated at two different concentrations TC (approximately. 4.0 and 7.0 mmol/L), HDL-C (approximately 1.3 and 2.0 mmol/L) and glucose (approximately 5.0 and 11.0 mmol/L). Venous whole blood was collected into Sarstedt lithium-heparin/2.7 mL tubes using the Sarstedt Safety Monovette® system (Sarstedt Aktiengesellschaft & Co, Germany) from laboratory volunteers. Samples were analysed using either the LDX or the CardioChek POCT analyser for TC, HDL-C and glucose according to the manufacturer's instructions. Both POCT analysers employ dry-chemistry assays for the measurement of TC, HDL-C and glucose13,14; a pre-analytical plasma separation step removes the blood cells without the need for centrifugation. TC and HDL-C are both measured using cholesterol esterase/cholesterol oxidase/peroxidase based methods; the HDL-C assays include an additional pre-analytical step to deplete the sample of its very-low density and low-density lipoprotein cholesterol. Glucose is measured using a glucose oxidase/peroxidase based method. Samples were spiked using a glucose solution to achieve the approximate concentrations desired. Following separation (2380 g for 5 min), the plasma concentrations of TC, HDL-C and glucose in the test samples were immediately measured using Roche reagents on the laboratory Roche Modular P® analyser (Roche Diagnostics GmbH, Mannheim, Germany) for comparison against the POCT analyser results. Inter-batch imprecision (n = 12) was assessed (9 am and 5 pm daily for six consecutive days) using: (i) lithium heparinized (Li-Hep) venous whole blood samples (TC and HDL-C only) and (ii) venous plasma (TC, HDL-C and glucose). Lithium–Heparin venous blood was collected as described above and either stored as whole blood at 4℃ for the duration of the experiment or immediately centrifuged (2380 g for 5 min) and the separated plasma divided into 200 μl aliquots and stored at −80℃ until used.
Throughout the duration of this study, each POCT device was also registered with an appropriate external quality assessment (EQA) scheme: WEQAS POCT lipids for the CardioChek and Birmingham Quality (UK NEQAS) Health Checks EQA service for the LDX. Mean between-analyser %CVs for the TC, HDL-C and glucose assays of each device were calculated using the respective %CVs of all-laboratory agreement obtained from the EQA data kindly provided by the scheme organizers.
Interferents
TC, HDL-C and glucose were measured at two different concentrations of each analyte in Li-Hep venous whole blood samples at different levels of haematocrit (Hct). The percentage Hct (%Hct) was varied (approximately 25–65%) by altering the proportions of plasma and cells. Actual sample Hct was measured in the Clinical Haematology Department, New Cross Hospital using an Abbott Diagnostics Cell-DYN Sapphire® differential cell-counter (Abbott Diagnostics, IL, USA). The baseline %Hcts of the original venous samples was 47% (level one) and 42% (level two). Samples were spiked with glucose to generate the desired concentrations. Plasma TC, HDL-C and glucose concentrations in the test samples were measured on the laboratory Roche MODULAR analyser for comparison.
The effect of ascorbic acid concentration on the POCT assays was investigated by measuring TC, HDL-C and glucose in baseline samples and two samples spiked with different concentrations of ascorbic acid. The spiked concentrations of ascorbic acid were chosen to approximately reflect the plasma ascorbic acid concentration in an individual taking ascorbic acid supplements of 1 g and 2 g per day. 15 The Li-Hep venous blood samples containing ascorbic acid were promptly analysed for TC, HDL-C and glucose on the POCT device and subsequently stabilised within 1 h by the addition of 5% weight:volume metaphosphoric acid. The resulting precipitate was pelleted at 8000 g for 10 min and the supernatant stored at −80℃ and transported frozen for ascorbic acid analysis within one week. The ascorbic acid concentration in the samples was measured by high-performance liquid chromatography (Department of Clinical Biochemistry, Glasgow Royal Infirmary).
Ease of use and clinical governance
The user-friendliness of both analysers was evaluated and each step of the POCT measurement procedure assessed in order to try and identify any potential sources of user-dependant error.
Accuracy – comparison of POCT analysers with laboratory methods
Subject recruitment
A series of community health check clinics were set-up by the Wolverhampton City PCT to provide a CVD and diabetes screening service for the population of Wolverhampton. LDX and CardioChek analysers were allocated to the clinics. Individuals attending the clinics and receiving a POCT capillary whole blood test for TC, HDL-C and glucose were offered the option of having a paired venous sample collected for confirmatory laboratory analysis between March and September 2010. Venous sampling was employed as a means of verifying the POCT results during the evaluation period. The results of each health check were forwarded to the appropriate general practitioner with flags to identify patients with a TC or random glucose of ≥6.0 mmol/L.
Capillary whole blood collection and analysis
A finger-prick capillary whole blood sample was collected from each subject and analysed using either the LDX or the CardioChek POCT analyser for TC, HDL-C and glucose according to the manufacturer's instructions. Capillary specimens were collected using the collection device supplied with the LDX. The sample volume of the LDX sample collection device (37 µL) was compatible with the CardioChek's reagent test strips (35–40 µL sample volume). POCT measurements were performed by non-laboratory personnel who had received appropriate training and competency assessment in accordance with the Royal Wolverhampton NHS Trust POCT policy. The POCT instrument's optics were checked by the operator at the start of each clinic using the manufacturer supplied optics check cassette (LDX) or check strip (CardioChek); any maintenance was performed in accordance with the manufacturer's instructions. Internal quality control (IQC) checks were performed twice weekly using the two-levels of manufacturer supplied control materials. IQC and optic results were recorded by the operator and inspected by the laboratory on a monthly basis; all were within manufacturer stated limits.
Venous whole blood sample collection and laboratory analysis
Paired venous samples were collected into Sarstedt serum gel Z/4.7 mL (TC and HDL-C) and fluoride-EDTA/2.7 mL (glucose) tubes as described. Samples were centrifuged (2380 g for 5 min) within 5 h of collection and immediately analysed for TC, HDL-C and glucose using Roche reagents and methodology on the laboratory Roche Modular P® analyser (Roche Diagnostics GmbH, Mannheim, Germany). Serum TC and HDL-C were measured using cholesterol oxidase/peroxidase and polyethylene glycol (PEG)-cholesterol esterase/PEG-cholesterol oxidase/peroxidase (HDL-C plus 3rd generation) based methods, respectively. Plasma glucose was measured using the glucose hexokinase/glucose-6-phosphate dehydrogenase method. Samples were adjudged to be free from lipaemic, icteric and haemolytic interference by the analyser's automated on-board serum indices methods (Roche Diagnostics). AUTONORM™ IQC material (SERO AS, Billingstad, Norway) was run twice daily at two levels of each analyte and all IQC values were within acceptable limits (running %CVs <5%).
Data plotting and statistical analysis
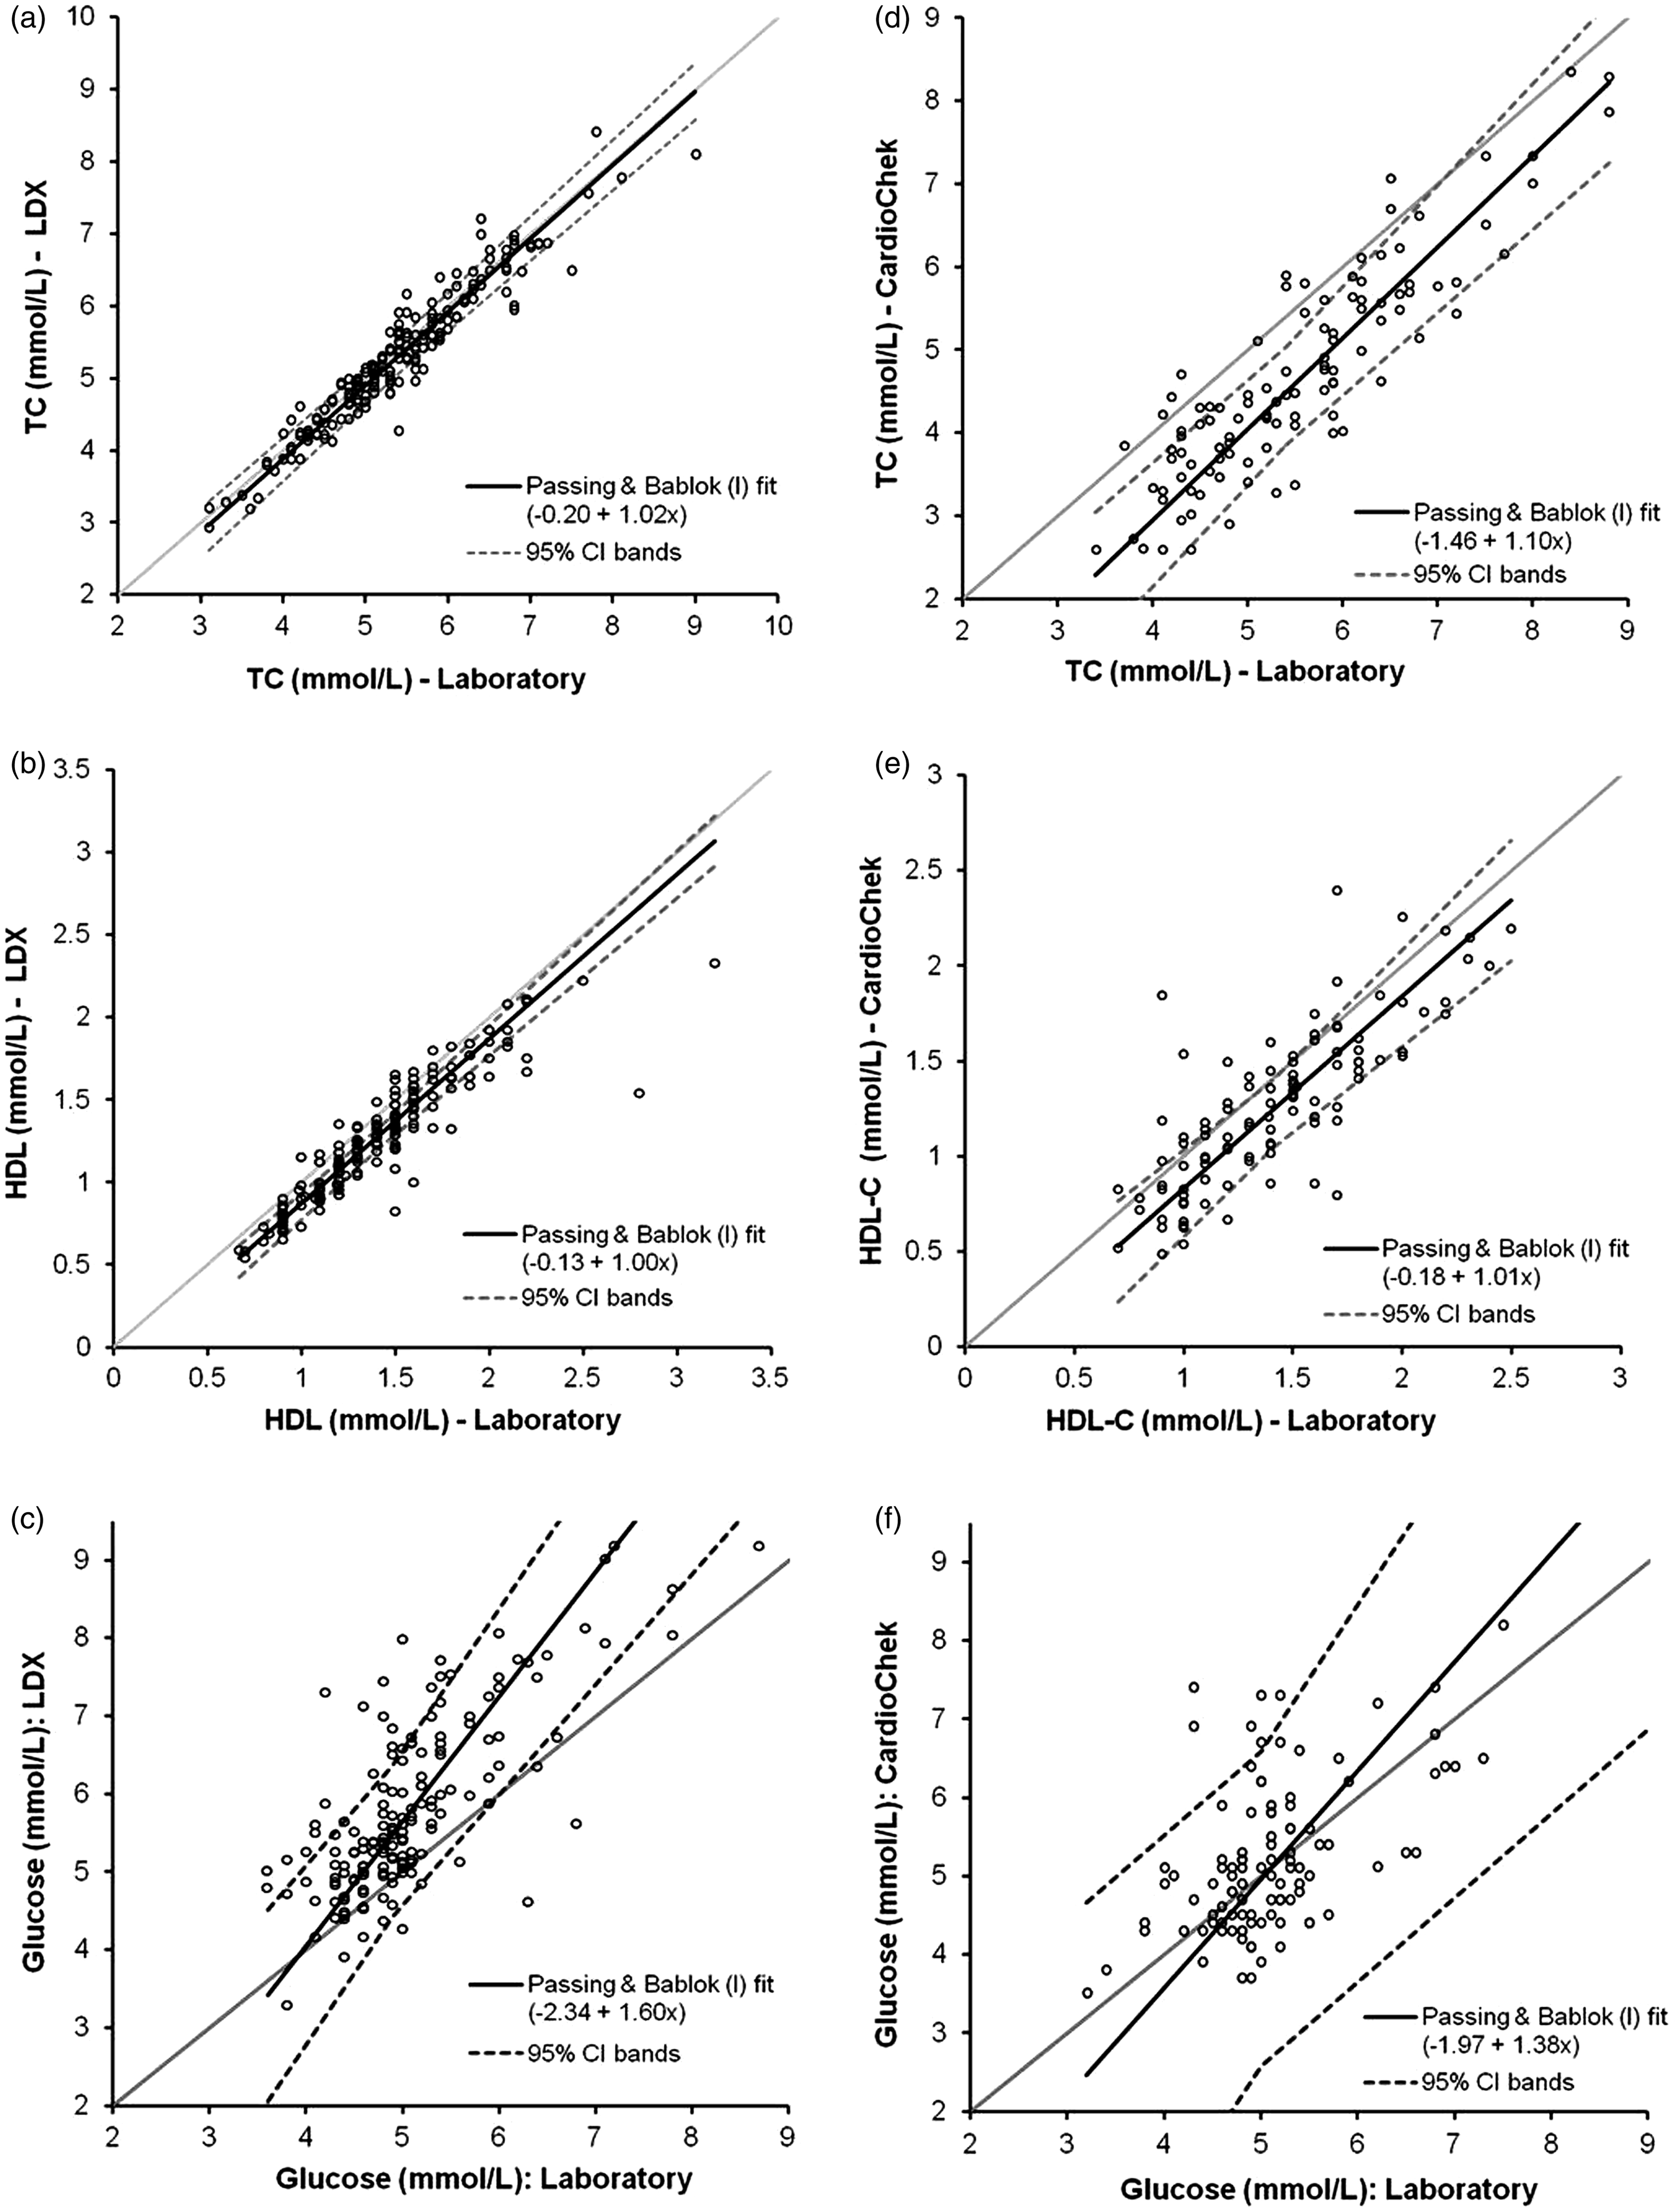
Data analysis and the generation of the Bland-Altman 16 and Deeming regression plots were performed using Analyse-it® version 2.22 (Analyse-it Software Ltd, Leeds, UK). For the method comparison study, Bland-Altman plots were plotted as the percentage difference ((POCT – laboratory) × 100/Mean of POCT and laboratory results) versus the mean of the POCT and laboratory measurements. P values were calculated for the differences observed between the POCT and laboratory results using paired Student t-tests. The concentration dependence of the POCT measurement bias versus the laboratory method was assessed using the Bland-Altman plots. Results for each analyte (in order of increasing value) were divided into quartiles based on the laboratory result and a mean concentration and percentage bias calculated for each using the laboratory result as the reference. Permission for data to be published has been granted by the Royal Wolverhampton NHS Trust Caldicott Guardian.
Results
Imprecision
POCT analyser imprecision data for TC, HDL-C and glucose in Li Hep whole blood and plasma.
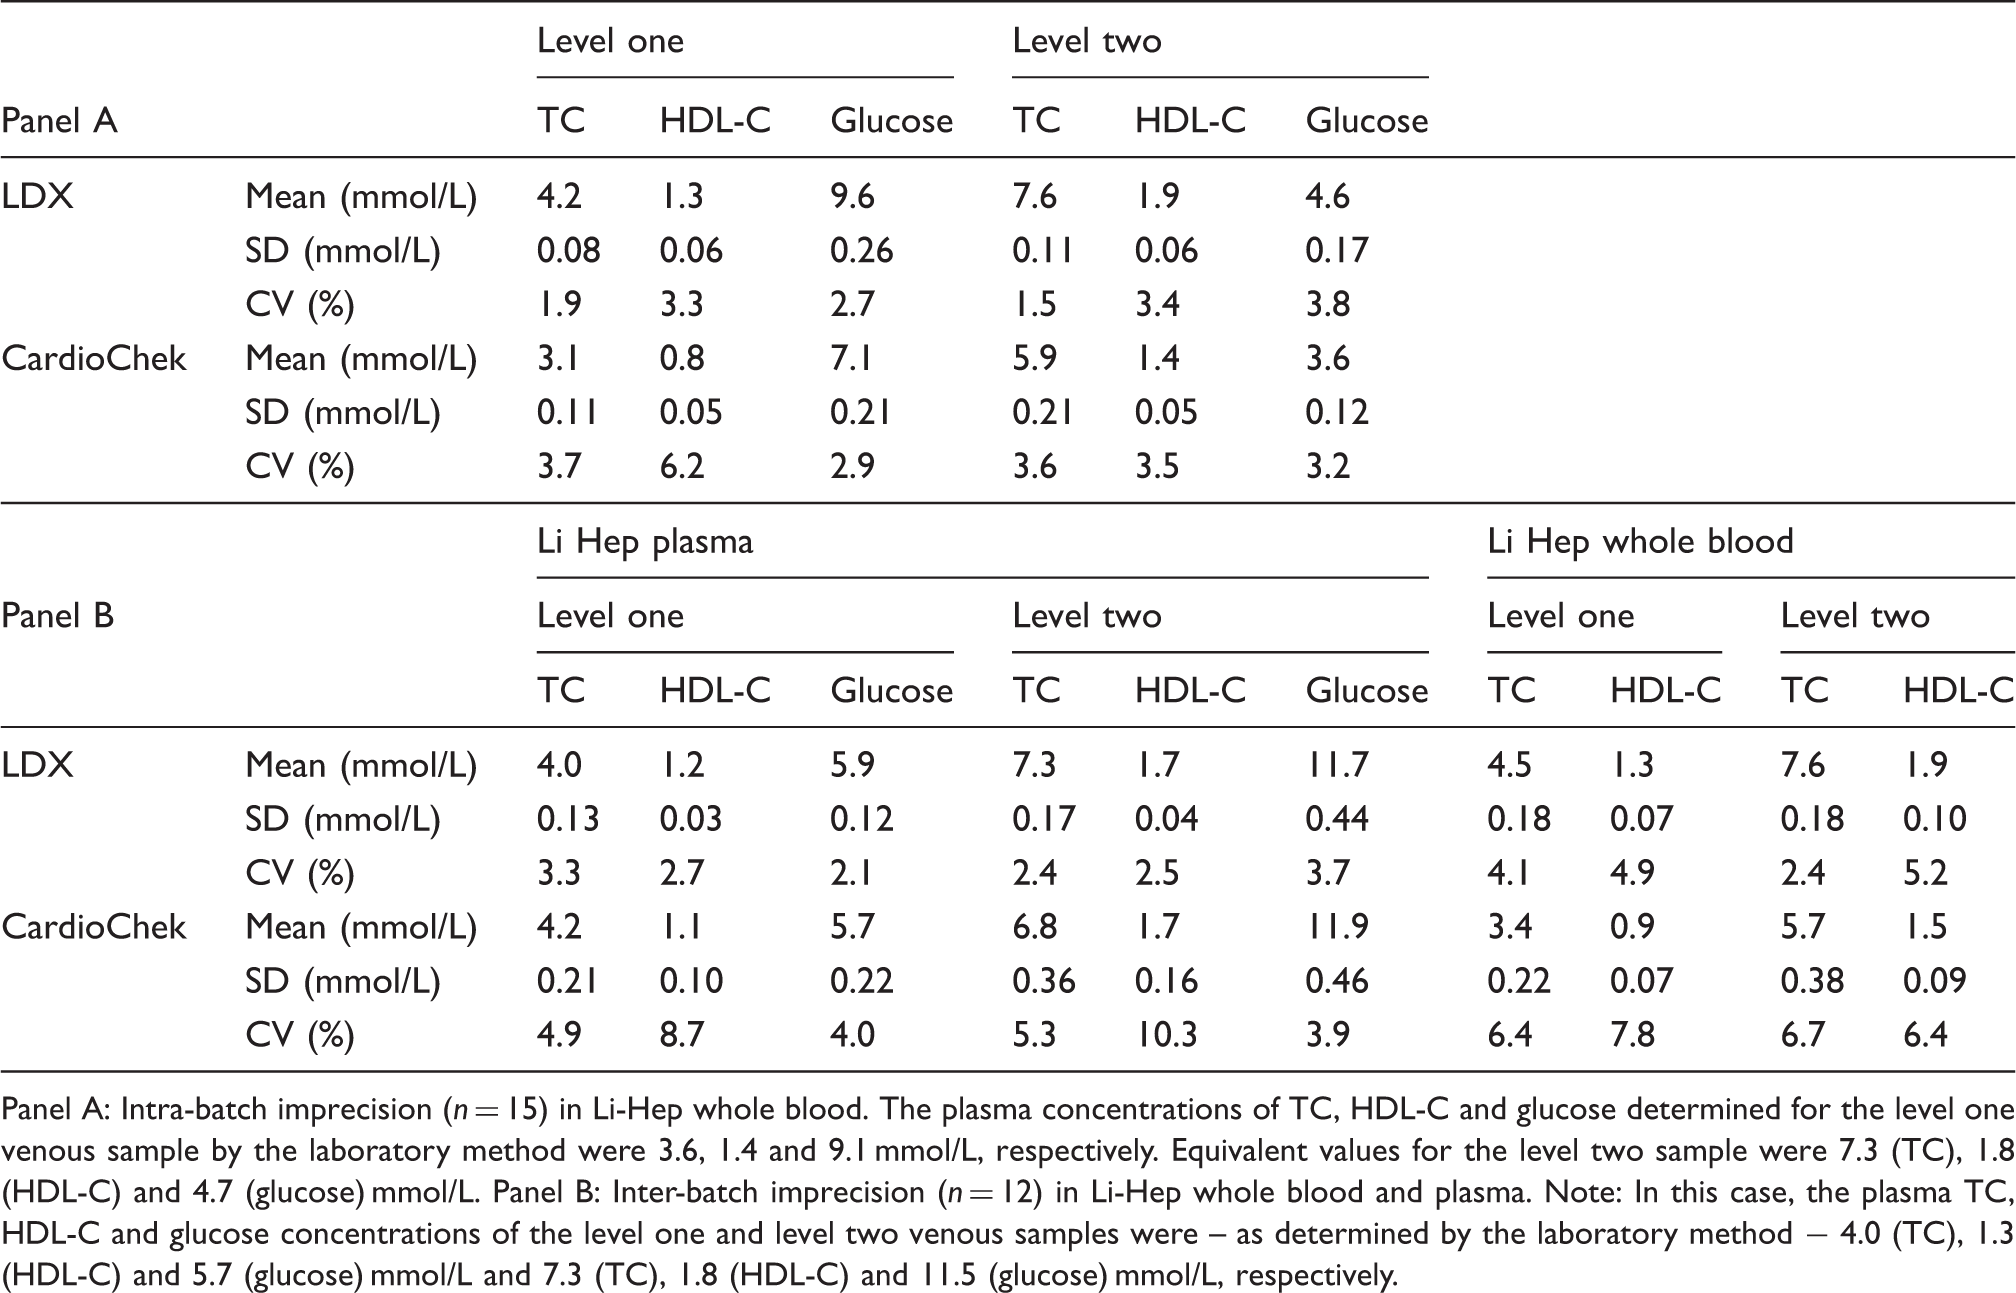
Panel A: Intra-batch imprecision (n = 15) in Li-Hep whole blood. The plasma concentrations of TC, HDL-C and glucose determined for the level one venous sample by the laboratory method were 3.6, 1.4 and 9.1 mmol/L, respectively. Equivalent values for the level two sample were 7.3 (TC), 1.8 (HDL-C) and 4.7 (glucose) mmol/L. Panel B: Inter-batch imprecision (n = 12) in Li-Hep whole blood and plasma. Note: In this case, the plasma TC, HDL-C and glucose concentrations of the level one and level two venous samples were – as determined by the laboratory method − 4.0 (TC), 1.3 (HDL-C) and 5.7 (glucose) mmol/L and 7.3 (TC), 1.8 (HDL-C) and 11.5 (glucose) mmol/L, respectively.
EQA between-analyser variation data.
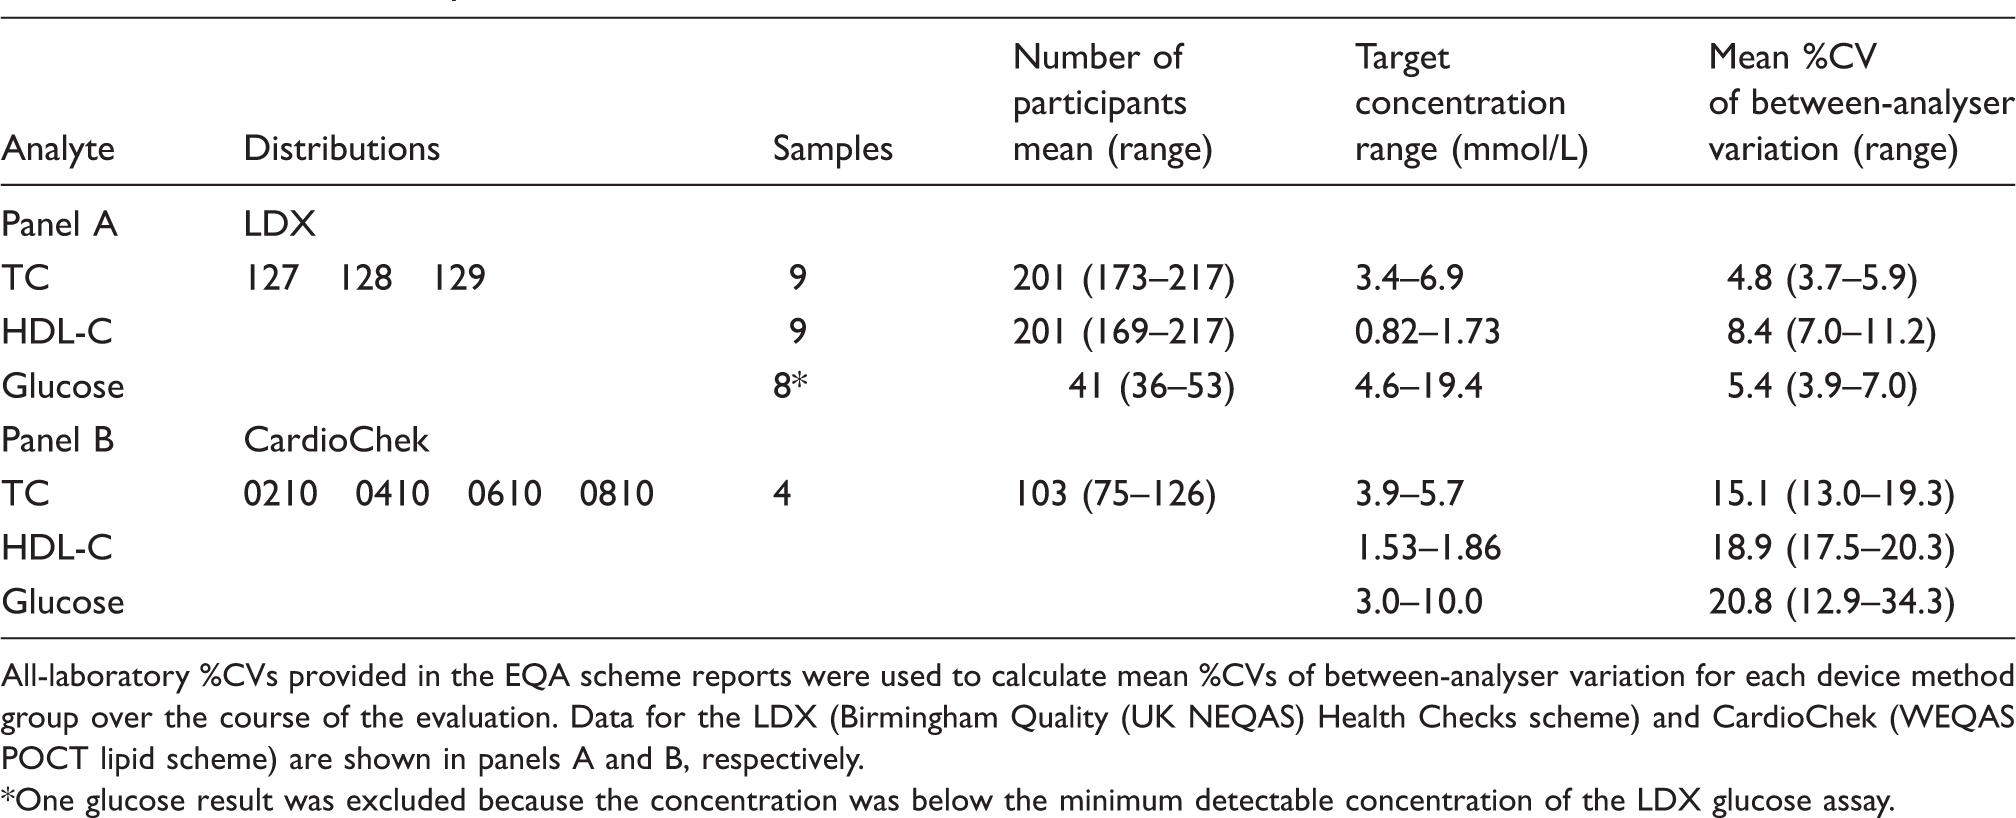
All-laboratory %CVs provided in the EQA scheme reports were used to calculate mean %CVs of between-analyser variation for each device method group over the course of the evaluation. Data for the LDX (Birmingham Quality (UK NEQAS) Health Checks scheme) and CardioChek (WEQAS POCT lipid scheme) are shown in panels A and B, respectively.
One glucose result was excluded because the concentration was below the minimum detectable concentration of the LDX glucose assay.
Interferents
Haematocrit
POCT haematocrit interference data at two analyte concentrations.
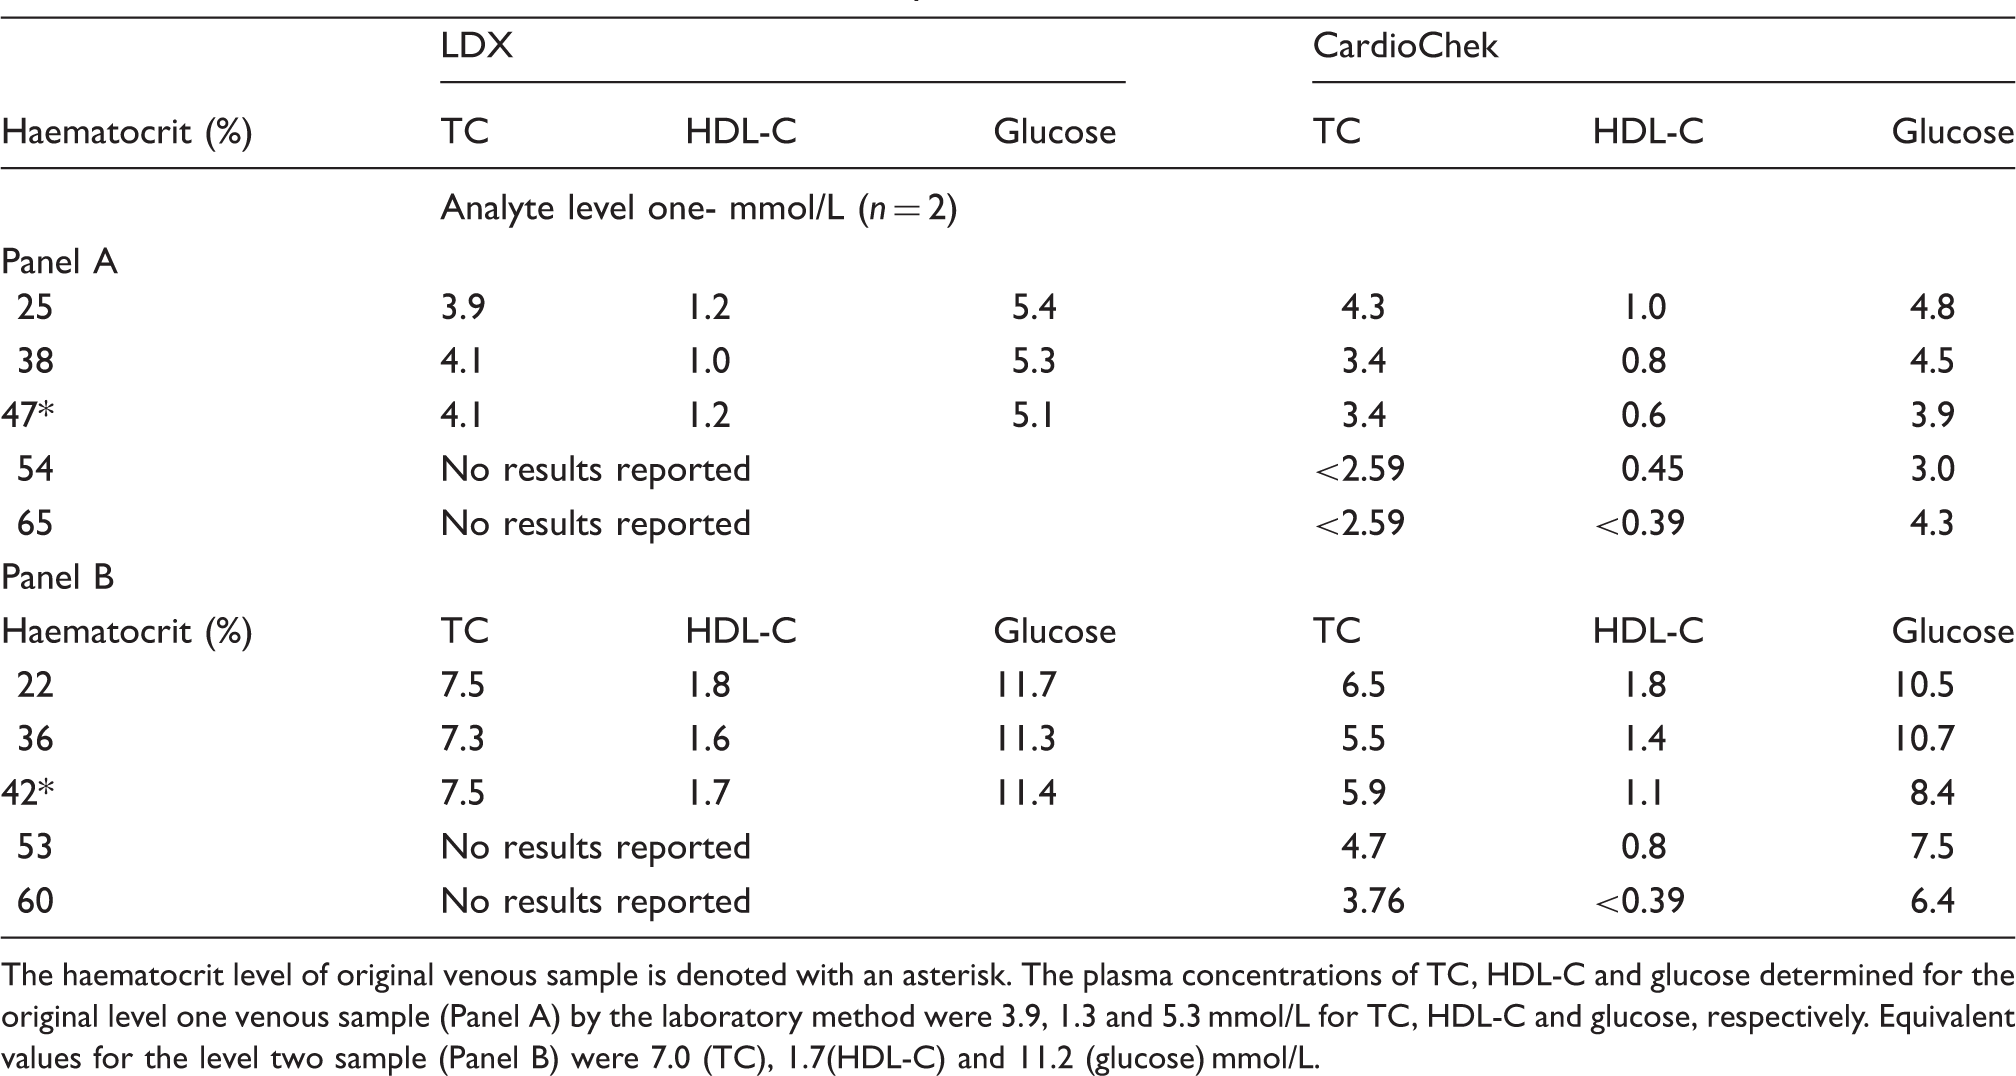
The haematocrit level of original venous sample is denoted with an asterisk. The plasma concentrations of TC, HDL-C and glucose determined for the original level one venous sample (Panel A) by the laboratory method were 3.9, 1.3 and 5.3 mmol/L for TC, HDL-C and glucose, respectively. Equivalent values for the level two sample (Panel B) were 7.0 (TC), 1.7(HDL-C) and 11.2 (glucose) mmol/L.
Ascorbic acid
POCT ascorbic acid interference data at two analyte concentrations.
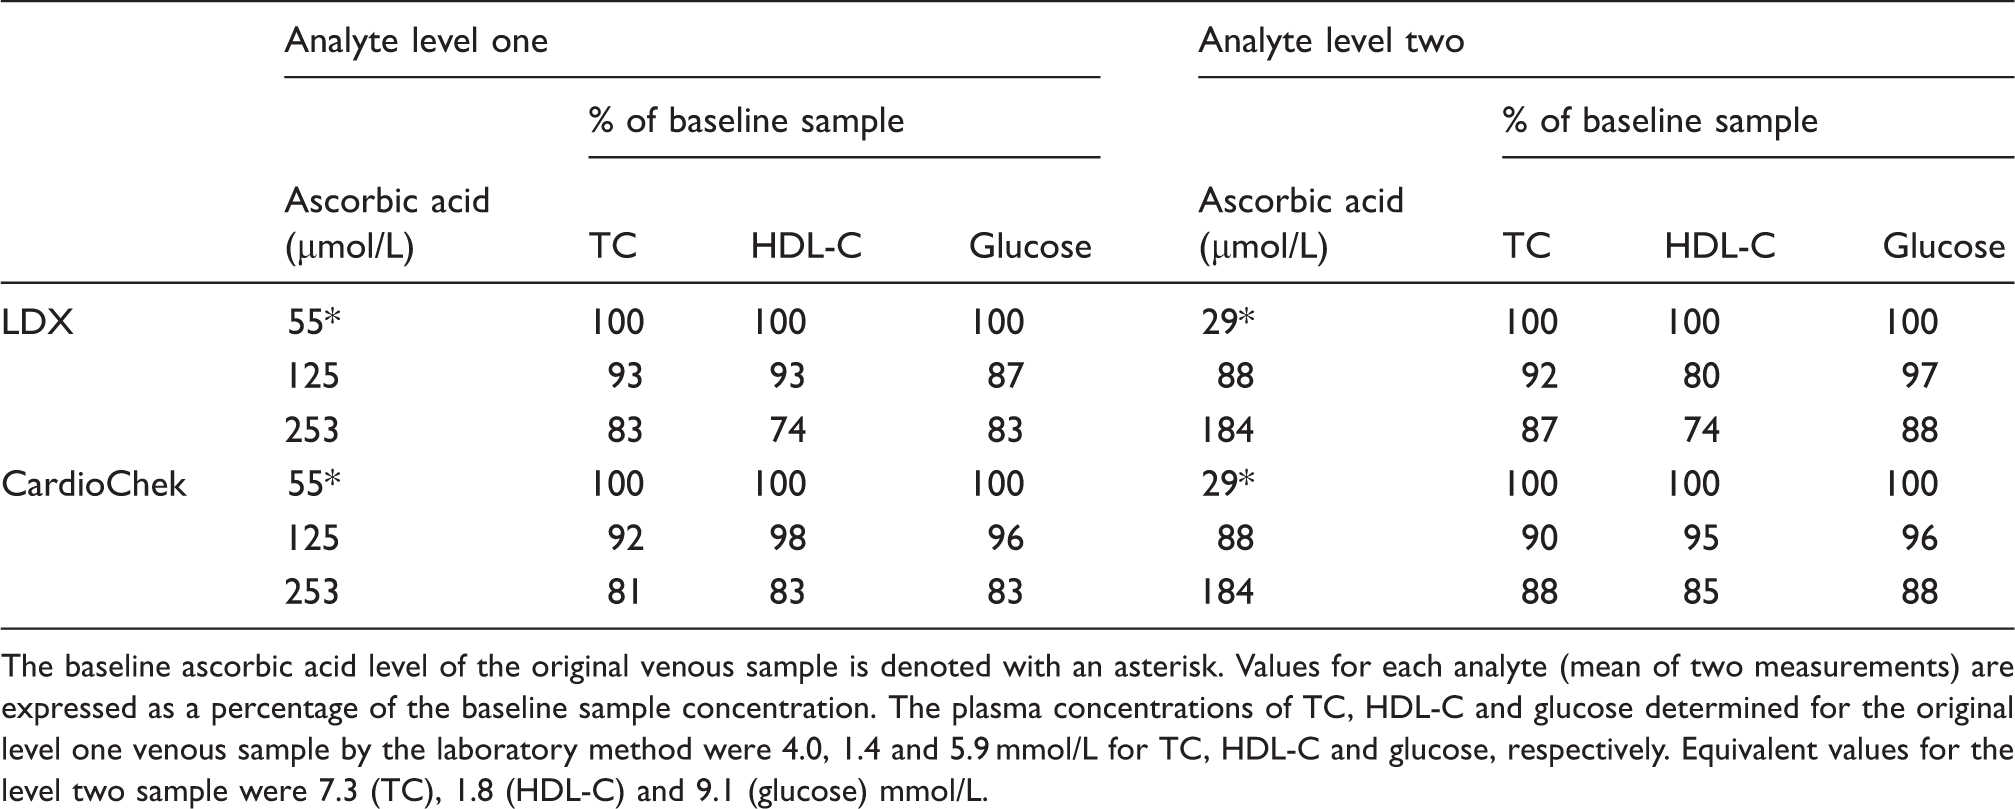
The baseline ascorbic acid level of the original venous sample is denoted with an asterisk. Values for each analyte (mean of two measurements) are expressed as a percentage of the baseline sample concentration. The plasma concentrations of TC, HDL-C and glucose determined for the original level one venous sample by the laboratory method were 4.0, 1.4 and 5.9 mmol/L for TC, HDL-C and glucose, respectively. Equivalent values for the level two sample were 7.3 (TC), 1.8 (HDL-C) and 9.1 (glucose) mmol/L.
Comparison of POCT and laboratory TC, HDL-C and glucose measurements
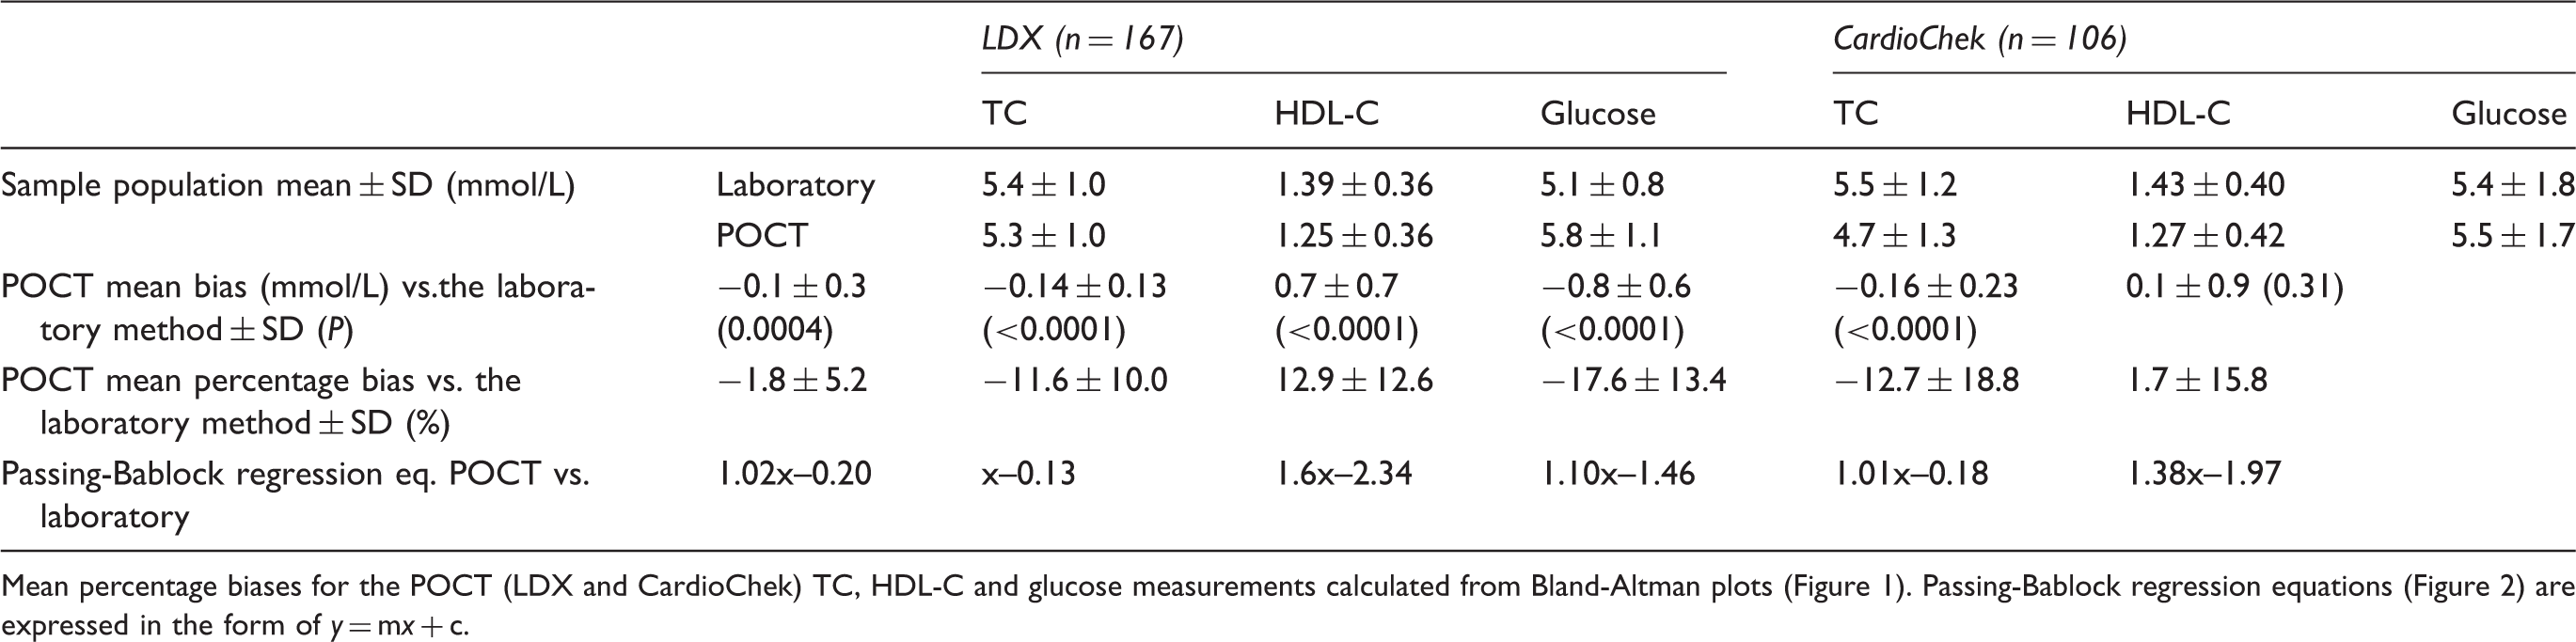
Accuracy of the POCT TC, HDL-C and glucose assays was estimated by comparison with Roche laboratory methods which served as a reference (data summarized in Table 5). Paired POCT and laboratory measurements were collected from 273 subjects (LDX: n = 167; CardioChek: n = 106). Mean laboratory TC, HDL-C and glucose measurements for the patient populations used to evaluate the LDX and CardioChek analysers differed by <10% (Table 5). Bland-Altman and Deeming regression plots depicting the POCT TC, HDL-C and glucose data versus the laboratory measurements are shown in Figures 1 and 2, respectively.
Bland-Altman plot comparison of the POCT and laboratory TC, HDL-C and glucose measurements. The TC, HDL-C and glucose data for the LDX (n = 170) are shown in panels A, B and C, respectively. Panels D (TC), E (HDL-C) and F (glucose) contain the CardioChek data (n = 106). The horizontal grey line (–) in each plot represents identity. Note: glucose plots have been truncated at 9 mmol/L (one data point not shown for the LDX, three data points not shown for the CardioChek). 185 × 234 mm (150 × 150 DPI). Passing-Bablock regression plots comparing the POCT and laboratory measurements for TC, HDL-C and glucose. The TC, HDL-C and glucose data for the LDX (n = 170) are shown in panels A, B and C, respectively. Panels D (TC), E (HDL-C) and F (glucose) contain the CardioChek data (n = 106). The diagonal grey line (–) in each plot represents identity. Note: glucose plots have been truncated at 9 mmol/L (one data point not shown for the LDX, three data points not shown for the CardioChek). 181 × 233 mm (150 × 150 DPI). Summary the POCT analysers analytical performance versus the laboratory methods.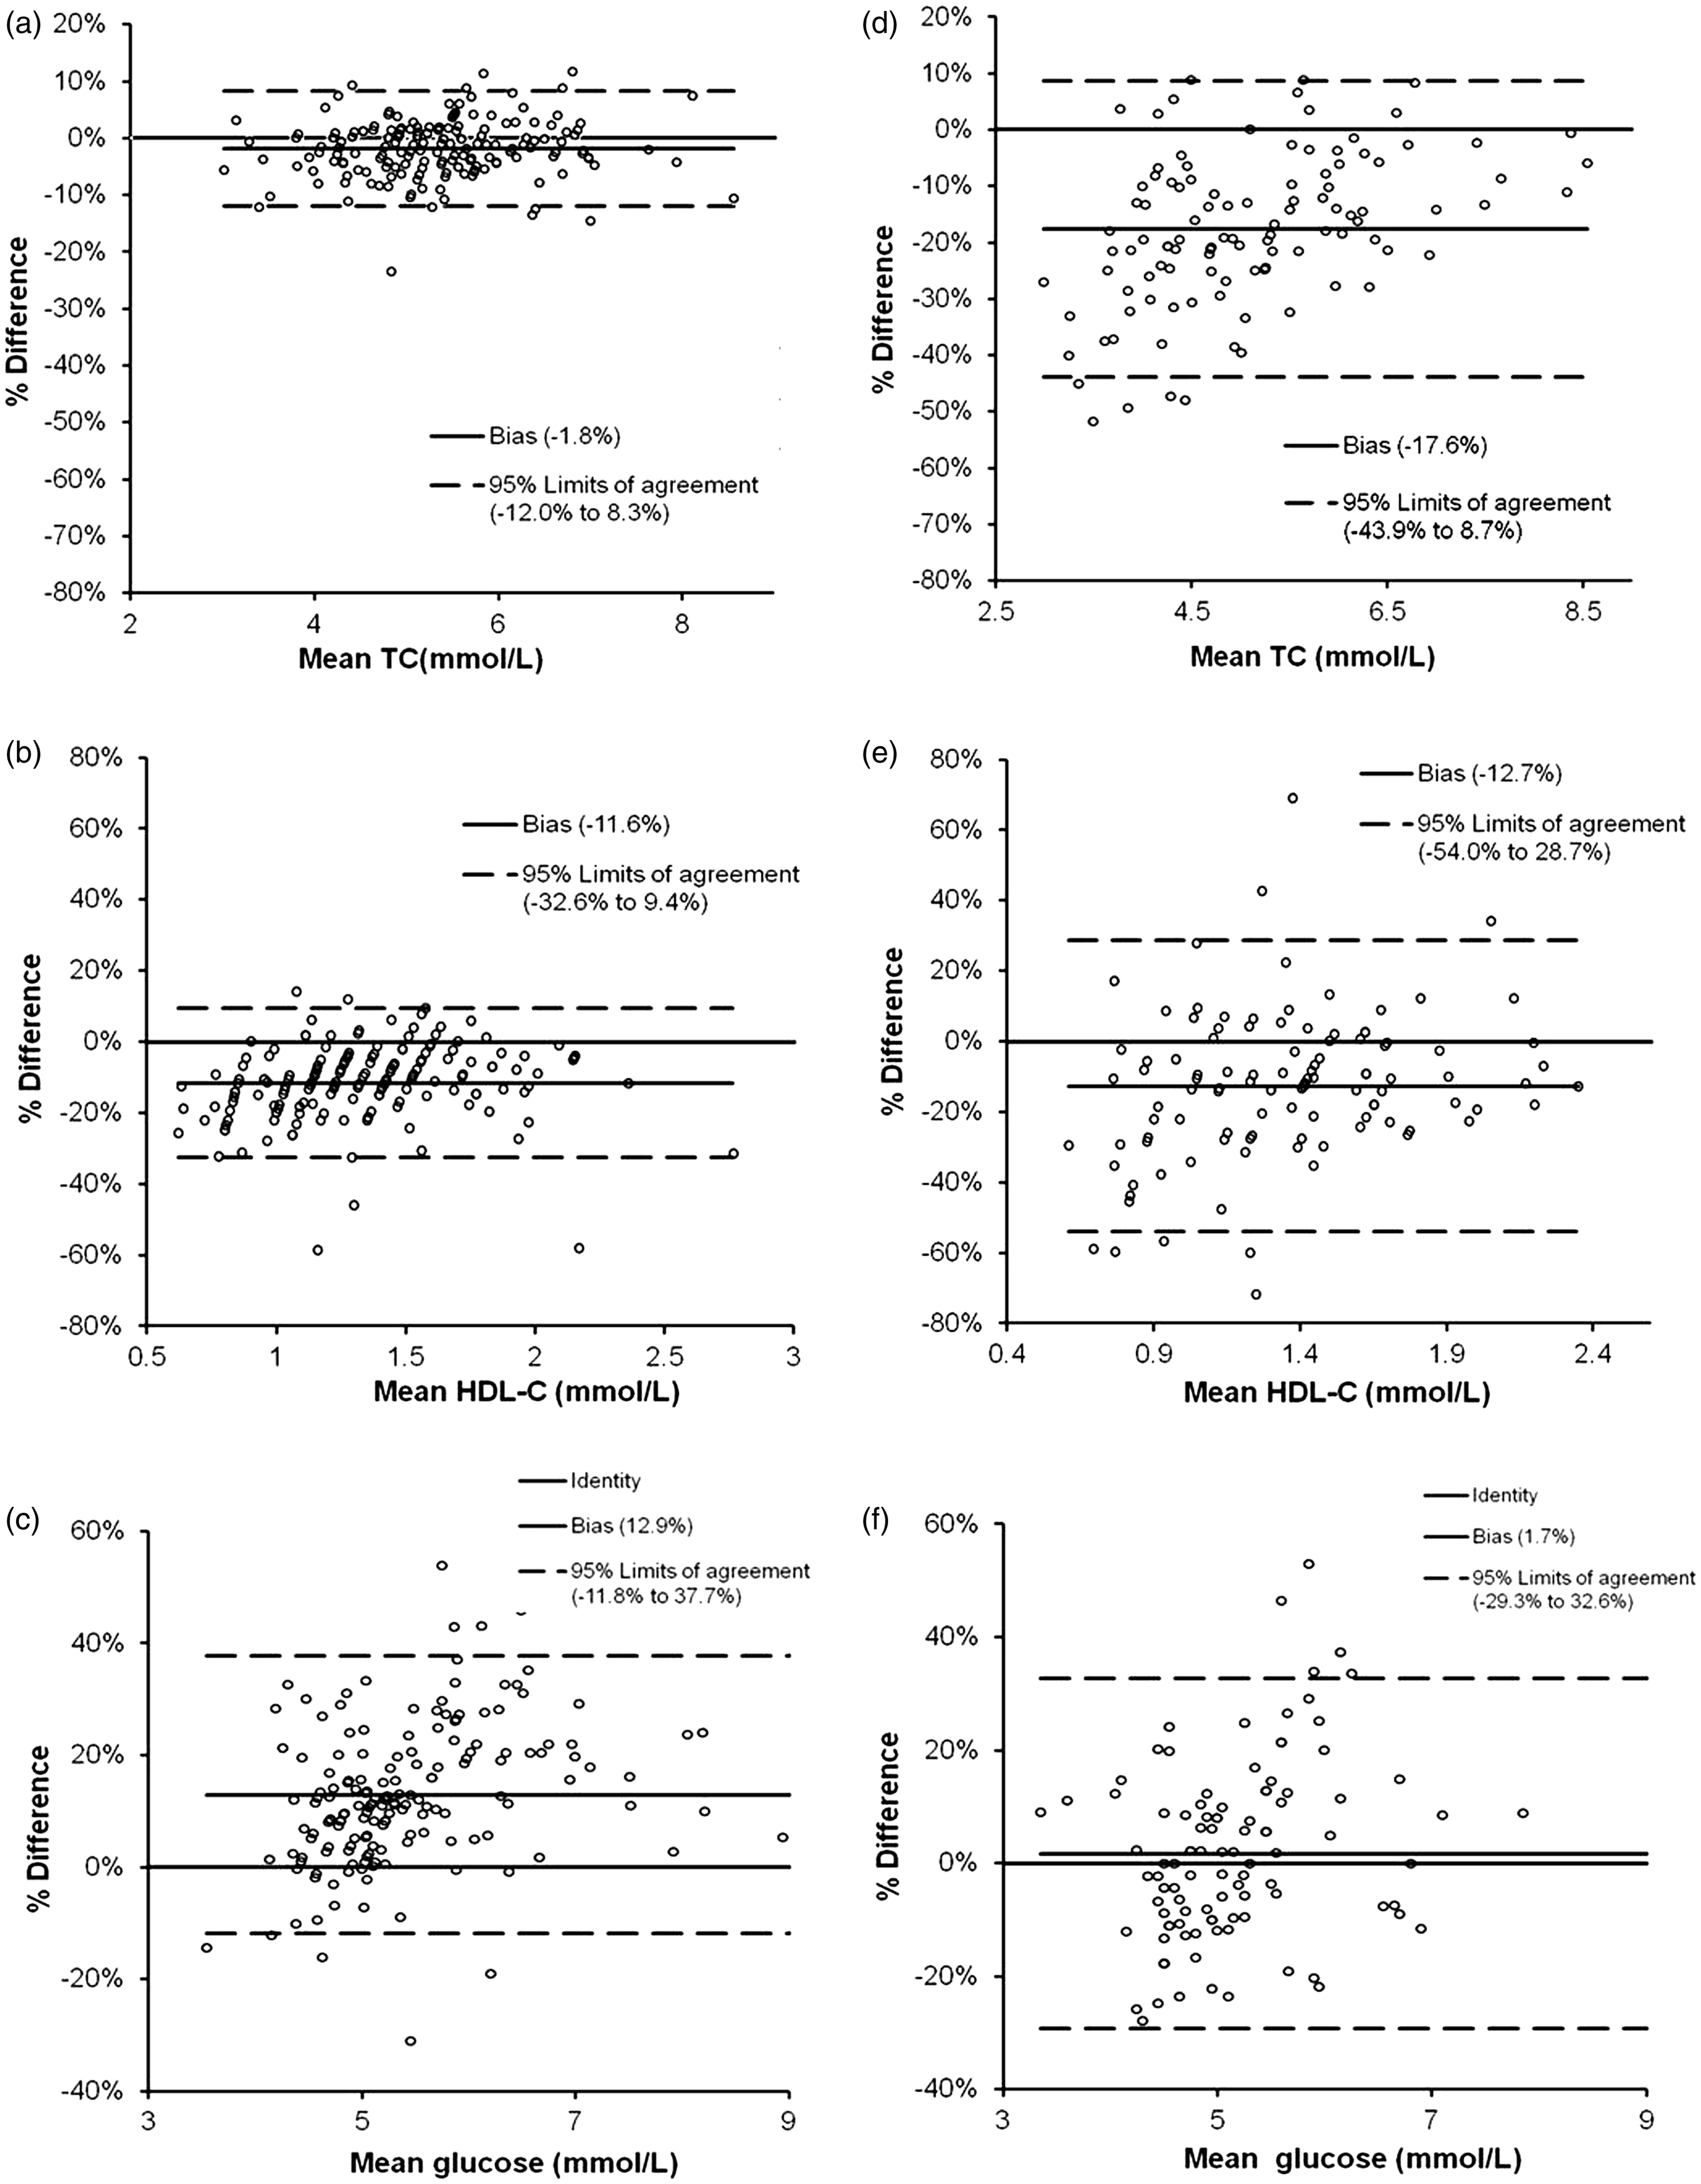
Concentration-dependence of the POCT TC, HDL-TC and glucose measurement bias versus the laboratory method.
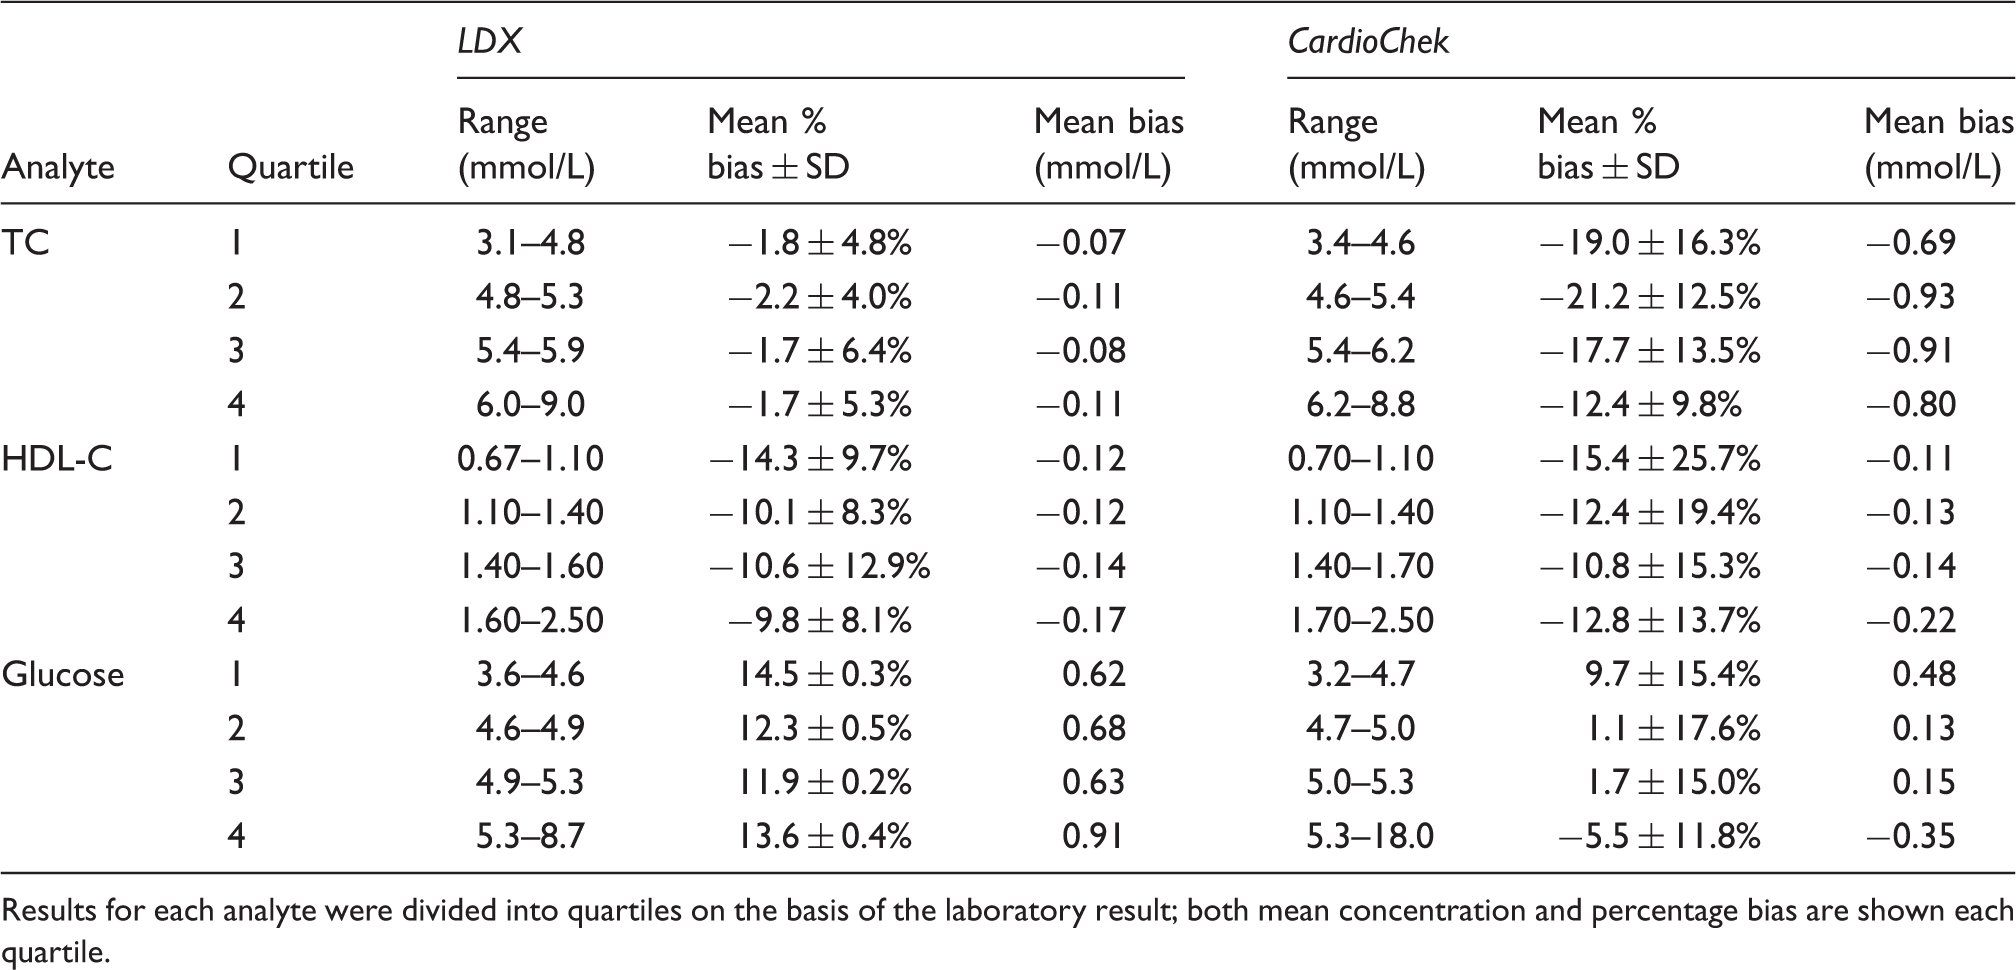
Results for each analyte were divided into quartiles on the basis of the laboratory result; both mean concentration and percentage bias are shown each quartile.
Ease of use and clinical governance
Both POCT analysers are compact, portable and require no calibration and little user maintenance but have a restricted operating temperature range (20–30℃) and narrower analytical ranges compared to laboratory methods. Although subjective, operators found the LDX easier to use than the CardioChek. Operators at the health check clinics found the menu system of the CardioChek difficult to navigate and the need to perform IQC checks in a different mode to patient samples added an additional layer of complexity. A disadvantage of the LDX is the need for a refrigerator to store the reagent cassettes and IQC material which could potentially result in increased setup costs and reduced mobility of the POCT service. The reagent cassettes, however, are stable for one month at room temperature allowing them to be stored centrally and distributed to clinics when required. Being battery operated, the CardioChek is highly portable although, there is a requirement for the user to carry replacement batteries as the device does not give an indication of the charge remaining; the LDX has the option of a rechargeable battery. The quality of the specimen is an important factor which may influence POCT test results. The collection devices supplied with the CardioChek were very difficult to use; several attempts were often needed to obtain a specimen suitable for analysis, even in ‘experienced’ hands.
The key points concerning clinical governance that were common to both devices were:
Neither device has the facility to restrict user access via operator ID entry. Operators are not prompted to perform system integrity and IQC checks, nor are they prevented from testing patient specimens if either fails. Full connectivity to a laboratory information management system (LIMS) is not currently possible. Sample collection can be highly user dependant: An adequate amount of free flowing blood must be carefully obtained without excessively ‘milking’ the finger which can cause haemolysis and/or haemodilution or haemoconcentration of the sample. Compared to capillary glucose measurement, the LDX and CardioChek require relatively large sample volumes (35–40 µL). The operator must also avoid introducing air bubbles into the collection device so that the correct sample volume is applied. Results units can potentially be changed by the operator from mmol/L to mg/dL.
The key points specific to the CardioChek were as follows.
Erroneous results reported when sample haematocrit is outside operating range, if the sample is clotted or if insufficient sample is applied. The operator is required to examine the rear of the test strip after each test to ensure that each assay disc has an even colouration. At the time of the evaluation, the IQC material supplied did not have sensible target ranges; the target ranges of the two IQC levels overlapped plus, in some instances, IQC values were outside the measuring range of the instrument. The IQC measurement procedure was not the same as for patient samples. Calibration information for different cassettes/strips lots may be incorrectly applied and it is possible to mix reagent lots up. The user must check that the lot numbers of the test strip vial and MEMo Chip (which stores the relevant calibration information for that reagent lot) match. Environmental light levels can influence test results and so the analyser should not be operated in direct light.
The key points specific to the LDX relate to the reagent preparation and storage procedures, which if not adhered to, could potentially affect test results. Reagent cassette and IQC must be removed from the fridge for sufficient time prior to testing in order to allow it to reach room temperature. Reagent cassettes are stable for up to 30 days at room temperature once they have been removed from the refrigerator and so careful stock management is required.
Discussion
This is the first comprehensive comparative field and laboratory evaluation of the LDX and CardioChek lipid and glucose POCT analysers. Others have previously evaluated, either individually17–25 or comparatively26–29 the analytical performance of these two devices (reviewed).30,31 We, however, have combined a detailed analytical evaluation with an assessment of field operator usability and clinical governance, which must be considered when setting up a POCT based community cardiovascular and diabetes screening service. By having the POCT measurements performed by non-laboratory personnel in these outreach NHS Health Checks clinics as part of the field evaluation, we have attempted to assess actual ‘real world’ instrument performance. It is also the first comparative study of these two analysers that assesses both Hct and ascorbic acid interference.
The LDX exhibited lower imprecision (intra- and inter-batch) and %CVs of between-analyser variability when compared to the CardioChek. Our data are consistent with the manufacturer's imprecision performance claims in terms of intra- (LDX and CardioChek) and inter-batch (LDX).13,14 The WEQAS (CardioChek) and Birmingham Quality UK NEQAS EQA scheme data allowed assessment of between-analyser agreement. It would have been preferable to use the data from one EQA provider to compare performance but unfortunately, at the time of the evaluation, users of the two devices were participating in different schemes. EQA materials from the same scheme could not be used on both analysers due to sample matrix incompatibilities. It is worth noting that the %CVs of between-analyser variability also contain an element of between-operator variation.
When compared to the standard laboratory methods, the LDX exhibited lower mean percentage biases than the CardioChek for the measurement of TC and HDL-C. The individual and relative performances of the TC and HDL-C assays of the two analysers against laboratory methods used in this study are consistent with those of previously reported.21–25,27–29,32 Shemesh et al. 20 did report poorer field performance for the LDX HDL-C assay relative to the laboratory method compared to our findings. The LDX also displayed superior ‘consistency of bias’ for the two analytes and these observed differences in the degree of scatter relative to the laboratory method are comparable with previous reports on the two devices.21–25,28,29,32 We have been informed that since these data were collected (April - September 2010) the CardioChek PA has undergone further development by the manufacturer [Andrew Greaves – BHR Pharmaceuticals, personal communication]. However, as yet, no data are available concerning the performance of the new analyser. It should be noted that the laboratory Roche TC, HDL-C and glucose assays used in the method comparison study are not the recognized reference methods for these analytes. Thus, although the method comparison study presented within this report provides a reasonable estimate of the accuracy of the POCT TC, HDL-C and glucose assays, the data may not represent the true performance of these devices. Direct TC and homogeneous HDL-C assays such as the Roche assay used in this study for the method comparison are subject to a negative proportional interference by triglycerides 33 [Jane French – Birmingham Quality (UK NEQAS), personal communication]. There are also reports that homogeneous HDL-C assays can give erroneous results in patients with dyslipidaemias or atypical lipoprotein distributions.34,35 Triglycerides were not measured in this study and so, given that the subjects were not fasted at the time of sample collection, the possibility of this interference cannot be excluded. Although none of the samples were adjudged by the laboratory analyser's on-board serum indices to be, according to the manufacturer, sufficiently lipaemic to cause significant HDL-C assay interference.
Both analysers displayed a positive proportional bias for glucose compared to the laboratory method with neither device achieving the manufacturer's stated assay performance claims.13,14 Studies by Shemesh et al. 20 and Jain et al. 21 reported similar findings for the LDX but no comparative performance data relating to the CardioChek assay are available. This study may, however, have underestimated the POCT glucose assay performance. Other than inherent assay bias, other factors may have contributed to the observed differences between the POCT capillary glucose and the laboratory venous plasma glucose results. Firstly, although the POCT devices report plasma equivalent glucose concentrations, the different sample types used for the POCT (capillary whole blood) and laboratory (venous plasma) measurements may have introduced variation. Post-prandial glucose concentrations may be up to 7% higher in capillary than corresponding venous blood samples 36 and subjects in this evaluation were non-fasting. Secondly, there was a delay of up to 5 h between venesection and sample separation for analysis in the laboratory. Fluoride, a glycolysis inhibitor, contained in glucose sample tubes does not fully prevent glucose metabolism prior to separation.37,38 Thus, a combination of incomplete inhibition of glycolysis and the variation in time of separation may have contributed to the observed differences between the POCT and laboratory results. Indeed, the mean percentage bias (versus the Roche method) exhibited by the LDX for glucose measurement during laboratory imprecision experiments (Tables 1 and 2), when the delay between sample collection and analysis was less than 1 h, was lower (2.2%) than that observed in the field study (13%) (data not shown). The percentage bias (vs. Roche method) observed for the CardioChek during the laboratory imprecision experiments (<1 h delay between sample collection and analysis) was −10.6%.
Of the known possible interferents of the LDX and CardioChek assays, Hct and ascorbic acid interference were deemed to be two of the most likely to be encountered in routine use. The effect of sample Hct on dry reagent assays, such as those employed by the LDX and CardioChek, is well recognized and this evaluation showed that extremes of sample Hct may give rise to erroneous results.39–42 Erroneous results were reported by the CardioChek when the sample had a Hct level outside of its operating range (which would be impossible to detect by the user) whereas the LDX gave an error message and did not report a result. The Trinder reaction based assays utilized by the LDX and CardioChek are prone to negative interference from reducing agents such as ascorbic acid (43,44 and references therein). Ascorbic acid negatively interfered in all three assays on both POCT devices at concentrations likely to be found in individuals taking 1 g and 2 g of vitamin C supplements per day, 15 which is particularly relevant given the prevalence of vitamin supplement consumption in the general population.
Although inherently subjective, we assessed the user-friendliness, robustness and potential sources of user dependent error of each POCT analyser because these devices are typically operated by non-laboratory personnel in community clinics outside of constant laboratory supervision. On balance, both ourselves and the operators in the community clinics found the LDX and its associated sample collection device (see below) to be more user-friendly than the CardioChek. It is important that potential sources of user-dependent error are identified so that steps can be put in place to minimize the risk of incorrect results being reported. We identified several clinical governance issues which would need to be considered when establishing a community POCT based NHS Health Checks service; some were issues common to both but others unique to each analyser. More potential clinical governance issues were observed for the CardioChek. Although, neither POCT analyser currently possesses a number of features desired in a POCT device 45 such as LIMS connectivity, restriction of user access via operator ID entry and the ability to prompt operators to perform system and IQC checks and prevent patient testing if either has failed. With regard to the CardioChek's supplied IQC material, we have been informed that the manufacturer of the CardioChek have since addressed the issue of the IQC ranges although, at the time of writing this had not been tested [Andy Greaves – BHR Pharmaceuticals, personal communication]. One of the key user-dependent steps common to both of these POCT devices is sample collection and so thorough training and competency assessment are essential to ensuring that users are capable of consistently obtaining suitable specimens. The CardioChek is reliant on the operator to check the underside of the strip and interpret whether or not the colouration of each reaction pad is even in order to identify insufficient sample application. Failure to do so may result in erroneous results being reported and so the authors believe that this has clinical governance implications for the CardioChek. Furthermore, since users found the CardioChek sample collection system to be less user-friendly than that supplied with the LDX, we opted to use the LDX collection device for both POCT analysers throughout the evaluation.
The use of POCT for the measurement of TC, HDL-C and glucose as part of an NHS Health Check has a number of advantages when compared to the traditional laboratory methods. It is less invasive, it reduces the number of visits and allows on the spot counselling which may be important when targeting individuals who have little contact with healthcare professionals and who may not be identified by traditional primary care routes. However, in order to make POCT a suitable choice for the delivery of NHS Health Checks, it is essential that the analytical performance of the POCT analyser is fit for purpose and both the laboratory and users are aware of pre-analytical factors and governance issues. Cost is an additional key consideration when planning a POCT based NHS Health Checks service. The CardioChek is significantly cheaper than the LDX in terms of both capital and running costs and this may be an important factor in procurement decision making.
Footnotes
Acknowledgements
The authors would like to thank Dr L. Heath and the staff in the Public Health Department of the Wolverhampton Primary Care Trust for their help in setting up and managing the NHS Health Check clinics. We also thank BHR Pharmaceuticals (CardioChek) and Alere Ltd (LDX) for the loan of the POCT analysers and Birmingham Quality (UK NEQAS) and WEQAS for providing the EQA samples and accompanying scheme data. We gratefully acknowledge the help of staff from the New Cross Hospital Heart and Lung Department for helping to organize health check days (Pauline Caines and Paula Bourke) and for providing help with the phlebotomy (Annette Russell and Kim Pincher).
Declaration of conflicting interests
None declared.
Funding
This study was funded by the Wolverhampton City Primary Care Trust's Department of Public Health (Coniston House, Chapel Ash, Wolverhampton).
Ethical approval
Permission for data to be published has been granted by the Royal Wolverhampton NHS Trust Caldicott Guardian.
Guarantor
RG.
Contributorship
SJW and CF conceived the study in collaboration with the Wolverhampton City Primary Care Trust's Department of Public Health. SJW researched the literature, designed the studies, carried out the majority of the phlebotomy, analysed the venous samples, processed and analysed the data, and wrote the first draft. All authors reviewed and edited the manuscript, and approved the final version of the manuscript.