
Abstract
Background
Measurement of procollagen type I N-terminal propeptide (PINP) concentration in serum reflects the rate of type I collagen synthesis and can therefore be used as a bone formation marker. There are two methods of PINP quantification; the first measures the trimeric propeptide (intact PINP) and the second measures both the trimeric and monomeric propeptides (total PINP). Trimeric PINP is excreted via hepatic endothelial cells, whereas monomeric PINP is cleared renally. Therefore, in renal failure, the total assay has a positive bias with respect to the intact assay, due to monomeric PINP accumulation. The aim of this study was to compare the performance of both assays across all stages of chronic kidney disease.
Methods
Serum was taken from male (n = 111) and female (n = 105) patients attending a metabolic bone clinic, and these were partitioned into stages of chronic kidney disease 1–5. Each serum sample was analysed using the Roche electrochemiluminescence immunoassay for total PINP and the Immunodiagnostic Systems chemiluminescence immunoassay for intact PINP.
Results
Passing-Bablok regression analysis comparing both methods showed that with advancing chronic kidney disease there was a proportional positive bias affecting the total assay when compared with the intact assay. This proportional positive bias was statistically significant for chronic kidney disease stages 3b, 4 and 5.
Conclusions
Based on this method comparison study, usage of the total PINP assay should be avoided in chronic kidney disease stages 3b, 4 and 5 (eGFR ≤44 mL/min/1.73 m2) and instead an intact assay used as the total assay overestimates PINP concentrations due to monomeric PINP accumulation.
Introduction
Type I collagen is the most abundant collagen within the human body, most of which is located within mineralized bones where it constitutes 90% of the organic matrix. It is also found in tendons, skin, connective tissue and ligaments. Two genes are involved in its production, COL1A1 and COL1A2, located on chromosomes 17 and 7, respectively. It is formed from a precursor, procollagen I, which is synthesized by osteoblasts and fibroblasts.1–3 The aminoterminal (PINP) and carboxy-terminal (PICP) extensions of procollagen I are cleaved in equimolar amounts during fibril formation which forms the structural scaffolding within the bone matrix. The PINP and PICP propeptides are detectable in the blood, and serum PINP concentration can be used as a marker of osteoblastic activity, and hence of bone formation. 4 PINP is first released in a trimeric (intact) form which has a molecular weight of approximately 35 kDa; this is cleared rapidly by liver endothelial cells. Trimeric PINP predominates in healthy human serum with minimal amounts of its less understood counterpart, monomeric PINP. The origin, detailed structure and molecular weight of monomeric PINP has not yet been characterized, although it has been suggested that it originates from degradation within tissues of type I collagen molecules that have retained the aminoterminal propeptide (so called pN-collagen).4–6 Clearance of this monomeric form of PINP is dependent on kidney function. 7 Although type I collagen synthesis occurs in both osteoblasts and fibroblasts in bone and soft tissues, respectively, circulating PINP is predominantly derived from activity within bone. 5
There are two principal methods of PINP quantification; the first measuring the trimeric propeptide (intact PINP) and the second method which measures both the trimeric and monomeric fractions (total PINP). At present, there are four commercially available immunoassays for the measurement of PINP in blood. Two are available on automated platforms: Immunodiagnostic Systems (IDS) on the iSYS automated analyser (IDS, Boldon, UK) and Roche Diagnostics instruments (Mannheim, Germany). Two manual assays are available including a radioimmunoassay (RIA) produced by Orion Diagnostica (UniQ PINP RIA, Orion Diagnostica, Espoo, Finland) and an enzyme-linked immunosorbent assay (ELISA) produced by USCN Life Science (Houston, TX, USA). Both the IDS and Orion Diagnostica methods measure intact PINP, whereas the Roche and USCN Life Science methods measure total PINP.
In healthy subjects with normal renal function, intact and total PINP concentrations correlate well. 4 Indeed, a recent position paper by the International Federation of Clinical Chemistry and Laboratory Medicine and The International Osteoporosis Foundation (IFCC/IOF) Joint Committee on Bone Metabolism concluded that in subjects with normal renal function, the two available automated PINP assays (Roche Cobas® and IDS iSYS) have similar performance and may be used interchangeably. 8 Given that the available assays measure different PINP fractions, however, the authors considered that, going forward, harmonization would be a more realistic goal than standardization.
As the monomeric form of PINP accumulates in CKD patients, the total assay can overestimate PINP concentration, whereas the intact assay remains unaffected in this situation.8–10 Hence, the advantage of a trimeric (or intact) assay over the total PINP assay is that it can be used as an indicator of bone formation in patients with renal impairment. Crucially, it is this group of patients with renal impairment that are indeed more susceptible to metabolic bone disorders due to disordered calcium, phosphate, vitamin D and parathyroid hormone (PTH) homeostasis. Therefore, having a reliable bone formation assay is of considerable importance for diagnostic purposes.
From a preanalytical standpoint, unlike with other bone turnover markers such as C-terminal telopeptide of type I collagen (CTX-I), specimen collection conditions for PINP are less critical, as it has minimal circadian variability and is not affected by food intake lending it favourable to the outpatient or primary care setting.11,12
As stated above, the trimeric form of PINP can be measured using the IDS chemiluminescence immunoassay (CLIA) on the iSYS platform. Currently, the Liverpool University Hospitals NHS Foundation Trust (LUHFT) laboratory uses the Roche automated electrochemiluminescence immunoassay (ECLIA) for total PINP. Patients attending the LUHFT metabolic bone clinic have a range of metabolic bone disorders such as osteoporosis, osteomalacia, chronic kidney disease-mineral and bone disorder (CKD-MBD) and Paget’s disease. A significant proportion of these patients also have renal impairment of varying degrees. The currently used total PINP assay is suspected to be of limited utility in this group of CKD patients due to the accumulation of monomeric PINP in renal failure, leading to unreliable estimates of bone formation.
The aim of this study is to identify the degree of renal failure at which the total PINP assay is no longer a reliable biomarker to assess bone formation, by comparing it to the intact method. Previous studies have not yet fully characterized this relationship.
Material and methods
Subjects
This study utilized serum samples taken from patients attending the LUHFT metabolic bone clinic between February 2019 and May 2020 that had PINP requested as part of their clinic investigations. Serum was obtained from male (n = 111) and female (n = 105) patients with samples spanning all CKD categories; CKD 1 (n = 40), CKD 2 (n = 55), CKD 3a (n = 40), CKD 3 b (n = 39), CKD 4 (n = 22) and CKD 5 (n = 20). Mean age was 65 years old for males (range 23–94) and 71 years old for females (range 22–92). Blood specimens were taken during normal working hours and the serum separated before undergoing analysis on the Roche Cobas® e601 platform (Roche, Mannheim, Germany) for total PINP. A separate aliquot of serum was taken and stored frozen at –20°C. Once the desired number of samples was obtained, the frozen samples were thawed and then analysed in batches using the IDS-iSYS intact PINP assay. Fasting status and time of day were not controlled in this study, as previous studies showed that PINP concentration is not influenced by such factors.11,12
Intact PINP assay
IDS iSYS intact PINP kits were employed on the iSYS Multi-Discipline automated analyser (Immunodiagnostics Systems, Boldon, UK) and used in accordance with manufacturer protocols. The intra- and inter-assay coefficients of variation stated by the manufacturer were 2.6–3.0% and 3.2–4.4%, respectively. These precision data were based on three serum controls analysed in quadruplicate, once per day for a period of 20 days (n = 80).
Total PINP assay
Total PINP was measured in singlicate using the Roche Elecsys® ECLIA method, in accordance with the manufacturer's instructions (Roche Diagnostics, Mannheim, Germany). The intra- and inter-assay coefficients of variation stated by the manufacturer were 1.7–3.2% and 2.3–3.7%, respectively. These precision data were based on five human serum controls analysed over two runs per day, in duplicate, for a period of 21 days (n = 84).
CKD staging
Creatinine was measured enzymatically using a Roche Cobas® modular analyser (Roche, Mannheim, Germany). To calculate the estimated glomerular filtration rate (eGFR), the Modification of Diet in Renal Disease (MDRD) formula was used, and from this, patients were stratified into stages of CKD from 1–5 using the Kidney Disease: Improving Global Outcomes (KDIGO) 2012 cut-offs.
Statistical analysis
Statistical analysis was performed using Analyse-it software for Microsoft Excel, UK. Linear correlation between the two methods was assessed by the Pearson correlation coefficient. For the two methods to be in agreement, the 95% confidential interval (CI) of the slope must include the value 1 and the 95% CI of the intercept include 0 (Table 2). Differences were considered to be significant at P < 0.05.
Results
Comparisons between intact and total PINP assays across CKD categories
Table 1 summarizes the different intact and total PINP results obtained at different stages of CKD. Both methods produced similar PINP values in patients with CKD 1–3a. However, as the stage of CKD worsened, the methods produced increasingly divergent results with the total PINP assay yielding increasingly higher PINP values. The average concentration of total PINP in CKD stage 5 patients was approximately five times higher than for intact PINP; total PINP (mean ± SD) 409.8 ± 355.6 µg/L and intact PINP 80.0 ± 39.1 µg/L.
Means, standard deviations (SDs) and medians for both intact and total PINP methods across different CKD stages.
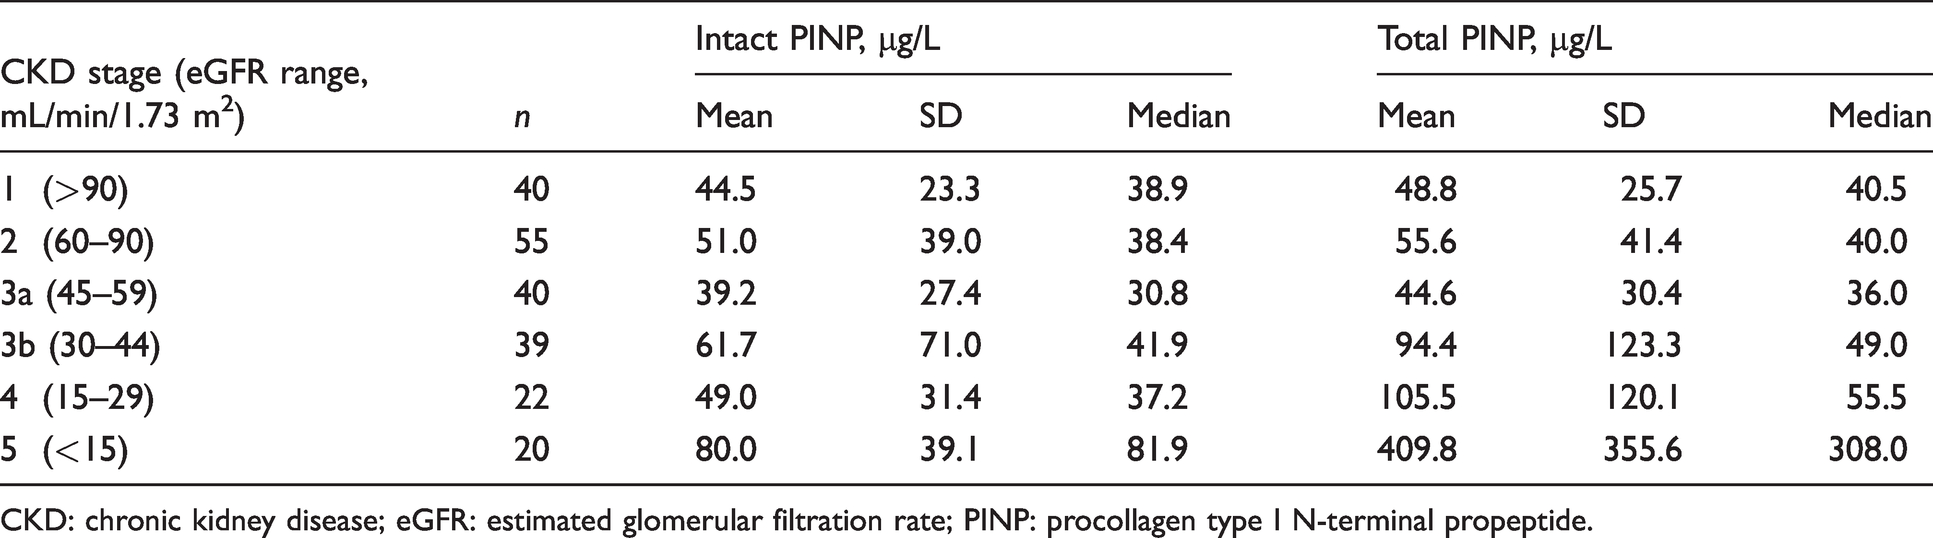
CKD: chronic kidney disease; eGFR: estimated glomerular filtration rate; PINP: procollagen type I N-terminal propeptide.
A high degree of linear correlation was found between the total and intact PINP assays across CKD stages 1–3b (Table 2 and Figure 4). For CKD stages 4 and 5, the degree of linear correlation was moderate, with correlation coefficients of r = 0.694 and r = 0.685, respectively. Passing-Bablok regression analysis (Table 2 and Figure 4) comparing total and intact PINP assays identified slopes of 0.98, 0.97 and 1.1 for CKD stages 1, 2 and 3a, respectively; moreover, the 95% slope CIs included 1 and the 95% CIs for the intercept included 0, thus indicating the methods were in agreement at these stages of CKD.
Linear correlations (r) and Passing–Bablok regressions comparing total and intact PINP methods at different stages of CKD.
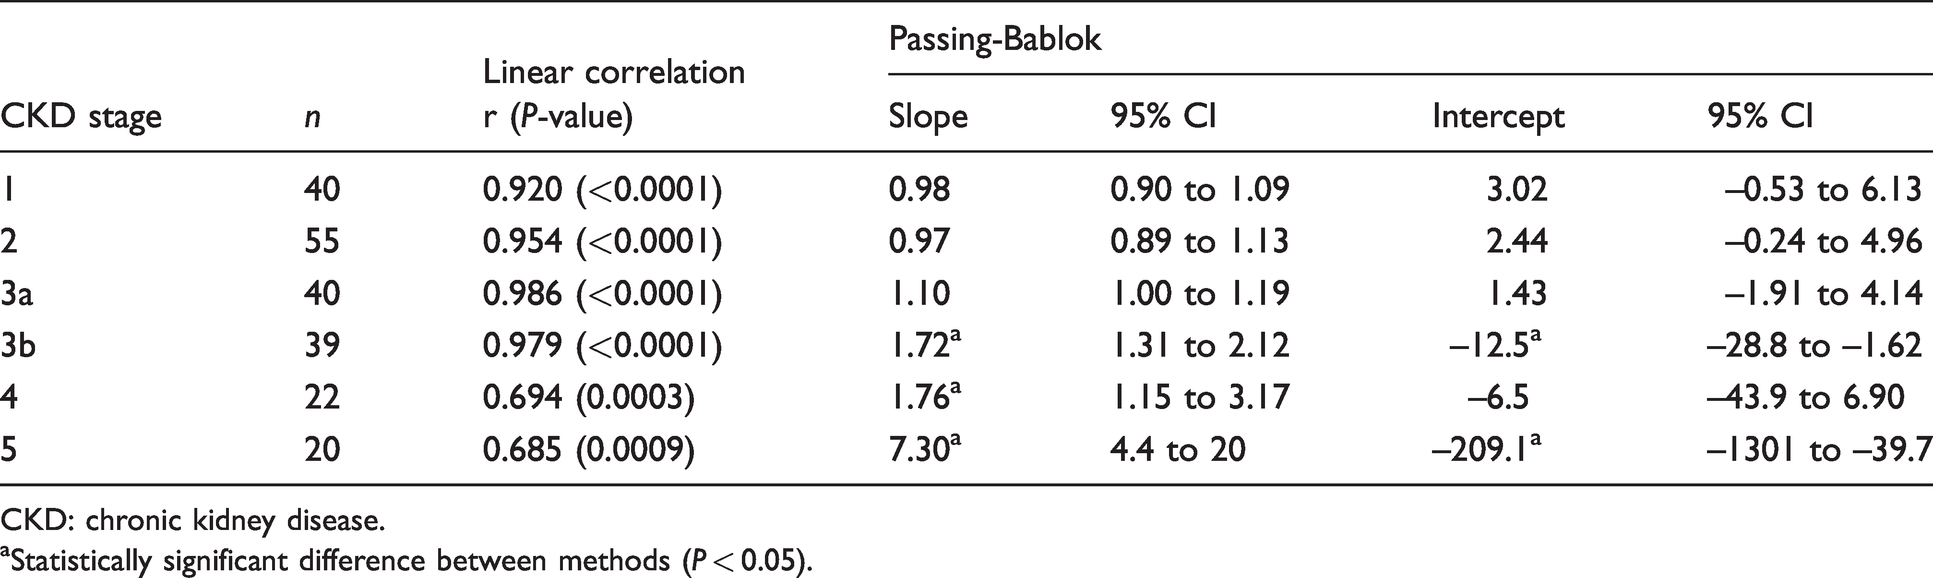
CKD: chronic kidney disease.
aStatistically significant difference between methods (P < 0.05).
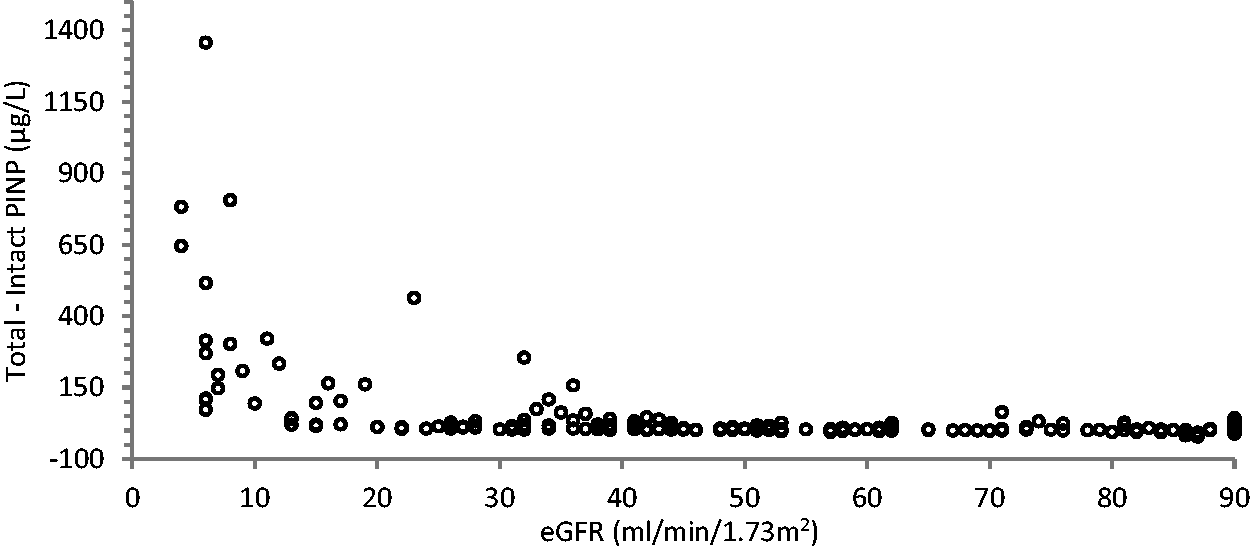
However, for CKD stages 3b, 4 and 5, the slopes increased to 1.72, 1.76 and 7.3, respectively, with the 95% slope CIs not including 1 in each case and the 95% intercept CI not including 0 for CKD stages 3b and 5, thus indicating the two PINP methods were not in agreement for CKD stages 3b, 4 and 5. At CKD stages 3b, 4 and 5, total PINP concentrations displayed a significant proportional positive bias with respect to intact PINP. This relationship of rising total PINP with declining eGFR became exponential once the eGFR dropped below 15 mL/min/1.73 m2 (see Figures 1 to 3). This marked increase seen in total PINP concentrations in advanced CKD was not observed in the intact PINP assay.
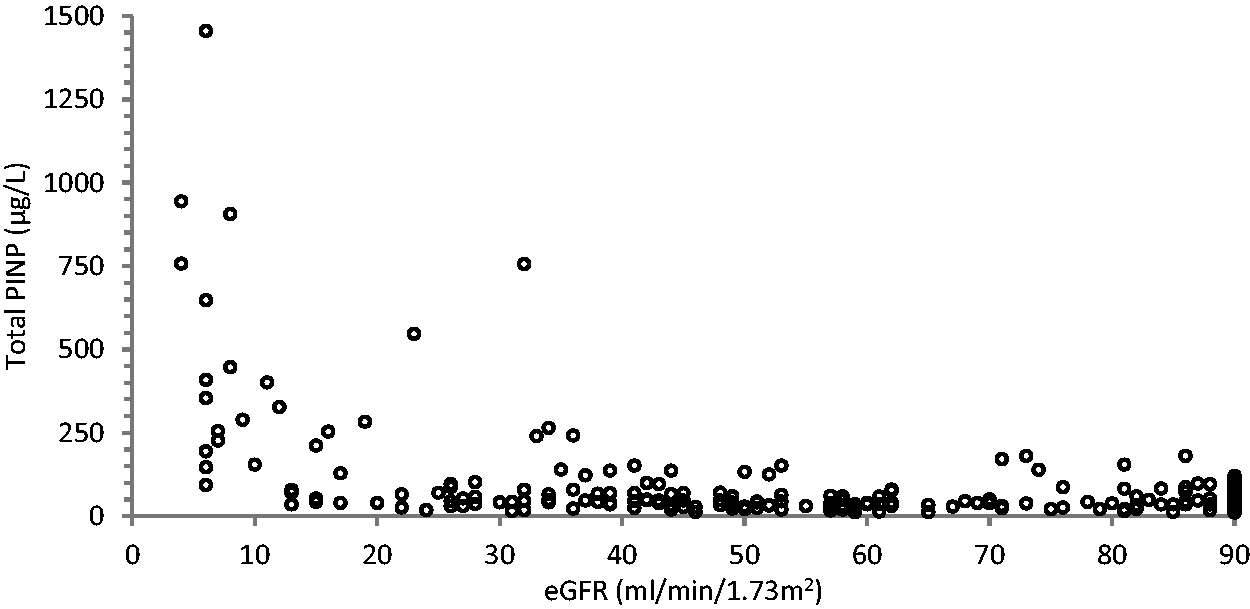
Scatter plot showing total PINP values obtained against the eGFR.
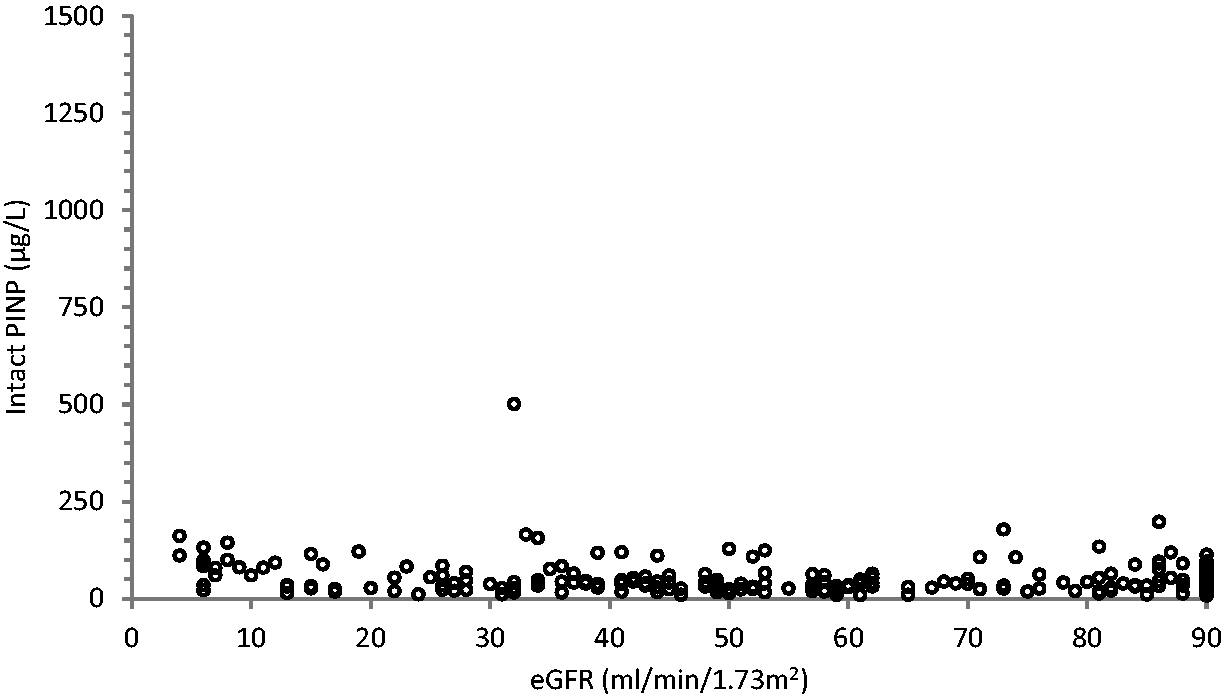
Scatter plot showing intact PINP values obtained against the eGFR.
Scatter plot of the difference between total and intact PINP methods (i.e. monomeric PINP concentration) against eGFR.
Given that the total PINP assay measures intact and monomeric PINP, Figure 3 is effectively a scatter plot showing the monomeric PINP concentration (i.e. total–intact) plotted against the eGFR, highlighting its exponential accumulation through CKD stage 5.
Discussion
As has been outlined in previous studies, monomeric PINP accumulates in advanced renal failure and this is thought to be the cause of the significant positive bias when using the total PINP assay rather than the intact assay.4,7,9,10 The intact PINP assay is not affected, as it is only measures the trimeric form of PINP which depends upon hepatic not renal clearance. Figure 3 displays this relationship of increasing monomeric PINP (calculated monomeric = total–intact PINP) with decreasing eGFR. As the eGFR reduces further through to end-stage renal failure, the total PINP values obtained show an exponential increase, whereas no such rise is seen with the intact assay (Figures 1 to 3). This finding has been observed in a previous study in 2013. 7 The IOF and IFCC Working Group on Bone Marker Assays (WG-BMA) recommended that, based on this 2013 study, the intact PINP assay should be used in patients with an eGFR below 30 mL/min/1.73 m2 (i.e. CKD stages 4 and 5).
From the Passing-Bablok regression analysis comparing the two PINP assays (Figure 4 and Table 2), it can be seen that, despite a high degree of linear correlation for CKD stages 1–3b and moderate correlation for CKD 4–5, a significant proportional positive bias for total PINP was observed for CKD stages 3b–5. Moreover, as the 95% intercept CI for CKD stages 3b and 5 did not include 0, this would also indicate a systematic bias. From these data, one can conclude that for patients with an eGFR ≤44 mL/min/1.73 m2 (i.e. CKD 3b, 4 and 5), there is a statistically significant difference between the two assays for PINP and they are no longer directly comparable.
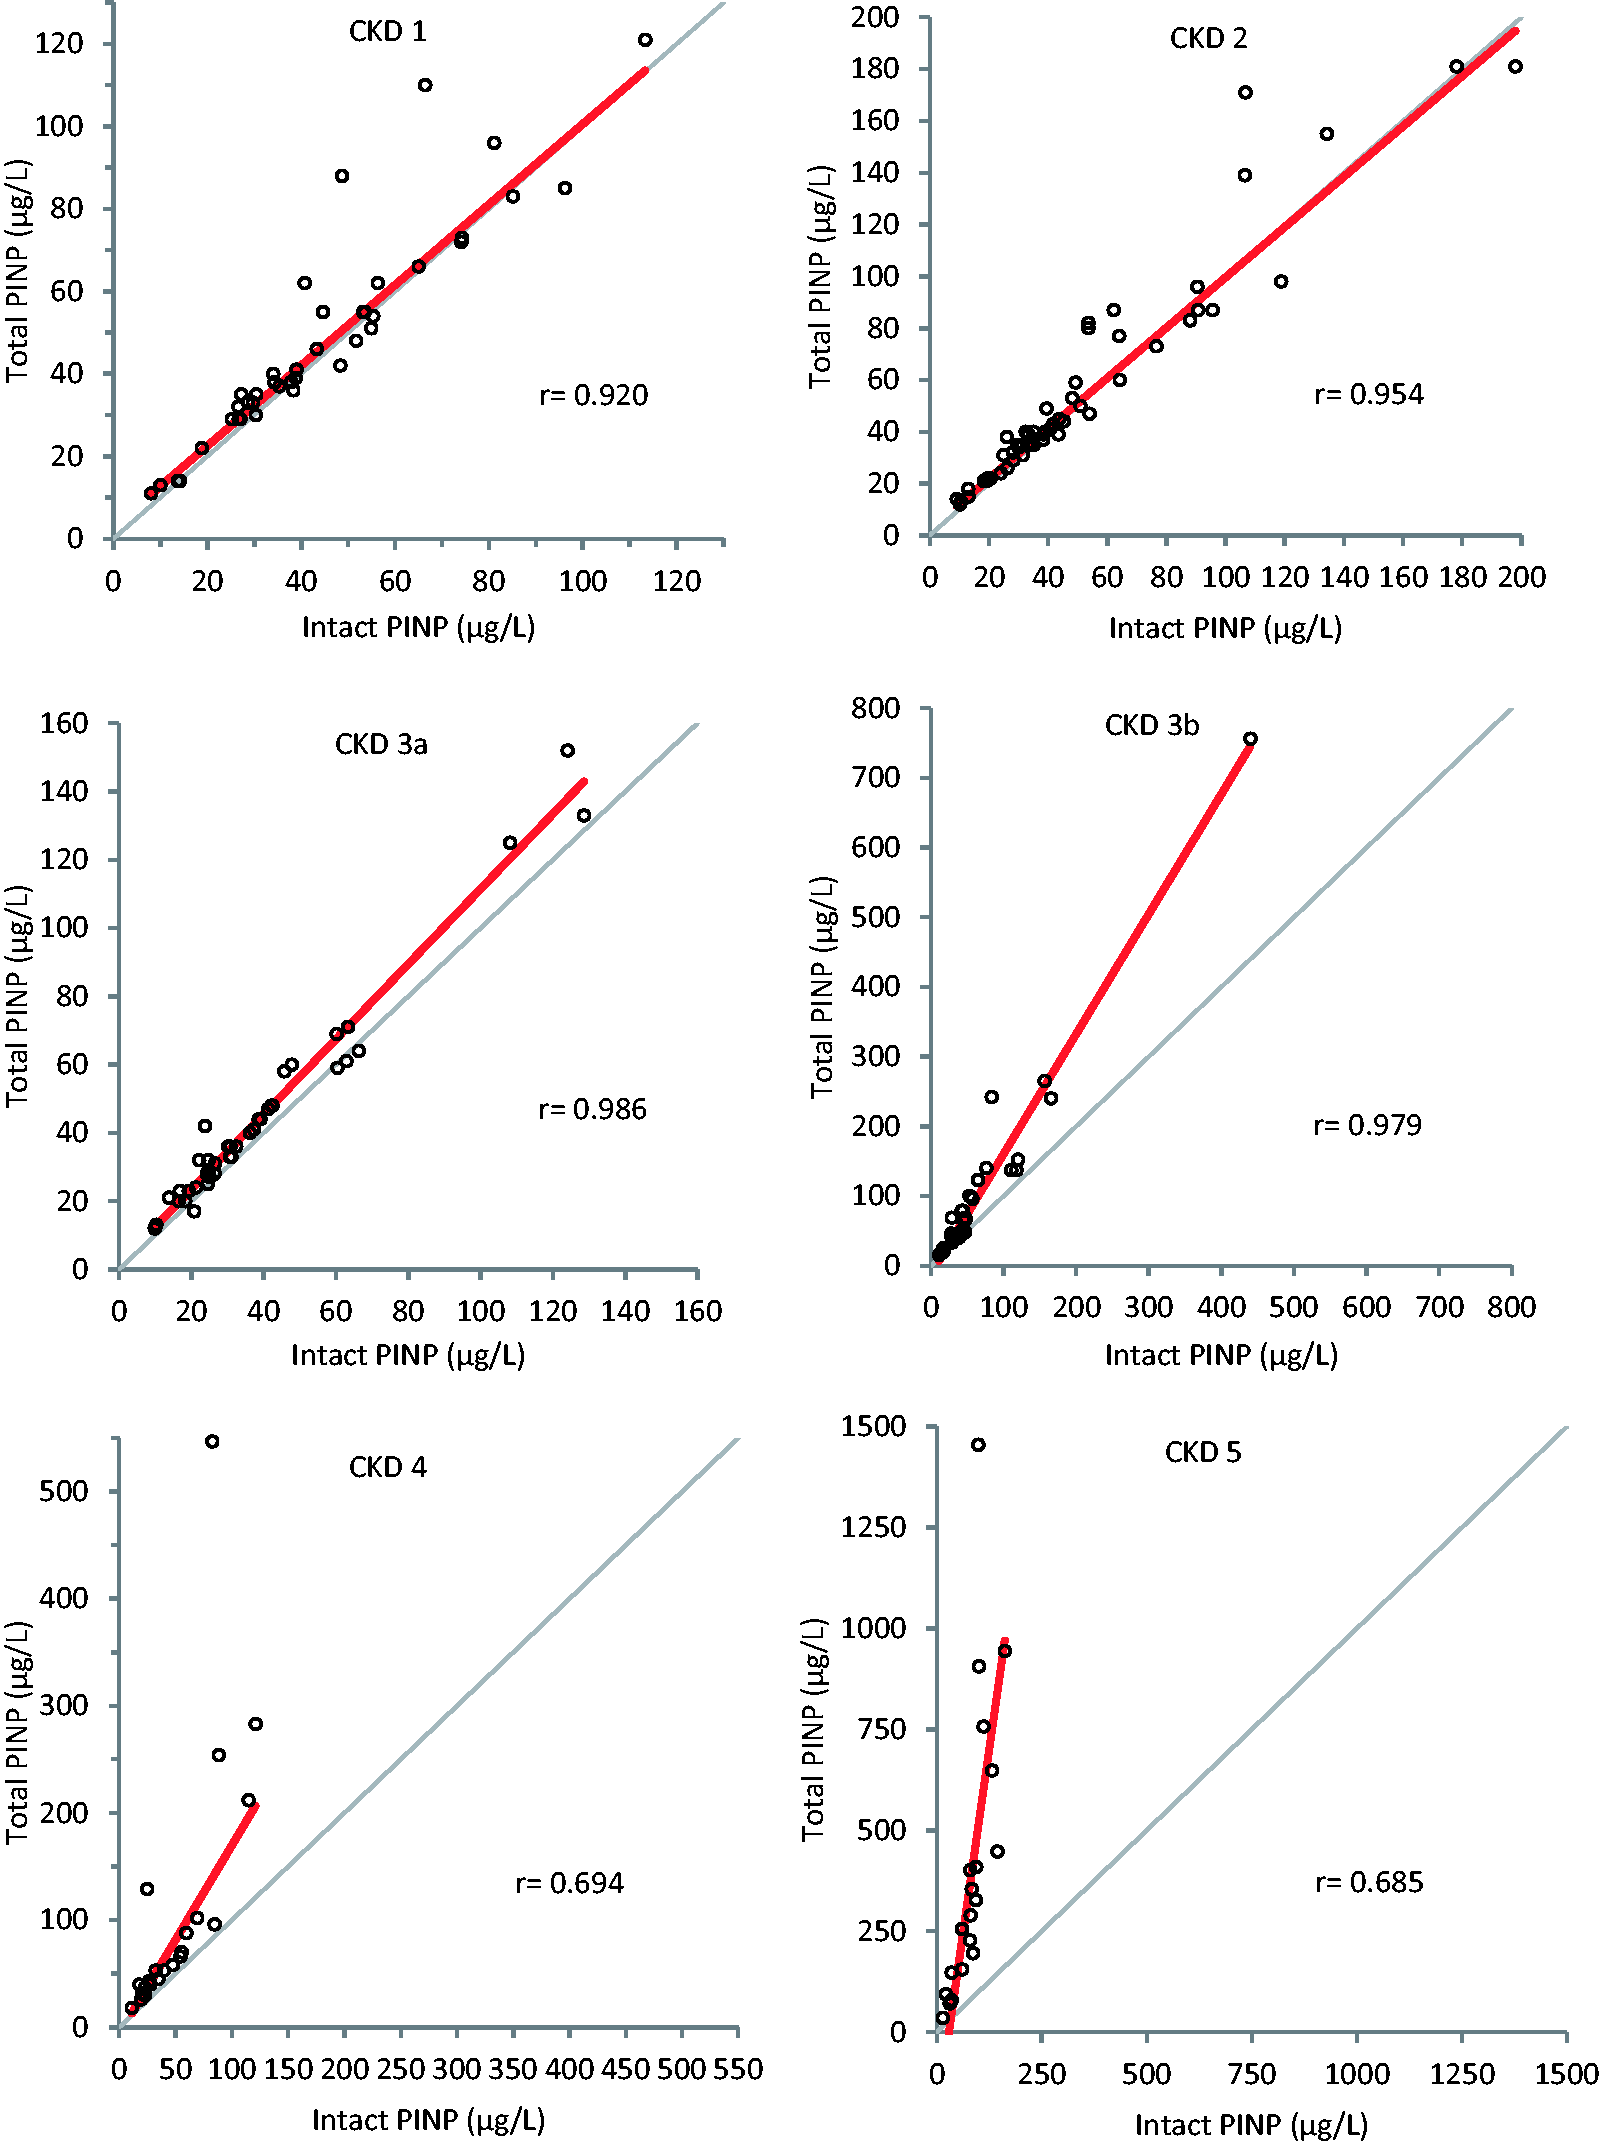
Passing-Bablok regression graphs comparing intact and total PINP methods at different stages of CKD 1–5. The thick red line represents the regression line and the thin grey line represents the line of identity.
From reviewing the CKD stage 3a graph on Figure 4, a slope of 1.10 (95% CI 1.00 to 1.19) is noted, giving the suggestion that monomeric PINP starts to accumulate in mild to moderate renal impairment (eGFR 45–59 mL/min/1.73 m2). However, since 1 is included within the 95% slope CI, there is no significant proportional difference between the two methods, although it is borderline.
The positive bias seen for total versus intact PINP, which is proportional to the degree of renal failure, is sufficient to recommend that for accurate assessment of bone formation, intact rather than total PINP should be measured in patients with an eGFR ≤44 mL/min/1.73 m2; the cut-off now including CKD stage 3b unlike the previous study, 7 which did not perform a detailed method comparison for each subgroup of CKD. One limitation of our study, however, is that instead of using the CKD stage groups, comparing assay performance across a greater number of eGFR partitions, may have allowed us to determine a more precise eGFR cut-off at which point the two assays begin to differ significantly in performance. This would have required a larger sample size however. Future studies focusing on an eGFR range between 30 and 59 mL/min/1.73 m2 would help in identifying a more exact decision point.
Utilizing the intact PINP assay in patients with moderate to advanced renal impairment will allow more accurate assessment of bone formation to inform clinical decisions. Using a total PINP assay in such cases may increase the likelihood of inappropriate treatment choices, for example, in a patient with Paget’s disease and concomitant CKD. Active Paget’s is characterized by increased osteoblast activity and subsequent osteoid production leading to a rise in PINP concentrations. 13 An elevated total PINP result suggests active Paget’s disease, providing evidence which may increase the likelihood of treatment with bisphosphonates. However, based on this study’s findings, such a patient may be found to have a reference range intact PINP signalling biochemically quiescent Paget’s, hence treatment may not be required. Clearly other factors such as clinical examination, symptoms and other biochemical parameters will inform treatment decisions; however, having reliable biochemical markers is imperative, particularly when considering that the IFCC-IOF WG-BMA specifically cite blood PINP as the bone formation marker of choice, 12 and regarding this particular example, PINP is also the bone marker of choice in assessing the activity of Paget’s disease.13,14 Bone alkaline phosphatase (bALP) would, of course, be an alternative marker in such CKD patients; however, a prior meta-analysis concluded that PINP performed better at assessing Pagetic disease activity when compared with quantitative bone scintigraphy. 15
Currently, it is difficult to accurately determine which subtype of CKD-MBD a patient has without using the gold standard test of bone histomorphometry on tissue obtained from a bone biopsy. 16 Having a reliable serum marker of bone formation in patients with renal failure may help to differentiate between low and non-low bone turnover states; indeed, studies have identified the potential of intact PINP at discriminating between these two states when compared with histomorphometry, with an AUC of 0.79 for discriminating low bone turnover. 10 Since the treatment of each subtype is different, correct diagnosis is imperative. Moreover, having a reliable serum biomarker may reduce the need for invasive investigations such as bone biopsy, which carries risk and inconvenience for the patient. bALP and tartrate-resistant acid phosphatase 5b (TRAP5b) appear to have a similar performance to intact PINP in differentiating these two bone turnover states. Other non-invasive tests such as radius high-resolution peripheral computed tomography (HR-pQCT) also appear to perform well; however, cost and availability currently limit its use. 10
There are a range of other metabolic bone disorders, including the common diagnosis of osteoporosis, in which a reliable bone formation marker would be of significant diagnostic use in those with coexisting renal impairment; indeed, renal impairment and osteoporosis often co-exist in the elderly. 17
In the CKD stage 1 group, the degree of linear correlation between the two methods was marginally less than for CKD stages 2 and 3a (r = 0.920 versus 0.954 and 0.986, respectively). One of the significant outliers in the CKD stage 1 group was diagnosed as having alcoholic liver disease with cirrhosis with a measured intact PINP of 66.4 µg/L and a total PINP of 110 µg/L. It is known that intact PINP is cleared by the hepatic endothelial cells. However, the function of the endothelial cells of the liver is not significantly impaired in advanced liver disease 5 therefore one would not expect significantly different intact PINP concentrations. This discrepancy between the two PINP assays is likely to originate from differences in monomeric PINP. A possible explanation for the discrepancy could be the use of creatinine for eGFR calculations which is recognized to overestimate the GFR in liver disease patients 18 who often have low muscle mass and protein malnutrition; thus, eGFR derived from creatinine may not truly reflect their underlying renal function and thus ability to excrete the monomeric PINP. However, this alone is unlikely to explain the degree of difference seen.
Previous studies have shown good comparability between total and intact PINP assays in patients with advanced liver disease, once those with significant renal impairment were excluded. 19
A study by Koivula et al. 4 found that bedridden geriatric patients had higher monomeric PINP compared with healthy controls, independent of their renal function. Their explanation was that such patients are likely to have increased catabolism of connective tissue. By subtracting intact from total PINP, they determined the amount of monomeric PINP. They then compared this to the concentration of carboxy-terminal cross-linked telopeptide of type I collagen (ICTP) and found the concentrations correlated significantly and, given that ICTP concentration gives an indication of type I collagen catabolism, they hypothesized that this monomeric PINP was originating from tissue collagen breakdown (as opposed to bone formation). Similarly, a study looking at breast cancer patients with and without bone metastases found that the total PINP assay gave higher concentrations than intact PINP, and this relationship was most prominent within the metastatic group. 20 Once again their conclusion was that the elevated monomeric fraction was originating from tissue type I collagen catabolism, and not increased synthesis.
As aforementioned, monomeric PINP is thought to originate from degradation within tissues rich in type I collagen that have retained the aminoterminal propeptide (so called pN-collagen).4–6 Thus, a possible explanation for this outlier in the CKD stage 1 group could be the presence of underlying connective tissue catabolism releasing monomeric PINP, thereby leading to a higher total PINP despite having normal renal function. More evidence for this hypothesis is provided by one of the other outliers noted in the CKD stage 1 group; a patient known to have polyostotic fibrous dysplasia. Despite an eGFR >90, the patient had an intact PINP of 48.7 µg/L with a total PINP of 88 µg/L. This mosaic disorder involves replacement of normal bone with fibro-osseous tissue and increased osteoclast activity. 21 This increase in monomeric PINP, which is the most likely cause for the difference between the two assay results, could be a reflection of underlying fibrous tissue catabolism.
This study clearly describes the difference between the intact and total PINP assays in renal failure; however, further research is needed to characterize the differences between the assays in disorders resulting in catabolism of type I collagen. So far, existing research has shown higher concentrations of monomeric PINP in bedridden inpatients independent of renal function. It has also shown higher monomeric PINP in breast cancer patients with metastases when compared with those without. In both scenarios, total and intact PINP assays yield different results. More work is needed to provide a more detailed picture of monomeric PINP concentrations across a wider range of disease states other than CKD. Without knowledge of what other conditions drive monomeric PINP production, there will be an element of diagnostic uncertainty when utilizing total PINP concentrations to infer bone formation beyond the healthy ‘normal’ population. Excluding such patients from this study may have improved the characterization of assay performance across the spectrum of renal function. Indeed, had these two outliers alone been excluded, the correlation coefficient for the CKD stage 1 group would have been better at r = 0.97 (as opposed to r = 0.92, which still represents a high degree of correlation).
One further point of consideration is that previous studies have found disturbed metabolism of connective tissues in renal failure patients 22 and thus increased connective tissue production, and not simply reduced renal excretion of monomeric PINP, may account for higher monomeric PINP in some renal failure patients.
A bone formation marker which is reliable in renal impairment will facilitate more accurate diagnosis, allowing the clinician to tailor the most appropriate management plan, subsequently improving patient care and cost-saving for the care provider by directing resources appropriately. Intact, not total PINP, should be used in patients with CKD stages 3b, 4 and 5 to reliably assess bone formation. Failure to do so increases the risk of misdiagnosis or misclassification of patients which may ultimately lead to inappropriate clinical management decisions.
Conclusion
Based on this method comparison study, the total PINP assay should be not be used in CKD stages 3b, 4 and 5 (eGFR ≤44 mL/min/1.73 m2) and instead an intact PINP assay used. This is due to a positive bias in total PINP measurement compared with intact which is proportional to the degree of renal failure, resulting from the accumulation of monomeric PINP. Further research is needed to investigate the differences between the two PINP assay types in conditions affecting connective tissue catabolism which may also increase monomeric and therefore total PINP concentrations.
Footnotes
Acknowledgements
We thank all of the hard-working clinical team running the Liverpool metabolic bone service.
Declaration of conflicting interests
The author(s) declared no potential conflicts of interest with respect to the research, authorship, and/or publication of this article.
Funding
The author(s) received no financial support for the research, authorship, and/or publication of this article.
Ethical approval
The Royal Liverpool Hospital metabolic bone clinic has a high turnover of patients with a large number having total PINP assessed at each visit, thus providing a large sample pool for this study. Given that the patients have already given consent for PINP testing, this negates the requirement for ethical approval for the purposes of this study. In addition, the clinical notes for the patients were studied for their monitoring in clinic and therefore no additional patient details were required.
Guarantor
AT.
Contributorship
AT, AM and EM contributed to the study concept. AT was responsible for the design, laboratory work, data acquisition, data analysis and drafting of the article; AM and EM assisted in revising the article critically for intellectual content. All authors reviewed and edited the article and approved the final version of the article.