
Abstract
Health-care providers and funders are focused on identifying value in all their services and that includes laboratories. This means that in order to gain a share of scarce resources, laboratory professionals must also understand and assess the value of tests and that includes their economic impact. This can be assessed using health economic modelling tools which, when used in conjunction with a detailed value proposition for the test, can translate laboratory information into value. While a variety of health economic assessment tools are available, this review will focus on the use of decision analytic models which essentially compare the outcomes from pathways with and without the new test, the value of which is being assessed. A step-by-step framework is provided to guide laboratory professionals through the essential steps of conducting the evaluation. Initial steps include mapping the clinical pathway, understanding the goal of the evaluation, identifying the key stakeholders and their needs and determining a suitable analytical model. Following collection of the actual data, the validity of the model must be checked, and the robustness of the outcomes tested through sensitivity analysis. The last step is to translate the findings into measures of value which can then inform appropriate decisions by the stakeholders. This review of basic health economic modelling should enable laboratory professionals to have an understanding of how modelling can be applied to tests in their own environment and help deliver their potential value.
Keywords
Introduction
Health-care systems have become increasingly aware of the potential impact of diagnostics on decision-making and health-care processes. Accordingly, they are seeking assessments of the value of testing as part of the process of making decisions on where and how to allocate scarce budgets.1,2 The laboratory community has had an ongoing challenge to demonstrate the value of testing for several reasons, including the fact that the benefits of testing are often remote from the testing process.
However, in recent years, there have been several professional-led initiatives aimed at developing frameworks and tools that can identify testing value.1,3–5 These include the use of a ‘value proposition’ which, as applied to a test, defines the clinical pathway in which the test is used, the stakeholders in the pathway and the benefits they receive from testing. 5 The value of the test in question may cover a range of outcomes including improved clinical outcomes for patients, an enhanced patient experience, more efficient processes, or financial benefits, all of which are detailed in the value proposition.6,7
A key part of the value proposition for a test is the evidence to support its use, the quality of which will determine its adoption by policy makers and inclusion in best practice clinical guidelines. The economic contribution of a new test to health-care outcomes can be evaluated through a health economic evaluation (HEE) such as in cost-effectiveness analyses.8–10 Such studies are relatively rare, so tests are more often adopted on the basis of clinical rather than cost-effectiveness. Similarly, although HEEs have also been used to drive the implementation of new services whereby global trials or other research findings or recommendations are translated into routine practice,11,12 this type of evidence for tests is also relatively uncommon.
The dearth of economic evidence in relation to tests is in part because the cost of the actual test is perceived as low and the laboratory testing model is based generally on one of minimizing costs. However, tests can have a substantial impact on the downstream costs of patient care by guiding management decisions, thus influencing the use of resources such as interventions, hospital stay or medication. Furthermore, tests themselves also require the investment of scarce resources. The implementation of a new test and its related change in management requires resources that will no longer be available for another service. To deal with these competing demands in a health-care environment increasingly focused on value, laboratory professionals need to develop a greater understanding of the concepts of HEE so that they are able to use it to show the value of a particular test and justify the investment to allow its implementation.11,13 Undoubtedly, there are challenges associated with showing the value of testing such as the difficulty in understanding the full course of action and outcomes from testing, the fact that there are often multiple stakeholders involved and that there is frequently inconsistent or no evidence of effectiveness or clinical utility. 14 To address these and other challenges, it is crucial for HEE to follow a highly structured and transparent test evaluation process. Accordingly, we describe a step-by-step process or framework, which can translate the value of a test into a variety of different value measures by using health economic analysis. All recommendations and the framework described here were derived from an extensive review of the literature, fundamental textbooks on health economics, best practice guidelines from international societies and personal experience. To illustrate application of the framework, we have used what might be a typical test implementation scenario for a hospital-based laboratory.
The overall objective of this paper is to provide an overview of the basic concepts of HEE to laboratory professionals so that at a minimum, they will have an understanding of how HEE could be applied to the implementation of a test in their own environment. While some potential readers may go on to be able to perform the actual analyses themselves, our more modest goal is that a majority of readers will gain sufficient understanding to be able to collaborate with a person more experienced with HEE tools who can then help them deliver effective test implementation from a health economic perspective.
Principles of HEEs
HEEs use a range of tools to provide robust data from an evidenced-based, systematic and analytical approach to help make decisions on where to invest money or allocate limited resources. 15 More specifically, HEEs seek to answer whether a health intervention such as a new test offers value for money compared with an alternative intervention, usually continuation of current practice. Thus, evaluations address questions about the most efficient allocation of resources such as the following. Which specifications have to be met by a laboratory service in order to improve the outcome per invested money? Should all patients entering the ED be tested or not? Which age groups might benefit from regular screening? Should society pay for a new test? What are the financial consequences of adoption and diffusion of a new laboratory service? Consequently, evaluations are based on a comparative analysis of alternative courses of action in terms of both their relative costs and consequences. With the baseline usually set by current practice, the analysis assesses the increase or decrease in costs and benefits from changing the strategy, which is known as incremental analysis. The ratio of the incremental costs divided by the incremental benefits, the incremental cost-effectiveness ratio (ICER), is used to compare alternative strategies. 16 It should be noted that the concept of ‘good value for money’ does not mean that the introduction of a new service is cost-saving. Instead, it may also improve outcomes but at extra costs. This requires the idea of a threshold indicating how much money the decision-maker is willing to pay to gain one extra unit of outcome. Only if the ICER is below this so-called maximum willingness to pay (WTP) threshold, the implementation of the new strategy is considered cost-effective or good-value for money. 16
In economics, costs are usually seen as opportunity costs. This is given by the fact that spending resources for a service means losing the opportunity to spend the resources elsewhere and gain benefits elsewhere. The opportunity costs are therefore defined as the value of the next best forgone alternative and has to be considered in decision-making.15,16 It should be noted, however, that it can be very difficult to explicitly identify the opportunity costs (e.g. in national level evaluations), but on a hospital level this may be more feasible.
Different types of economic evaluations exist to meet distinctive needs (see Table S1) and include comparative cost-effectiveness and the budget impact of implementing a new test. The highest quality evidence is regarded as coming from controlled trials where the downstream consequences of testing might include assessing the impact of testing on clinical outcome measures such as patient morbidity and mortality. However, such clinical trials are usually complex, expensive and as mentioned previously, are only rarely undertaken for laboratory tests. 17 Instead, the technique of economic modelling is a way to explore multiple scenarios or test-treatment pathways in a relatively flexible way. Thus, HEEs based on models play a specific and useful role in assessing the health economic impact of tests, which allow for an integration of data from several sources including both trial and audit data, an extrapolation over time or the translation into different outcomes or value measures.1,3 Model-based HEEs are particularly useful to link intermediate test results to downstream consequences, thereby filling a frequent information gap in the absence of evidence from clinical studies. Consequently, HEEs deal with imperfect information and related uncertainty. This ranges from stochastic uncertainty (e.g. random variability in outcomes between patients), parameter uncertainty (e.g. uncertain input assumption), heterogeneity (e.g. variability in patient characteristics), to structural uncertainty of the model. 18 Addressing these with appropriate statistical analyses is important in model-based HEEs to assess confidence in the study and results. 18 It should, however, be noted that HEEs can easily reach a high level of complexity. For example, evaluations that go beyond immediate clinical decisions and short-term consequences almost always require the involvement of specialists such as an experienced health economist to ensure a robust assessment. More information is provided in the supplement.
A case example for conducting HEEs of medical tests
A framework to guide laboratory professionals through the essential steps of conducting a HEE of medical tests is given in Table 1 and Figure 1. Each of the steps describes what are regarded as best-practice recommendations with the aim of translating the laboratory information provided in the case example (Box 1) into a number of different expressions of value and estimating the quantity of downstream effects and consequences. In each of the steps, an overview is provided on the main aspects followed by a section of more detail called ‘Further Information’ if required.
Modelling steps to translate laboratory information into value measures.
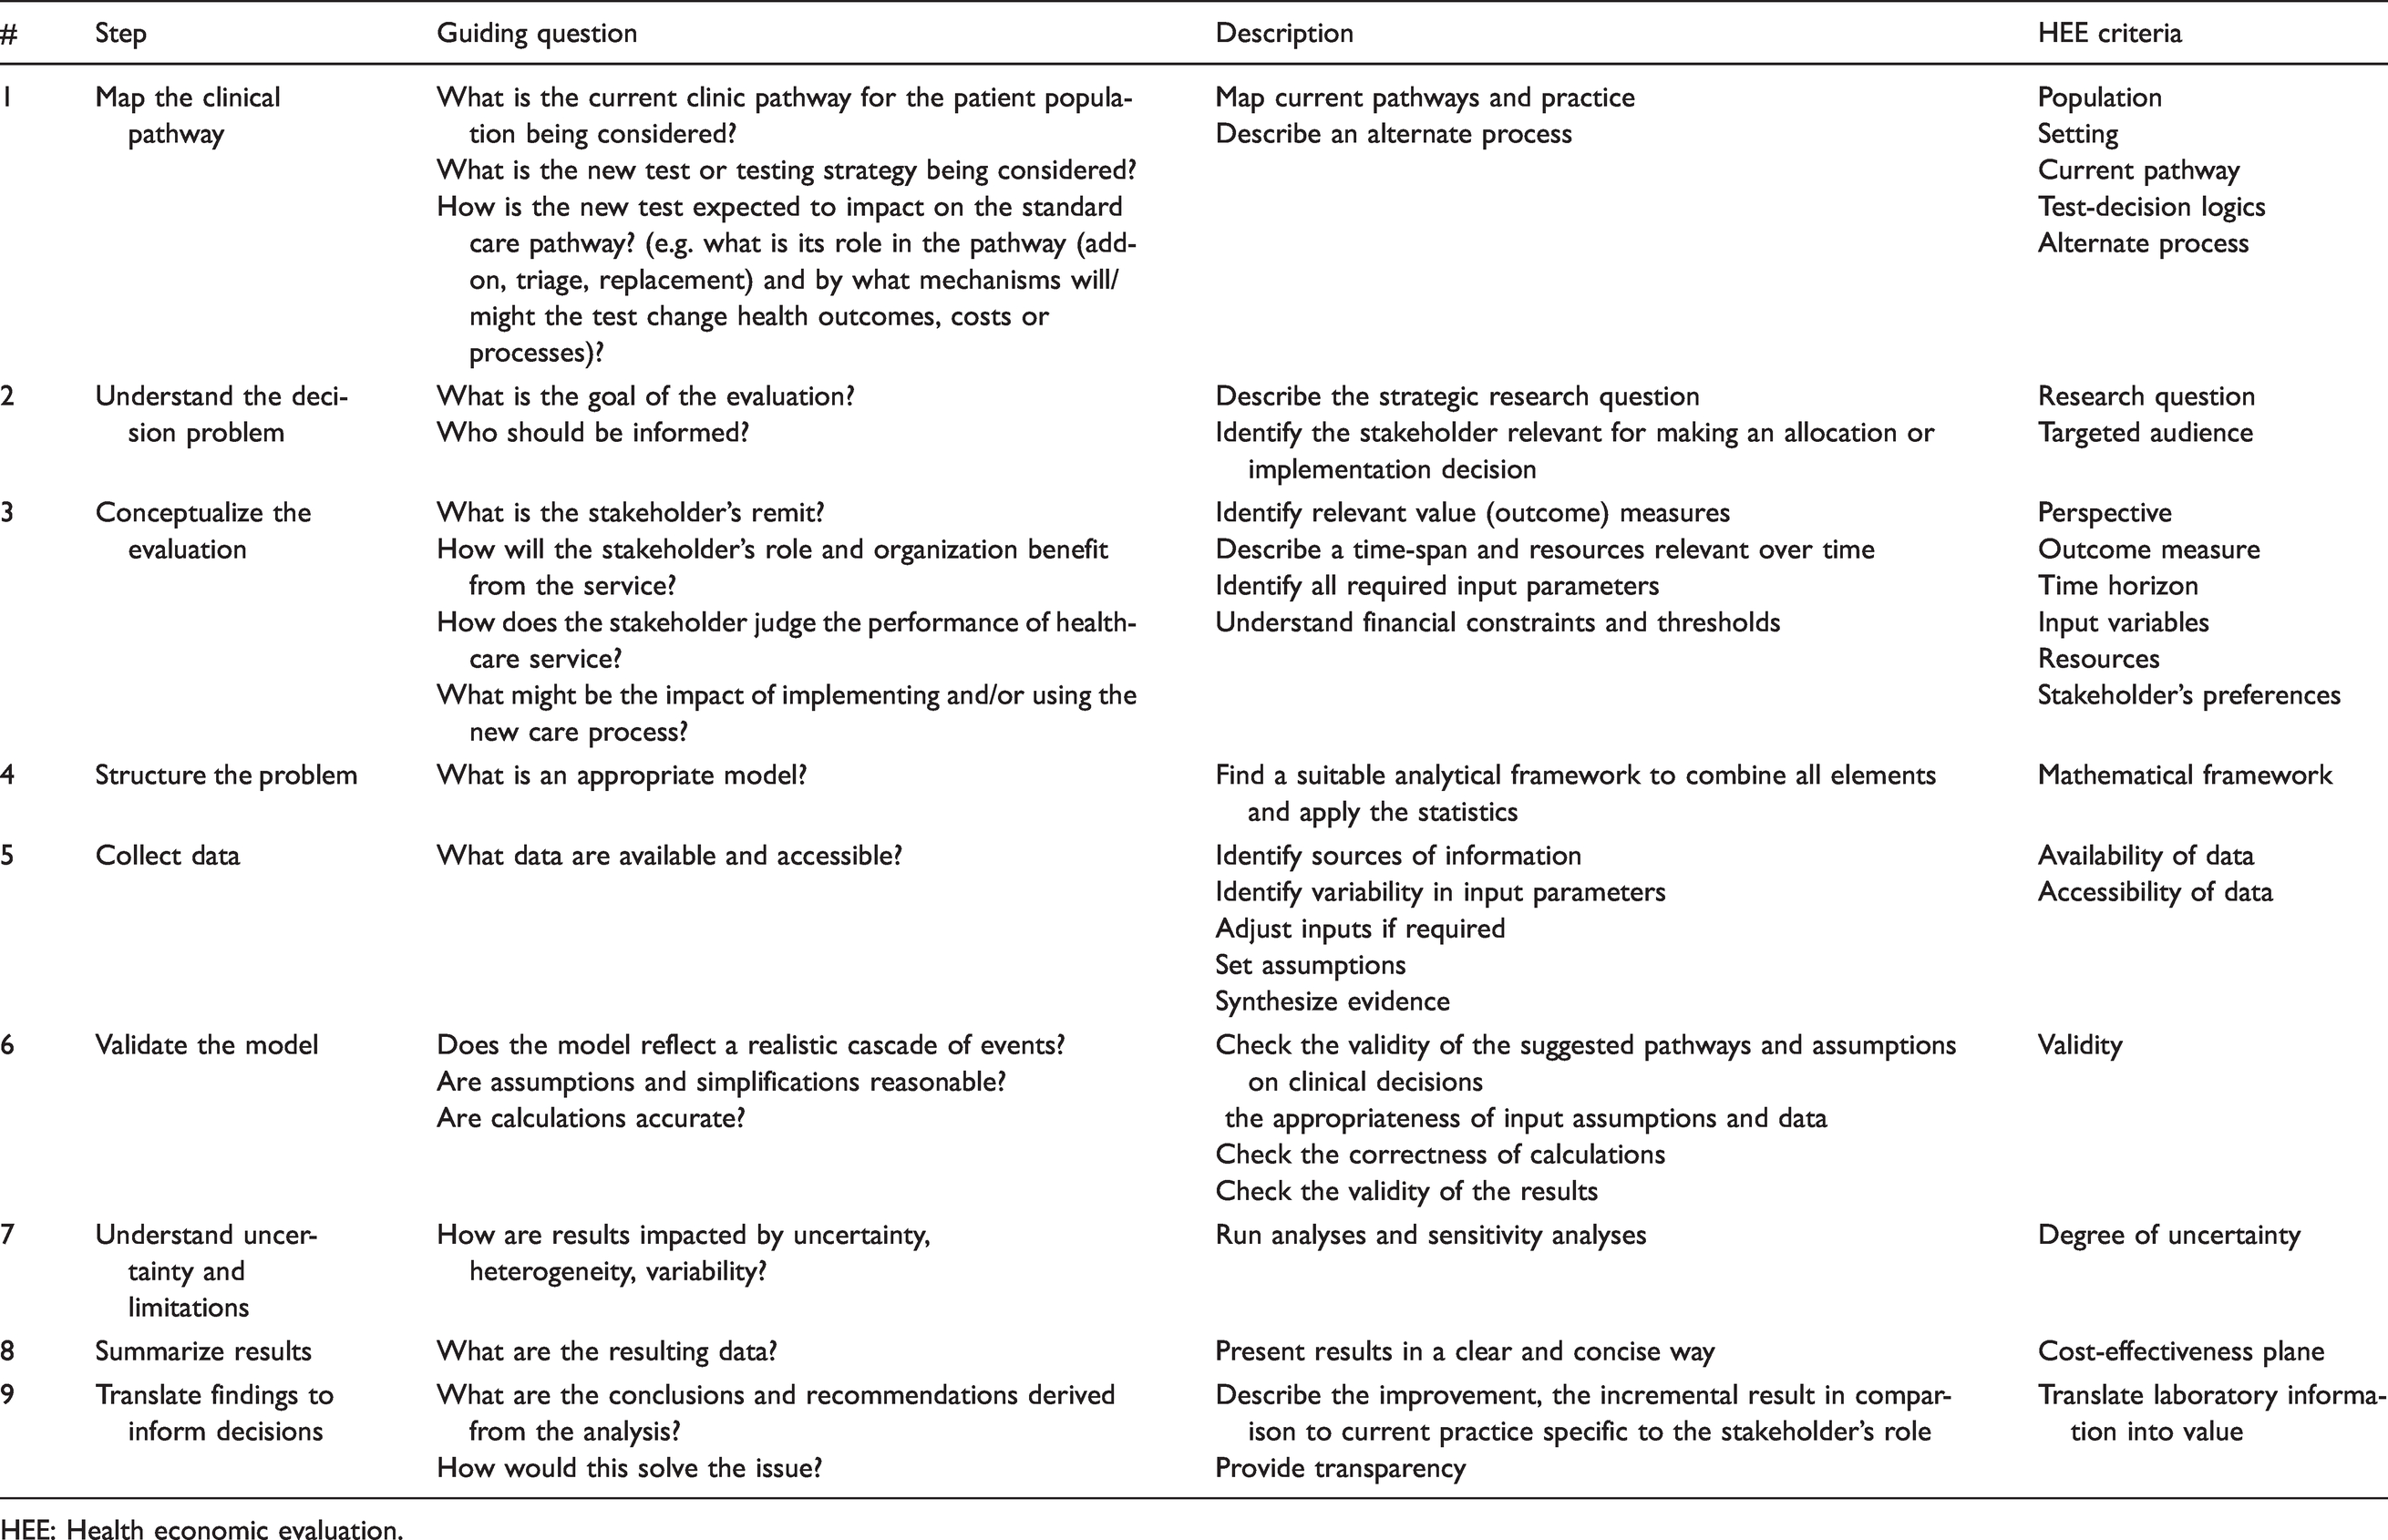
HEE: Health economic evaluation.
Box 1. Case example description
An audit revealed that a certain postsurgery complication occurred in 4.5% of hospitalized patients. Although below the national performance target of 5%, these complications are causing direct medical costs of 8500€ per case for more intensive care and extended stay. The complication can be diagnosed with a medical test A with a sensitivity of 65% and a specificity of 94%. Identified cases are managed with a medication at 840€ per case, which is effective in 95% of cases and not expected to lead to side-effects. A new medical test B has been suggested by the laboratory to replace test A and further improve the current situation. In addition to an expected better case detection, test B does not have an impact on processes but is estimated to increase lab costs by 25 to 45%. Test B has been evaluated in a diagnostic study in 480 patients and demonstrated a sensitivity and specificity of 85% and 90%, respectively. While considering a change in the pathway, the hospital also wishes to consider the option of not doing any testing and instead, prescribing medication to all patients after surgery, or an option of doing nothing. Hospital management prefers a cost-saving protocol.
Step 1: Map the clinical pathway
A specific medical test is often used in various clinical applications and purposes. 4 Therefore, describing the current clinical pathway that is being considered for the new test and pinpointing the specific patient population is the important first step. The impact of medical tests on downstream clinical outcomes is generally indirect and mediated through the way in which they inform a variety of management decisions including diagnosis, treatment selection and monitoring. It is therefore important to provide a clear understanding of both the purpose (diagnosis, monitoring, prognosis) and the role (add-on, triage, replacement) of the test within the pathway and its relationship to management decisions. 4 If it is a new test, it is necessary to consider how the clinical pathway will change and all the events that may occur differently to current practice.
For the case example, the current clinical pathway is illustrated in Figure 2. It comprises the period from surgery to discharge. The following alternate strategies are regarded as possible pathways or test strategies and are therefore included in the evaluation:
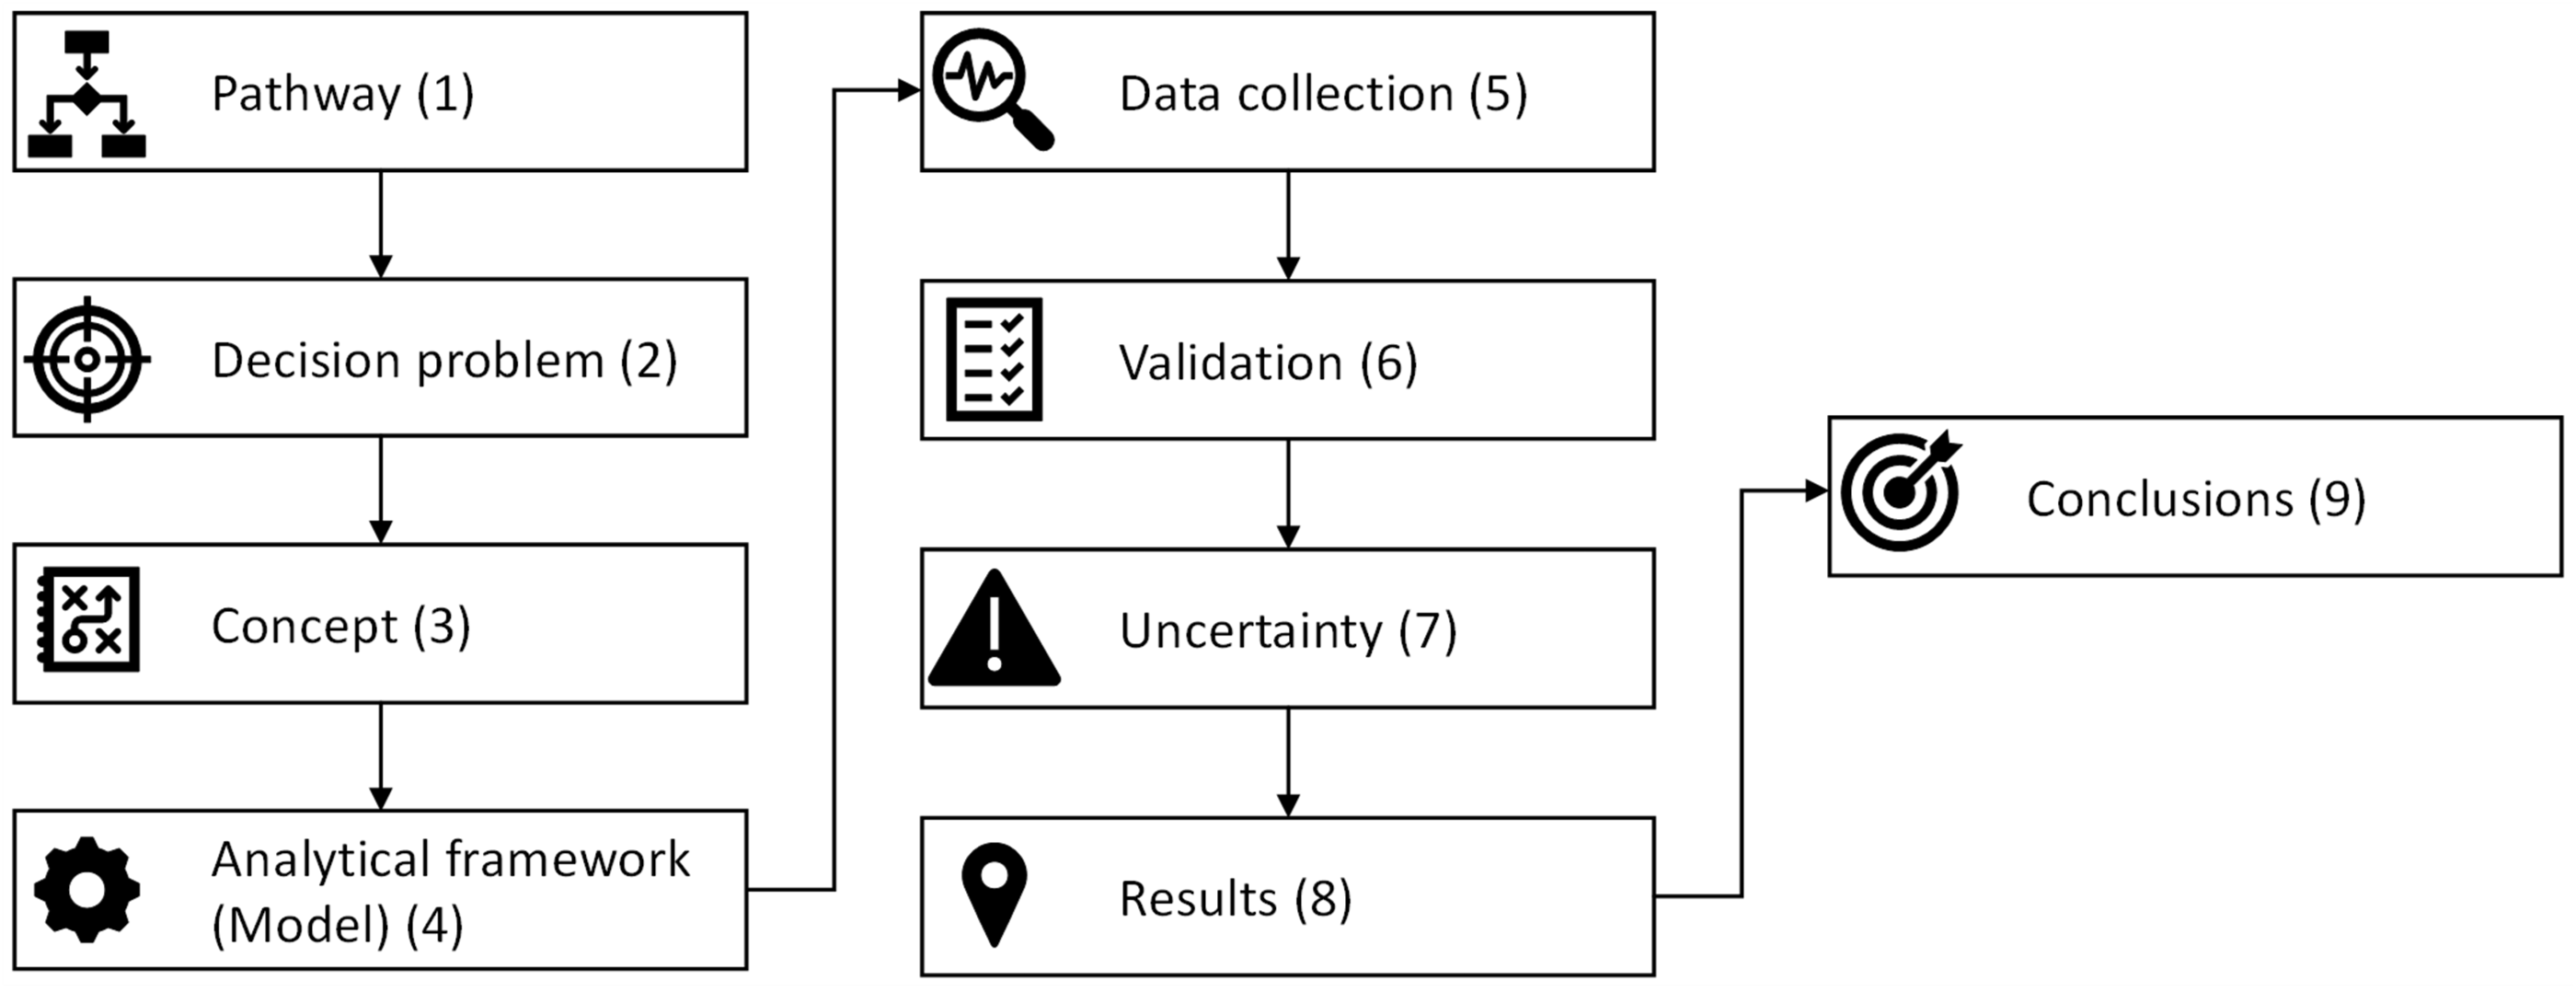
Modelling framework to translate laboratory information into value measures. Numbers refer to the steps in Table 1.
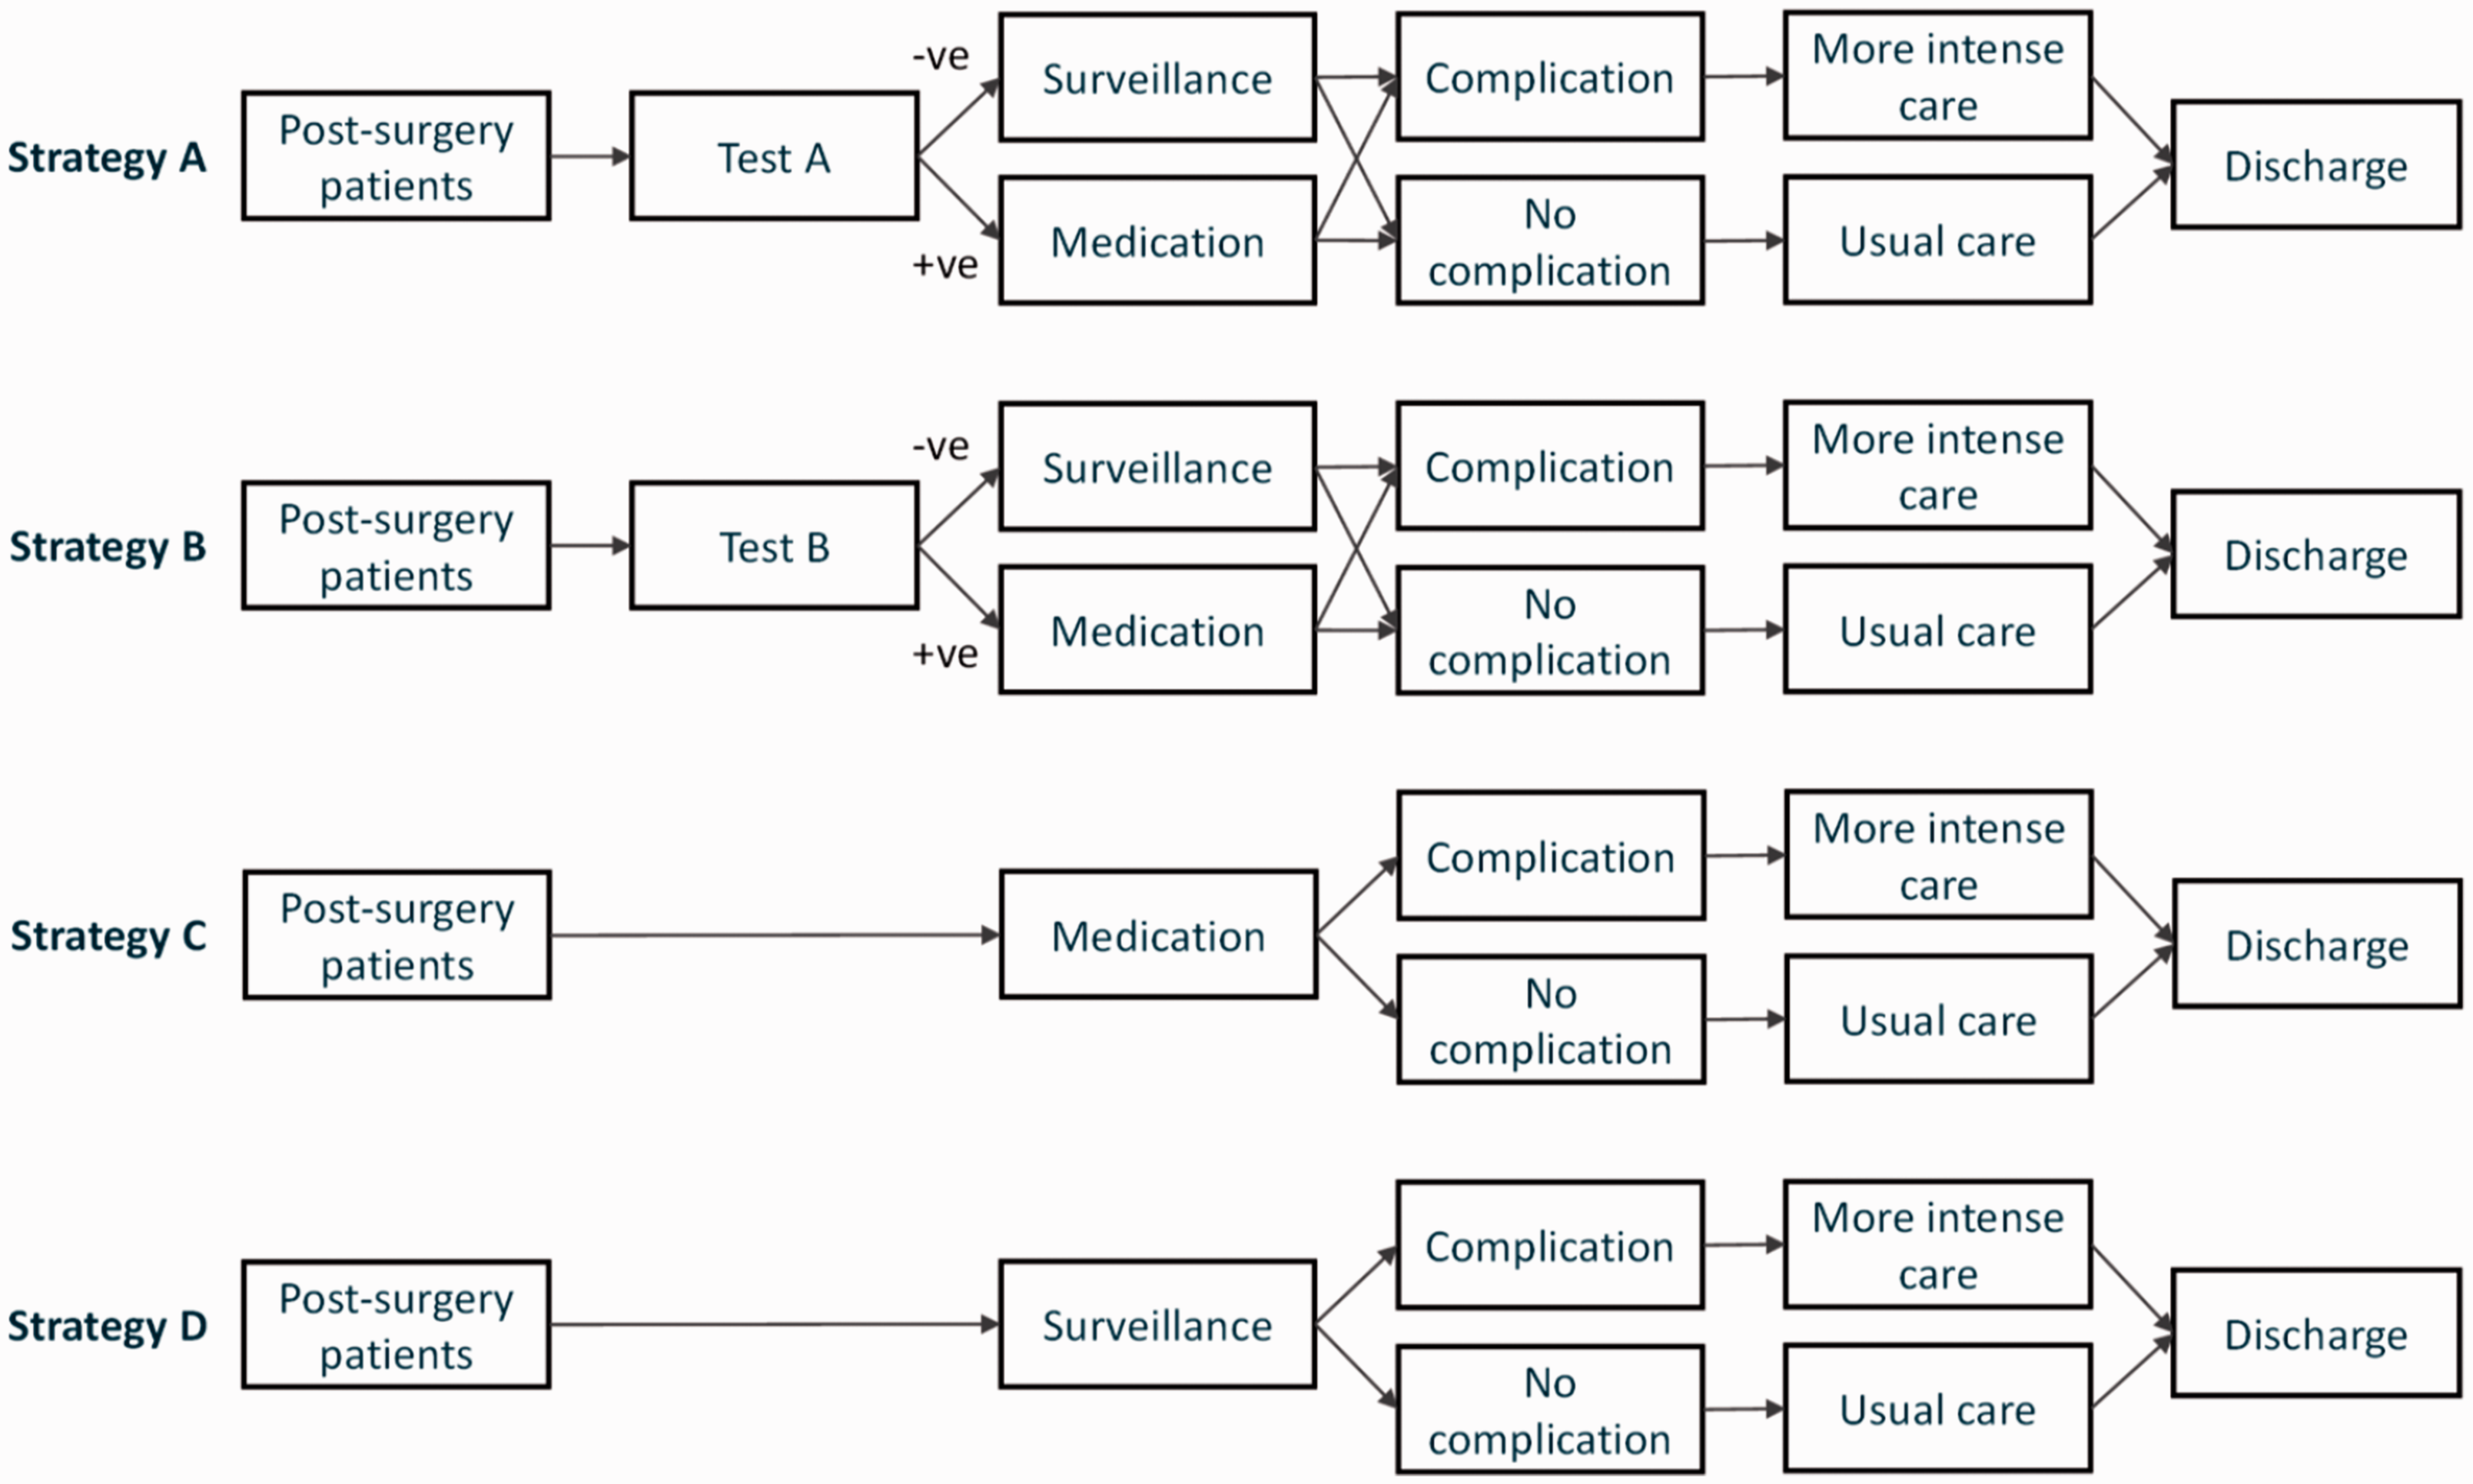
Illustration of the clinical pathways tested in the case study example. Current practice (Strategy A) refers to testing all postsurgery patients with Test A. Positive cases receive medication to prevent complications. Test A is replaced with Test B (Strategy B). All patients receive medication postsurgery with no prior testing (Strategy C). No testing and no medication for all postsurgery patients, ‘do-nothing’ (Strategy D).
Strategy A (Current practice): Test all patients postsurgery with test A. Positive cases receive medication to prevent complications.
Strategy B: Replace test A with test B in above pathway.
Strategy C: All patients receive medication postsurgery with no prior testing.
Strategy D: No testing and no medication for postsurgery patients.
Further information
Visualizing current practice and the cascade of care helps to understand a test’s role, clarifies potential actions and events, assists with identifying required resources and the factors which may impact on outcomes, and helps to identify different courses of action between strategies. This also means that different uses of a test for different pathways or populations have to be evaluated separately. In the current example, the pathway considers short-term outcomes only. A more comprehensive analysis including longer term outcomes (e.g. from inappropriate discharge) would likely require a more extensive pathway.
A map can describe the link between intermediate outcomes (‘true positives’ [TP], ‘false positives’ [FP], ‘true negatives’ [TN], ‘false negatives’ [FN]) through likely decisions to downstream consequences (Table S2). A distinction should be made between test result and diagnostic result, e.g. there may be cases where a ‘false negative’ test result would be identified by other means as being incorrect and converted into a ‘true positive’ diagnostic result. At a later stage, it is a useful basis for creating an appropriate mathematical model such as a decision tree model (see Step 4). It should be noted that early involvement of clinicians and other stakeholders (e.g. patients, carers) in the care pathway is critical for an appropriate and realistic description of all the potential pathways and decisions that may result from the different testing strategies. To fully understand all the possibilities or the boundaries of a particular decision, it may be useful to include ‘extreme’ options (e.g. ‘no-test–no treatment’, ‘no test-treat all’) in the comparison of strategies.
Step 2: Understand the decision problem
This step defines the funding allocation decision to be addressed, identifies the target audience, constructs a research question and hypothesis on a particular subject and sets the scope for the HEE.
In the current case example, the hospital management has expressed a cost-saving preference. Therefore, the decision problem is whether to invest in the implementation of new test B on the expectation that the reduced costs in patient care resulting from improved detection of complications will more than offset the extra cost of test B. In addition, hospital management is asking whether any testing is required. Therefore, the analysis is expected to consider all these options in the overall calculations.
Further information
Difficulties with investing or allocating resources are often due to the fact that a stakeholder lacks information on the decision-making process.11,13 Therefore, a clear understanding is required of the reasons that might prevent implementation of a medical test and is of paramount importance for defining the research question that appropriately addresses these issues. The targeted audience sets the scope for what needs to be included in the evaluation and what can be ignored.
Step 3a: Conceptualize the evaluation: Perspective, outcomes, time horizon
This step sets the scope, captures all the variables and components for the HEE and prepares for the translation of the decision problem into a mathematical framework. All elements should be defined carefully and stated clearly. This step should be accompanied by an in-depth analysis of the existing evidence associated with the use of tests A and B.
In the case example, the analysis is based on the viewpoint or perspective of hospital management. The time horizon is from surgery to discharge. Any later postdischarge event or consequences are not within the scope of the analysis, which is aiming for an evaluation of additional direct hospital costs compared to current practice. Additional information on the number of complications avoided is desirable.
Further information
The economic perspective is directly determined by the viewpoint of the target audience. The stakeholder’s perspective on value will vary according to their role and responsibility, their constraints, their underlying agenda and the decisions in which they are involved. Health economic decisions can range from being driven by a holistic societal view such as might occur in the global adoption of a test to very specific funding decisions more typical of local test implementation. All decisions can vary depending on the health-care structure, organizations and regions. While each of the various perspectives may require a different definition of value, the basic framework of the analysis is generally comparable given the fact that everything should be centred around a specific clinical pathway.
Stakeholders will choose outcome measures which reflect their perspective of value in the health-care service, and it forms the denominator of the cost-per-value-assessment required in funding decisions. Some questions are helpful for identifying stakeholder’s expectations and relevant outcome measures that are consistent with the study perspective (Table 1). 19
Ideally, outcomes refer to consequences relevant to patients but can comprise any change in clinical, organizational or performance indicators, number of events (e.g. detected cases), or aggregated quality-of-life measures such as the quality-adjusted life-years (QALYs). Implementation decisions in hospitals are affected by a variety of aspects ranging from political or strategic aspects, through clinical measures, to organizational indicators with a much narrower economic perspective. 8
The expression of value must be a measurable quantity. Following the clinical pathway from laboratory testing, intermediate outcomes should firstly be linked to clinical decision-making, which subsequently impact downstream consequences, or extrapolate to longer term outcomes (Table S2).
The (analytical or economic) time horizon is the period that comprises all effects and benefits relevant for the decision problem. This is highly dependent on the indication, setting and perspective, but must be long enough to capture all relevant differences in outcomes. 20 Setting the time horizon may be straight forward in HEEs that are following a hospital perspective where care pathways frequently take place within relatively clear and short episodes. Complexity emerges when effects and costs are extrapolated from management decisions and beyond available data to long-term consequences, e.g. in primary prevention studies. In some cases, consequences that may occur outside the period overseen by the intended audience (e.g. long-term mortality as a result from an inappropriate discharge after ‘FN’ from a hospital’s viewpoint) may not be considered relevant to the decision. It is important to note that overlooking critical consequences by following a narrower perspective means that the HEE would not evaluate the full value of a new strategy to the health-care system or the society.
Step 3b: Conceptualize the evaluation: Identify input variables
Specific characteristics and conditions of a pathway such as the population, setting, test performances and decisions are all usually described by variables. To enable meaningful comparisons, it is important to consider what variables affect the desired outcomes and differences of such between strategies. In HEE for medical tests, variables around test performance, patient characteristics, test-treatment decisions, treatment availability, accessibility and treatment effects are usually of relevance.
Further information
Model inputs refer to all variables used in a model in order to describe a certain scenario, a course of action and its associated means and outcomes. This includes, e.g. patient characteristics, management, treatment efficacy, outcomes and resources. In general, model inputs should be reduced to a minimum number of critical variables likely to have an impact on the decision. For example, given the focus on incremental changes rather than on the absolute numbers, costs that are not impacted by a new test or its related management modifications can be excluded (e.g. initial surgery costs in our case history).
Step 3c: Conceptualize the evaluation: Resources required
Health-care activities and events consume medical or non-medical resources, and different pathways and management options will require different resource patterns. It is recommended first to identify all elements associated with activities and events (e.g. as illustrated by the process map). Second, the amount of each of these elements are assigned, measured or counted in natural units (e.g. number of tests, number of admissions, time in hospital, etc.). Unit costs of each element are then estimated and ascribed against the resources used.
In the case example, required resources are the average costs derived from the audit. A more detailed analysis of resources is not required. In this straight forward test-treatment decision and pathway, it is assumed that besides prevalence, critical input variables are only related to test performances and costs.
Further information
For collecting the correct cost information, it is important to keep the chosen economic perspective in mind. Reimbursement, charges or costs can be very different but may all be an adequate expression of the unit costs depending on the chosen perspective. Unit costs can be of a different nature such as one-off costs, time-dependent costs, per person, per event. Depending on the economic perspective, most HEEs consider only direct medical costs that are related to a condition or pathway. Besides that, some disease states may have additional economic effects such as direct non-medical costs (e.g. patient’s travel costs) or indirect non-medical costs (e.g. loss of productivity). Indirect costs (and related benefits) are usually only considered if the analysis follows a perspective of the society or the patient. In these cases, the involvement of a specialist (e.g. a health economist) is recommended.
Step 3d: Conceptualize the evaluation: Stakeholder’s preferences and specifications
The implementation and application of new strategies into practice frequently require some investment. Due to a scarcity of resources, investment in one area almost always requires disinvestment in another area. Any choice for a new service might therefore withdraw resources from another service and the associated potential benefits. To translate findings from HEEs into reasonable probabilities for decisions, it is important to understand stakeholder’s preferences and how they value a gain in benefit.
In the case example, the targeted stakeholder (hospital management) prefers a cost-saving alternative.
Further information
In HEE, the strength of a stakeholder’s preference is commonly reflected by a maximum WTP for an improvement in outcome. Given the fact that decisions are always prone to some uncertainty, the WTP threshold is inherently influenced by stakeholder’s risk attitudes.21,22 In general, a value of zero indicates that the stakeholder only wants to save costs. Thresholds for WTP are not fixed and depend on several environmental, cultural, clinical and personal factors.23–24 In some cases, a valuation of outcome may not be possible or required. A change or improvement in hospital performance indicators (e.g. 4-h target for emergency department visits) may be important enough to guide decisions in cases of acceptable expenses. It is therefore recommended to evaluate preferences, targets for key performance indicators, or other thresholds relevant to the perspective of the HEE.
Step 4: Structure the problem
A model is a simplified representation of a system. Defining an appropriate model design requires a prior understanding of the previously mentioned elements but is mainly informed by the type of stakeholder, the time horizon required to capture all the relevant costs and benefits and the nature of events considered in the analysis. In addition, the availability of data can considerably influence what type is possible. It is often useful to look at the literature to see what other models have been used to address similar research questions.
In the case example, the time horizon is short and comprises the period from surgery to discharge. Considering a potential disease progression over time is therefore not required. In addition, implications of the different strategies on the course of action and outcomes are available to an appropriate level (e.g. replacing test A does not change the process, FN test results lead to more intensive care for managing the complication, FP test results increase costs for unnecessary medication). The efficacy of medication for controlling a complication is reported to be 95%. The targeted stakeholder is mainly interested in a comparison of hospital costs of the different strategies. Given the focus on short-term consequences, a simple decision tree model appears to be suitable for evaluating the strategies (Figure 3).
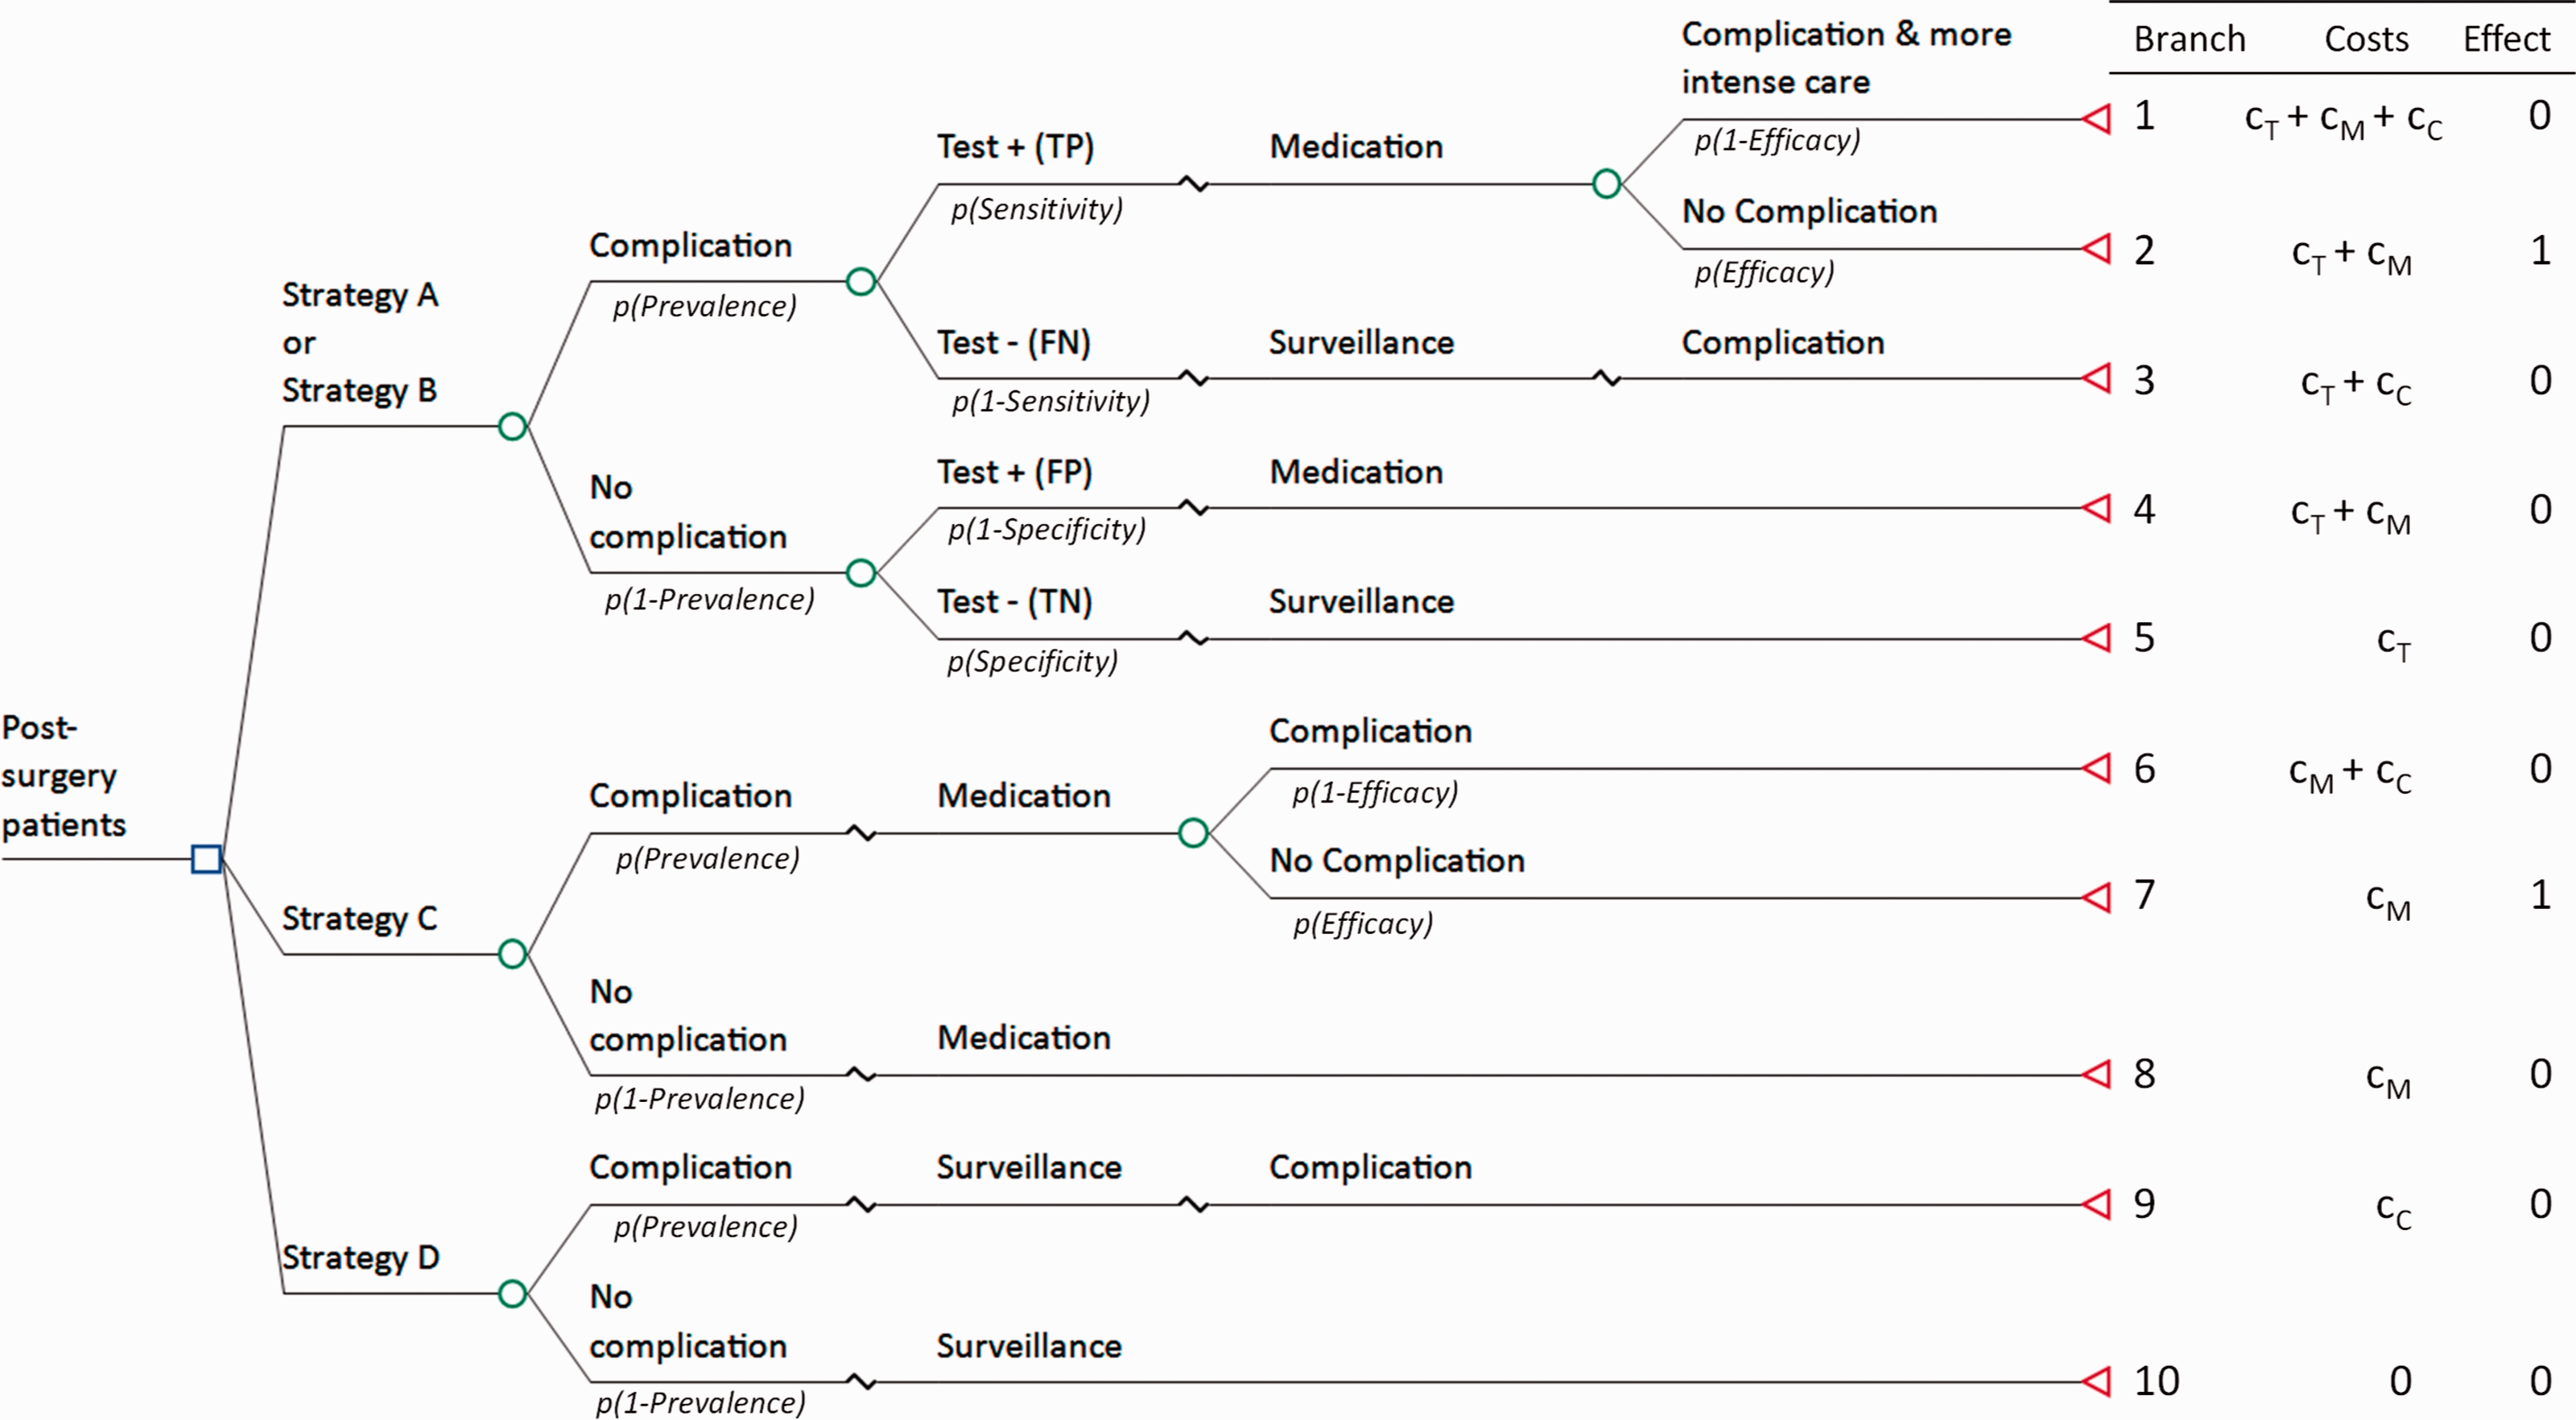
Decision tree model of the case example. The decision node (square) refers to the different choices to be evaluated. Chance nodes (circles) indicate the probabilities p of two possible events. The terminal or value nodes (triangles) reflect the endpoint of each branch.
Further information
A decision tree can usually be converted intuitively from the basic pathway map and provides a high level of transparency on the design of a model. Basic nodes in a decision tree are based on either a decision (e.g. Strategy A, B, C, or D in Figure 3) or chances (e.g. a positive or negative test result, complication/no complication). Chances represent any type of event or alternatives, and their occurrence is mathematically estimated by probabilities assigned to branches. Since the events are mutually exclusive, probabilities at a given node must sum to 1. In this example, the Strategy A and B have five different paths, and a patient must follow one of the paths in each strategy. Each arm terminates with the chosen outcome measures per path (e.g. total costs, utilities, effectiveness). Here, the effect is measured in whether or not a complication is avoided. Following the model visualizes all inputs to the respective outputs and helps to create a list of required input variables. Costs are associated to each activity and event where resources are consumed and summed up at the end of each pathway. In the example, costs may accrue from testing, medication and complication. While costs and outcome of each of the pathways may well be different, a decision maker is interested in the mean effect or value of the strategy considering all possible pathways. The expected mean costs and effect for each strategy action are calculated by rolling back the tree from right to left that gives the sum of products of the probabilities and their outcomes. While specific modelling software is available, decision trees can be built in standard software packages (e.g. Excel) with only moderate effort. A simple calculation matrix for the case example is given in Table S6. Some decision analytic models provide a more complex type of mathematical framework that represent a flow of actions, events and consequences from diagnosis through management and treatment to the respective outcome of interest. Using more advanced models, simulating complex pathways and scenarios, extrapolating over time, high levels of uncertainty, variation or heterogeneity and other aspects strongly require the involvement of specialists such as an experienced health economist. More details are provided in the Supplement Text S1.
Step 5: Collect data/data elicitation
Since input variables in HEE are mostly informed by a number of different sources, the collection of required information often requires a substantial portion of the total project time. Data usually fall into several categories: patient data, management & treatment data, resource data, cost data and sometimes quality of life or utility data. Generally, relevant information comes from published studies, medical literature, electronic internal or public databases or experts. Information and data used in HEE should be derived from the best available evidence (e.g. systematic review). In some cases, HEEs are based on a specific observational or experimental study, or internal audits. In cases where relevant data are not accessible or available, reasonable assumptions must be made and justified as much as possible.
In the case example, required model inputs are derived from the audit (prevalence), internal observations (test A performance), databases (costs for medication, complication and testing) and literature (test B performance, drug efficacy). Testing costs for test B are based on internal estimates (Table 2).
Input assumptions of the case study considered.
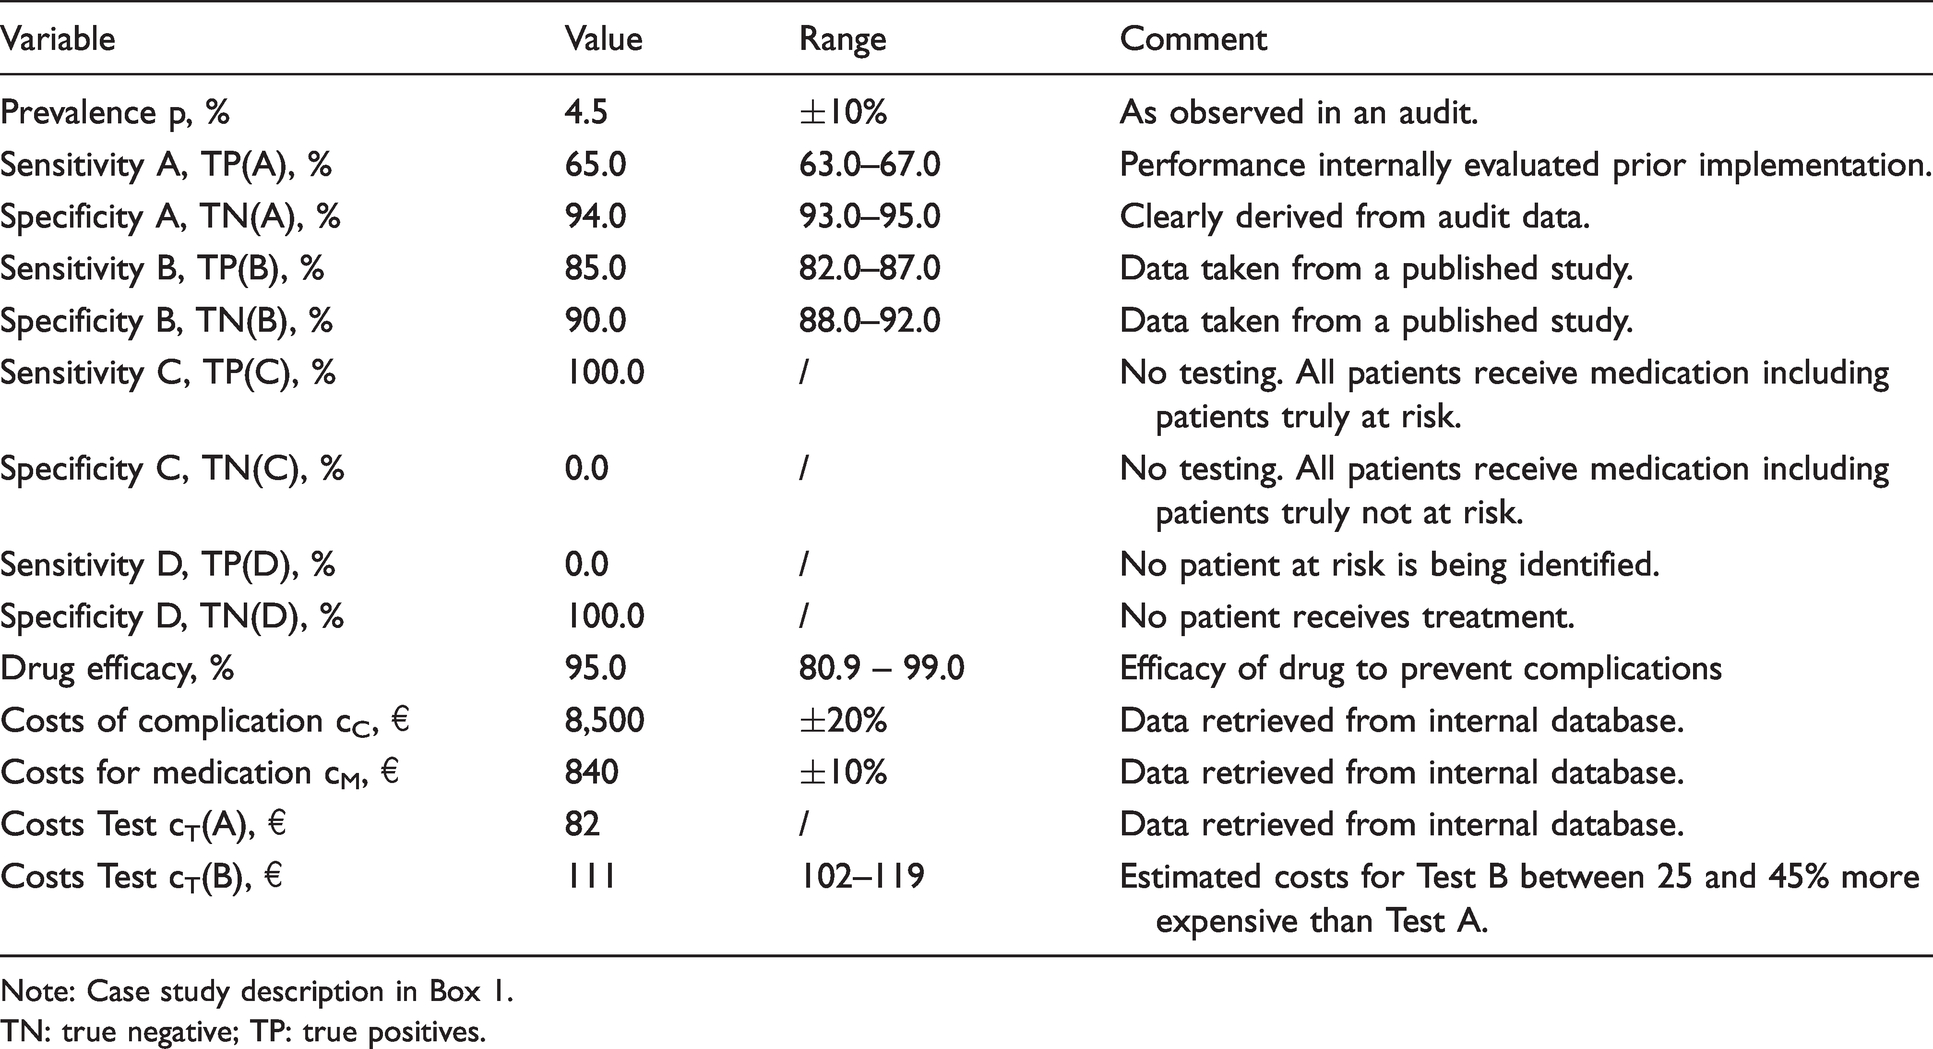
Note: Case study description in Box 1.
TN: true negative; TP: true positives.
Further information
Collecting data frequently requires some collaboration to get access. Some data, particularly cost information taken from external studies, may not be adequate to reflect the decision problem and may often need to be adjusted. 25 In most cases, point estimates are used for input variables but with accompanying ranges indicating variation (e.g. confidence intervals, or upper and lower bounds), they can substantially increase the robustness and reliability of the expected results.18,25
Step 6: Validate the model
Validity refers to the accuracy of a model to predict the outcome measures of interest, and validation involves a set of processes to judge a model’s accuracy in making relevant predictions.
26
In the context of laboratory testing, the following validation steps are particularly important: Check the validity of the suggested pathways and assumptions on clinical decisions. Check the appropriateness of input assumptions and data. Check the correctness of calculations (Technical validity). Check the validity of the results (Predictive validity).
In this case example, test A is assumed to be routinely requested after surgery with clear directions on treatment. The clinical pathway is discussed and checked with clinical staff. Audit and cost data are confirmed with the hospital’s finance department. Model calculations are checked by an independent person (e.g. a colleague).
Step 7: Understand uncertainty and limitations
Combining data from multiple sources with partially imperfect information in a mathematical framework leads to an inherent degree of uncertainty that can be of various types. 18 In the context of laboratory testing, the following sources of uncertainty deserve attention: test measurement uncertainty, variability in patient characteristics (heterogeneity), uncertainty and variation in test performance (e.g. sensitivity, specificity) and clinical practice pattern variation.1,27–29 The robustness and boundaries of the model’s results should be systematically assessed using sensitivity or scenario analyses. 20 After identifying key areas of uncertainty, confidence intervals are added for all critical input parameters (Table 2). Sensitivity analyses are run by systematically varying one or more input parameters at a time over these predefined ranges. The effects of a certain set of assumptions can be presented as a scenario analysis.
In the case example, the specificity of test A has been observed to vary little. There is some uncertainty in the sensitivity, which has been evaluated in a study prior to implementation. Test B’s performance, taken from a single published study, may be different when applied routinely in this specific setting. The prevalence of complications may vary over time and depends, for example, on population characteristics. The efficacy of medication in treating the complication of surgery can vary between patients. Current costs for testing and medication can be regarded as relatively robust and validated from internal audit. Costs for test B are estimates and deserve special attention. Ranges to each of the variables are defined to reflect the level of knowledge, variability or uncertainty (Table 2). Likewise, attention is paid to the performance of test B, and the complication costs and both are tested in sensitivity analyses. In addition, the impact of uncertainty in costs for test B is tested by running two scenarios.
Further information
The boundaries of the model may be indicated by testing for thresholds that still do not change the preferred strategy or using extreme but unlikely input values. Such threshold analyses may also be used to assess test specifications or costs required for reaching specific goals. Various types of sensitivity analysis can be used repeatedly to assess the model under varying conditions by randomly and simultaneously retrieving parameter values from appropriate distributions. 18 As a result, point estimates can be replaced by a more statistical expression of model outputs. Since reports indicate that the use of medical tests can deviate substantially from recommended guidelines, and that test ordering can be influenced by several non-medical factors,30–31 assumptions about clinical decisions particularly for a new test should be scrutinized carefully.
Step 8: Summarize results
As modelling is a methodology of dealing with the uncertainty of decisions, when interpreting and communicating model results, transparency is critical to the integrity and acceptance of derived information. Therefore, model outputs have to be presented and interpreted in a clear and concise way by considering the level of knowledge of the target audience. 13
In the case example and according to the stakeholder’s preference, strategies are first presented with increasing costs starting from the current practice – Strategy A (Table 3). Strategy B of implementing test B predicts an impact on cost ranging from a reduction of 13€ to an increase of 4€ per patient undergoing surgery. In contrast, Strategy C of not performing any tests and treating all patients with medication would cost 558€ more per patient, and a no-test-no-treat strategy (D) leads to 82€ higher costs than current practice. Additional sensitivity analyses showed that Strategy B would be the best choice for complication costs above 8000€. Under the basic conditions, specificity for test B should not be below 88.6%.
Estimated costs per strategy in the case example.
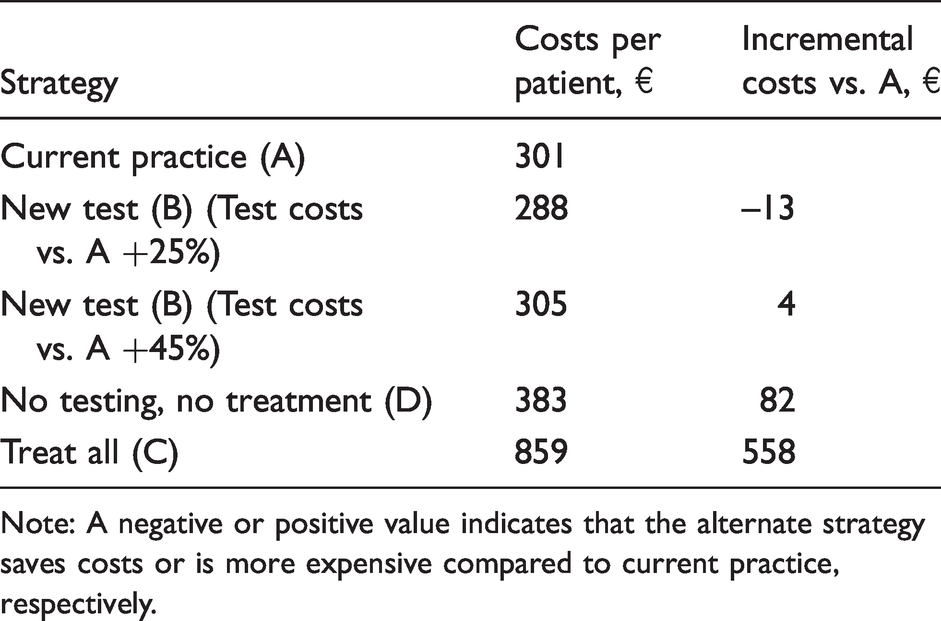
Note: A negative or positive value indicates that the alternate strategy saves costs or is more expensive compared to current practice, respectively.
While the observed complication rate in the audit is below the national target, it might be interesting to test the impact of different strategies on the complications avoided. By considering prevalence and sensitivity for each strategy, the number of complications avoided can easily be calculated with 28, 36, 43 and 0 per 1000 surgeries for Strategies A to D, respectively (Table 4). Results in terms of incremental costs and incremental number of complications avoided are presented in a cost-effectiveness table (Table 4). Incremental values always refer to the next best alternative, rather than with a common strategy (e.g. current practice).
Cost-effectiveness table of strategies in the case example.
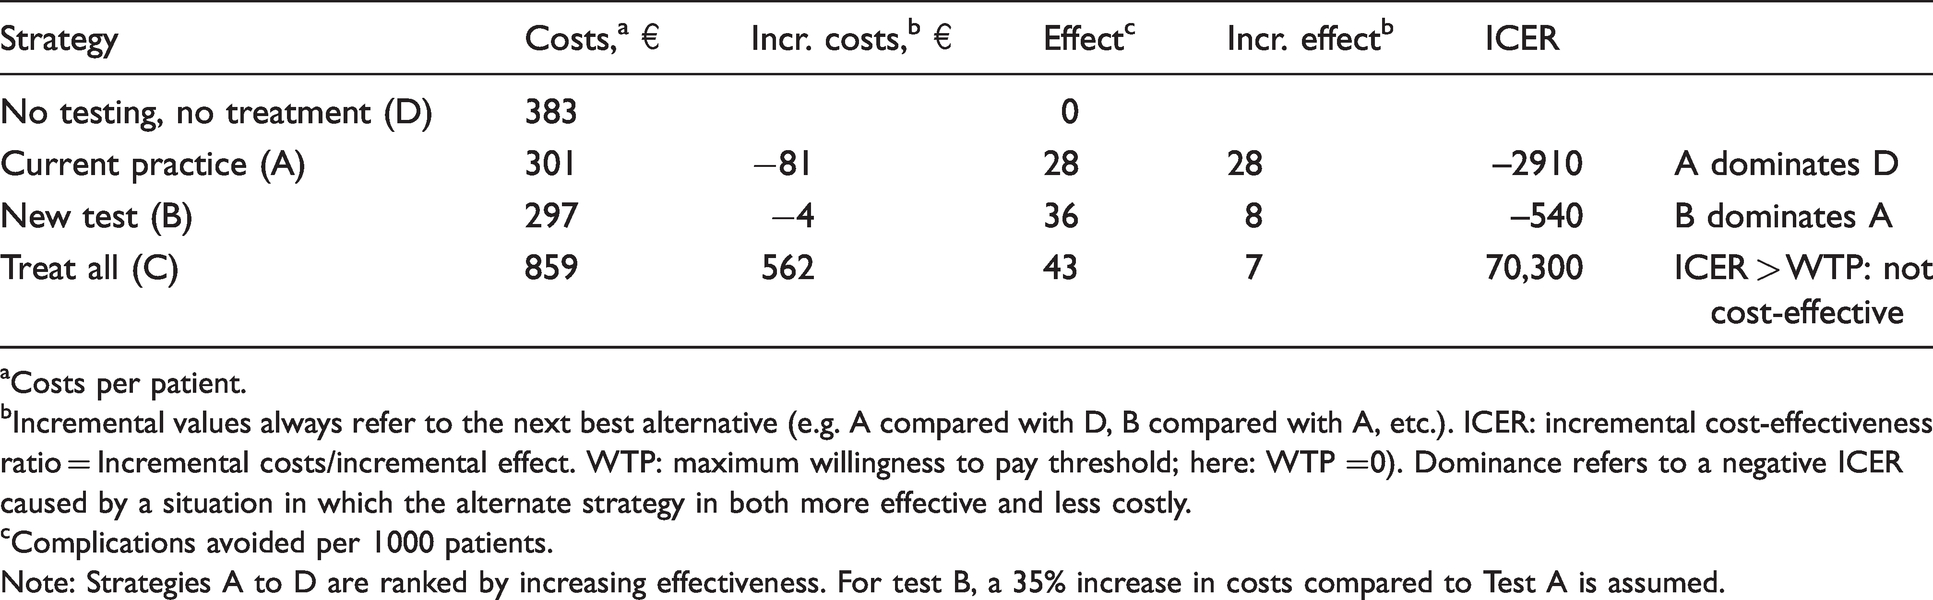
aCosts per patient.
bIncremental values always refer to the next best alternative (e.g. A compared with D, B compared with A, etc.). ICER: incremental cost-effectiveness ratio = Incremental costs/incremental effect. WTP: maximum willingness to pay threshold; here: WTP =0). Dominance refers to a negative ICER caused by a situation in which the alternate strategy in both more effective and less costly.
cComplications avoided per 1000 patients.
Note: Strategies A to D are ranked by increasing effectiveness. For test B, a 35% increase in costs compared to Test A is assumed.
In this example, strategy B dominates (i.e. provides better outcomes at lower costs compared with both current practice (A) and strategy D) and would therefore be the preferred choice. Strategy C is the most effective and most expensive strategy. Compared with the next best alternative, strategy B, it would cost an extra of 70,300€ per additionally avoided complication (as expressed by the ICER). Only if the hospital manager is willing to invest significantly (so the maximum willingness-to-pay to avoid a complication would be greater than 70,300€), Strategy C would be regarded cost-effective. In case the hospital is clearly looking for cost-saving alternatives (WTP = 0), Strategy C would not be considered cost-effective.
Further information
The estimated costs do not necessarily reflect the actual costs consumed per patient. In order to simplify the model, resources deemed unchanged between strategies are frequently ignored. Thus, conclusions must be taken from the incremental costs that are reflecting the savings or additional expenditures that would directly result from a change in strategy. More information on the classification of cost-effectiveness results are provided in Table S4.
Step 9: Translate findings into messages to inform decisions
Besides expressing the consequences of a medical test on diagnosis, management and clinical outcomes, the central message should clearly state the benefits from a stakeholder’s view if they accept the change.
To conclude the case example, implementing test B would be more effective in terms of complications avoided and would save costs per patient undergoing surgery. It would also maintain the performance metric close to the national performance goal. Not performing laboratory testing would substantially increase hospital costs compared with current practice through increasing costs for preventive medication or for treatment of complications.
A summary of the relevant information for each of the nine steps in the modelling process for this case history is given summarized in Table S5.
Discussion
We have described the various steps in a relatively simple economic model that shows the value to a specific stakeholder of introducing a new test. The framework follows a structured approach from a clear clinical pathway for a specific population, defining reasonable assumptions and relevant outcome measures, through setting a justifiable analytical structure that is as simple as possible to deal with the uncertainty of translating results into value measures. The example we have used to demonstrate the economic model here combines data from several sources such as literature evidence on diagnostic test performance in the context of a clinical care pathway and real-world data from an audit and evaluates the impact of different testing strategies on a chosen measure of value. The idea of a model to link testing action, events and outcomes, on the basis of the best available information, 14 makes it particularly useful in laboratory testing to overcome several challenges and issues. Some of these challenges specific to laboratory testing are listed in Table S7 together with how HEE models can address and overcome them. While the model we used is relatively simple, it is important to realize that many of the steps in modelling require intensive and cross-functional collaboration with experts in order to obtain the requisite data and to ensure the modelling assumptions are valid. Besides clinicians, service line managers, finance or public health experts, this may require collaboration with other key professionals such as information specialists (for data searching), systematic reviewers (for reviewing and evidence syntheses), health economists or statisticians (for statistical and HE modelling) or other researchers.
Several concepts for determining the value of a test have been developed, primarily for use in the development phase and for assessing a test’s clinical utility.3,4,32,33 Many of these highlight the need for HEE to explore the consequences of testing or to understand the uncertainty related to testing. Furthermore, HEE tools can assess such uncertainty in several phases of a test’s lifecycle, e.g. to explore the clinical need in the development phase, to evaluate utility and cost-effectiveness prior to introduction into the market and reimbursement and to estimate the economic impact in the adoption and implementation phases.11,13 Despite their usefulness, the number of HEEs for laboratory testing is moderate, incomplete and rarely addresses all the stakeholder’s perspectives throughout all phases.34–38 Most HEEs for medical tests follow a governmental or third-party payer perspective, given they are often the adopters, but issues concerning implementation may require a more local approach as we demonstrated in the Case Example. 11 This sometimes requires information beyond those captured in most clinical studies and may include organizational effects or budget impact from a provider’s perspective. In fact, studies suggest that implementation of new laboratory services on a hospital level is hindered when general clinical evidence is available, but an assessment of the local organizational and financial consequences of implementation is missing. 6 Although local budget impact calculations do not necessarily have to be published, it is noticeable that only a few conceptual papers and HEEs focus explicitly on the perspective of the hospital.39,40 In addition, the involvement of laboratory professionals in HEE of laboratory tests is low, which implies that laboratory expertise is frequently not considered in decision processes which further contributes to the lack of awareness of, and expertise for HEE, among laboratory professionals. 38 Therefore, more generation and dissemination of health economic information on laboratory testing help to fill several gaps. First, it should increase the awareness of where the benefits of testing can be found. Second, the fact that clinical pathways and adherence to them are critical to achieving the full value of a test means that HEE should help to overcome issues with inconsistently implemented pathways against evidence-based medicine. Third, HEE can contribute to the education about the appropriate use and effect of laboratory tests. Lastly, HEE can improve the focus of the laboratory community on downstream effects of testing and improve cross-functional collaboration.
Without doubt, the true value of health-care services is determined by its ability to meeting the needs of patients. 41 In the context of this paper, however, partly isolated decision-making processes in current organizational structures as well as the complexity of implementing new services should be acknowledged.
Rather than providing a comprehensive overview on health economic modelling, this article is intended to encourage experts in the field of laboratory medicine to embark on translating laboratory information into different value measures by using established modelling techniques. While models are simplified representations of reality with the purpose to inform funding decisions, they can contain high levels of complexity, which is beyond the scope of this article. Readers wishing to have a more comprehensive view on health economic modelling are referred to textbooks, guidelines and best-practices.18–20,25,42 The involvement of specialists is strongly required for all HEEs that extrapolate over time or go beyond immediate clinical decisions, that deal with a higher level of uncertainty or heterogeneity, that follow a broader perspective, that require more extensive data collection or data adjustment or that assess more complex pathways and settings. Multidisciplinary collaboration is essential to understand the complexity of clinical pathways and to accurately evaluate the value of laboratory tests to stakeholders in health-care systems. We encourage laboratory professionals to initiate or lead HEEs for laboratory tests and support multidisciplinary experts, as their involvement ensures that laboratory expertise is considered in decision processes.
Conclusions
Health economic modelling is an established and widely used tool to inform decision processes in health care. Based on existing guidelines and recommendations, we have summarized key principles relevant for translating laboratory information into different value domains. While value is defined by the context, results from health economic evaluations rely on an in-depth analysis and fundamental understanding of the clinical pathway, its stakeholders and governance. Health economic modelling quantifies the consequences of testing, and thereby addresses various issues and frequent gaps in the assessment, adoption and implementation of new medical tests.
Supplemental Material
sj-pdf-1-acb-10.1177_00045632211013852 - Supplemental material for Health economic evaluations of medical tests: Translating laboratory information into value – A case study example
Supplemental material, sj-pdf-1-acb-10.1177_00045632211013852 for Health economic evaluations of medical tests: Translating laboratory information into value – A case study example by Paul Jülicher, Maurice O’Kane, Christopher P Price, Robert Christenson and Andrew St John in Annals of Clinical Biochemistry
Footnotes
Acknowledgements
This work was performed as part of the activities of the IFCC (International Federation of Clinical Chemistry and Laboratory Medicine) -WASPaLM (World Association of Societies of Pathology and Laboratory Medicine) Committee for the Value Proposition in Laboratory Medicine.
Declaration of conflicting interests
PJ is an employee of Abbott Diagnostics. RHC is a member of scientific advisory boards or consults with the following commercial entities: Siemens Healthineers, Roche Diagnostics, PixCell Medical, Quidel Medical, Sphingotech GBH, Beckman Coulter and Becton Dickinson. All other authors have no competing interests to declare.
Funding
This research (CPP) was supported by the National Institute for Health Research Community Healthcare MedTech and In Vitro Diagnostics Cooperative at Oxford Health NHS Foundation Trust.
Ethical approval
Not applicable.
Guarantor
PJ.
Contributorship
PJ researched literature, evaluated the case example, and drafted the article. All authors reviewed and edited the article and approved the final version of the article.
Supplemental material
Supplemental material for this article is available online. Supplemental file includes Table S1: Frequent methods of comparative health economic evaluations. Table S2: Key terms used in health economic evaluations. Table S3: Examples of direct, short-term, and long-term outcome measures. Table S4: Classification of cost-effectiveness results. Table S5: Summary of modelling steps as they apply to case history. Table S6: Calculation matrix for the decision tree model of the case history. Table S7: Advantages of using modelling in health economic evaluations of medical tests. Text S1: Decision analytic models.
References
Supplementary Material
Please find the following supplemental material available below.
For Open Access articles published under a Creative Commons License, all supplemental material carries the same license as the article it is associated with.
For non-Open Access articles published, all supplemental material carries a non-exclusive license, and permission requests for re-use of supplemental material or any part of supplemental material shall be sent directly to the copyright owner as specified in the copyright notice associated with the article.