
Abstract
Background
Calcium circulates bound to albumin and changes in albumin concentration will therefore affect total calcium measurements. In order to mitigate this, correction factors are frequently used. The most widely used correction equation was described by Payne and colleagues in 1973. This equation was derived from well-defined hospitalized patients’ data. Current clinical practice is consistent with the general application of the adjusted calcium equation irrespective of clinical setting. This study aims to assess the validity of this approach by the derivation of a community care-specific adjusted calcium equation (‘community equation’) and the comparison of its performance to a hospitalized patient equation and ionized calcium.
Method
Retrospective data were collected according to Payne’s criteria from an inpatient and community care setting. Data were used to derive the two equations: the in-patient equation and community equation. The outcome of these equations was compared with ionized calcium obtained from 123 healthy participants.
Results
The community equation correctly identified the calcium status of 92% of the 123 healthy participants, while the inpatient equation identified 46% only. Regression analysis against ionized calcium showed a higher R2 for the community equation than for the inpatient equation. Furthermore, we have shown that mean albumin and calcium concentrations are significantly different between these two populations.
Conclusion
In this study, we found that the diagnostic accuracy of the adjusted calcium equation in ambulant patients was improved by the derivation of a population-specific equation for the community care setting.
Background
In clinical practice, the most widely used adjusted calcium equations were derived by Payne et al. and Orrell.1,2 To date, these equations have only been derived using hospitalized patients’ data after excluding patients from endocrinology, oncology haematology departments. In the absence of a valid equation to report calcium for the community and outpatient clinics, laboratories report adjusted calcium values using a regression equation obtained from inpatient data. We postulate that this may not be a valid practice because the factors that influence calcium binding to albumin may differ in ambulant community patients and acutely sick patients. There is evidence that albumin concentrations vary with gender, age and between populations.3,4 Reports have described many inherent problems with applying equations to adjust total calcium measurements across different patient groups. For example, the equation derived by Payne et al. has been found to be most effective when used on patients with low to normal albumin and total protein concentrations, which is a similar population to the group of patients from which the equation was derived. 5 This finding suggests that the effectiveness of the adjusted calcium equation would be enhanced by deriving an equation appropriate to the population to which it will be applied. In support of this conclusion, Payne’s original study excluded patients from the renal medicine department; however, Jain et al. proved that an equation to adjust calcium derived from and applied to haemodialysis patients outperformed most of the published equations including Payne’s equation. 6
The concept of adjusting calcium to albumin equations assumes a constant coefficient of calcium binding to albumin. Besarab et al. demonstrated that this is rarely true outside the physiological concentrations range of albumin in health. They found that the binding constant KA varies significantly with albumin concentrations over the range from 10 to 90 g/L. 7 In vitro studies confirmed that albumin-bound calcium concentrations vary inversely with albumin concentrations. Moreover, calcium binding is not constant even in the range 30–70 g/L where it too shows a trend to decline. But this trend of decreased calcium to albumin binding where albumin is in the concentration range 30–70 g/L was considered insignificant and was therefore assumed to be constant. The increased rate of calcium binding at low albumin concentration was later confirmed by in vivo studies that showed a more marked effect at low albumin concentrations leading to a number of hypoalbuminaemic subjects having normal adjusted calcium concentration despite low ionized calcium. 8 Further support for Besarab’s study came from in vitro studies that have also demonstrated that the binding of calcium to albumin was not saturable at physiological concentrations of either molecule. 9 The important conclusion from these studies is that the binding characteristics of proteins change with concentration.
Comparable findings were obtained in several further studies implying that variations in albumin concentration alter protein binding characteristics and are not supportive of the use of a single regression value in different clinical settings and populations.10,11 Other disagreements with the fixed albumin-adjusted calcium factor concept include the fact that the binding affinity of albumin for calcium has a considerable intraindividual variation.12,13 We believe that the use of a single equation to adjust total calcium may result in misclassification of a patient’s calcium status and may lead to unnecessary investigations or delay necessary investigations. Therefore, this study examines current practice of general application of a single calcium adjustment equation and postulates that different populations (e.g. hospitalized patients versus ambulant patients) may also generate different regression factors.
In this study, we aim to generate an adjusted calcium equation specific for a primary care population. This equation will be validated against ionized calcium.
Materials and methods
Harrogate adjusted calcium equations: Prospective population
This phase of the study was approved by the National Research Ethics Committee of Northern Ireland (Ref 17/NI/0010). Healthy volunteers were recruited from among members of staff and visitors to the Harrogate Hospital. The inclusion criteria described a reference individual as:
Subjectively well. Over 18 years (no upper age limit). Not having been a hospital inpatient nor been subjectively seriously ill during the previous four weeks. Ideally not taking any medication, but if they are taking medications, these should be recorded (medication, dose and frequency). Not have had any alcohol in the previous 24 h. Not smoked in the hour prior to blood sampling.
Ineligible candidates included pregnant or lactating women, known cancer or renal, bone, liver disease patients or artificially fed patients. Participants with unusual or strenuous exercise during the previous days were excluded from participation.
Target sample size
A library of a minimum of 100 samples is recommended by Altman and Bland for comparing agreement between two methods of clinical measurement. 14 This sample size would give a 95% Confidence Interval (CI) of about ±0.34 S, whereas S is the standard deviation of the difference of the two methods used in this study.
Informed consent and health questionnaire
Poster advertisements were displayed in the clinical areas, and electronic invitations were sent to staff within the Harrogate hospital. Written and verbal information was presented to the participants explaining the nature of the study and any risks involved in taking part. It was stated that participants can withdraw from the study at any time with no obligation to give the reason for withdrawal.
Participants gave informed written consent. In addition to recording demographic data, alcohol and tobacco consumption, participants were asked to complete a short questionnaire about their general health including medical history, the use of prescribed and over the counter medication. The blood collections occurred over a three-month period to ensure the provision of flexible appointments for participants based on their availability.
Sample collection
Subjects were rested in a seated position for 10 min prior to venepuncture. Blood was taken without the use of a tourniquet, when possible, to avoid venous stasis. On some occasions, blood was collected with the use of a tourniquet for a very short time. To minimize venous stasis, a 30-s interval was introduced between the release of the tourniquet and sample collection.
15
If a tourniquet was used, it was applied 7–10 cm above the venepuncture site and released within 30 s to 1 min to minimize the effects of venous stasis. Repeated fist pumping was not allowed. The following blood samples were collected:
Heparin tube 1 × 2.5 mL for ionized calcium Plain tube sufficient to collect 5 mL serum, for total calcium, albumin and vitamin D EDTA tube sufficient to collect 5 mL plasma for PTH measurement
The heparinized blood was measured immediately for ionized calcium. The serum sample was allowed to clot at room temperature, and then separated by centrifugation within max 4 h of venepuncture and the serum stored for a maximum of 24 h at 4°C until analysis. The following analyses were undertaken: total calcium, albumin, vitamin D and PTH.
Analytical methods
EDTA samples were analysed for Parathyroid Hormone (PTH) on the day of collection. Total serum calcium, albumin, vitamin D and PTH concentrations were measured on one of two Roche Cobas 802 analysers (Roche Diagnostics Ltd, West Sussex, UK) in the Blood Sciences laboratory at the Harrogate Hospital. Calcium was measured using a spectrophotometric method ‘NM-BAPTA’, while albumin was measured using the bromocresol green photometric method (BCG). Vitamin D and PTH were measured by immunoassay-based methods. All measurements were made with reagents supplied by the instrument manufacturer.
The analytical performance in terms of precision (coefficients of variation) was within acceptable limits defined by this laboratory on either analyser on all of the four analytes and on three levels of internal quality control material over the period of study. There was no significant bias on External Quality Assurance (EQA) Scheme during the period of study and bias did not exceed –0.3% (performance limit ±3.5%) for calcium, 2% (performance limit ±5%) for albumin, 10% (performance limit ±25%) for vitamin D and –6.4% (performance limit ±15%) for PTH.
Ionized calcium analysis
Ionized calcium was measured by an Ion Selective Electrode (ISE)-based method on the 9180 Electrolyte Analyser (Roche Diagnostic Ltd, West Sussex, UK). All analyses were made within 30 min from blood collection and performed according to the manufacturer’s protocol. The ionized calcium assay was performed within acceptable limits defined by the manufacturer in terms of internal quality control (IQC) for the duration of the study. EQA assessment showed satisfactory performance.
Equation derivation
Retrospective biochemical data for calcium equation derivation were extracted from the laboratory database for two settings; in-patient and primary care over two to three months period in 2016. Extracted data for both inpatient and primary care subjects included the following parameters: age (>18 years), gender, calcium, albumin, ALP, ALT, potassium, creatinine and urea.
Data collected excluded patients attending the departments of Endocrinology, Haematology, Nephrology, Oncology or artificially fed patients. Data were collected for a defined period time (two to three months) to allow the availability of at least 1000 data points per equation with the use of a single set of albumin and calcium per patient. Biochemically, data were further filtered to exclude patients with ALT > 40 IU/L, ALP > upper reference limit (URL), creatinine > 200 μmol/L, urea > 15 mmol/L and potassium outside the reference interval. 10 Primary care setting data were also biochemically filtered according to Payne’s criteria. 10
Mathematical derivation of calcium adjustment equations
Adjustment equations were derived for each population using the method described by Payne. 10 The slope and intercept were obtained from the linear regression plot of total serum calcium on albumin.
The mean total calcium concentration in the population was also calculated using a normal plot histogram. The linearity of calcium regression on albumin was assessed by plotting albumin on calcium using the linear regression. This analysis produced the slope and intercept (non-bound calcium) values. The values for the intercept, slope and mean total calcium were entered into equation (1) for each laboratory and each population.
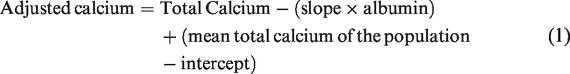
Equation (1) is mathematically rearranged to give the final format represented in equation (2).

Two equations were derived: (1) ‘inpatient equation’ using hospitalized patients’ data-set and (2) ‘community equation’, using primary care patients’ data-set.
Equations validation: Comparison to ionized calcium
The Harrogate Hospital inpatient and community equations were validated by comparing adjusted calcium values to ionized calcium concentrations obtained from the reference population (123 subjects).
Statistical analyses
All data were analysed using, Analyse-it add-in package (version 2.10) for Microsoft Excel (www.analyse-it.com). A normal probability plot was used to find the constant factor value (Intercept) which represents the non-protein-bound calcium and to calculate the mean calcium in each population. Linear regression was constructed to derive the regression factor (slope) for each population. The linear regression model was also used to compare the regression factor R2 for the in-patient and community equations. Deming Fit was used to compare adjusted calcium results from inpatient equation to those from the community equation. The t-test was used to test the statistical significance between the adjusted calcium mean of the newly derived equation and the inpatient equation. The Z test was used to test the statistical significance between the albumin and calcium mean from inpatient and primary care populations.
Results
Harrogate equations: Prospective population
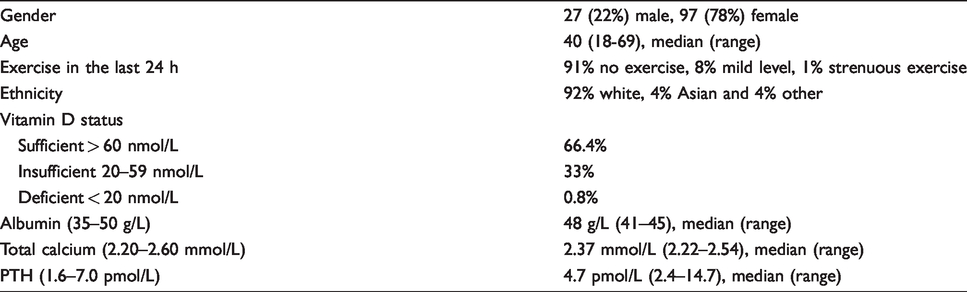
The ionized calcium study recruited 125 subjects (Table 1). Of these 53% of the studied population were taking no medication; 9% and 15% were taking vitamin D or multivitamins, respectively. The remaining 23% were taking one or more of antidepressant, hormone replacement therapy, thyroid replacement therapy, a proton pump inhibitor, inhaled bronchodilator, statin or diuretic. Two subjects were excluded, one because of strenuous exercise in the 24 h prior to planned venepuncture and the other because of abnormal biochemistry (PTH 19.0 [reference interval 1.6–7.0] pmol/L, ionized calcium 1.33 [reference interval: 1.18–1.33] mmol/L and total calcium 2.58 [reference interval 2.20–2.60 mmol/L]) (Figure 1).
Study population characteristics, n = 123.
Community and inpatient equations
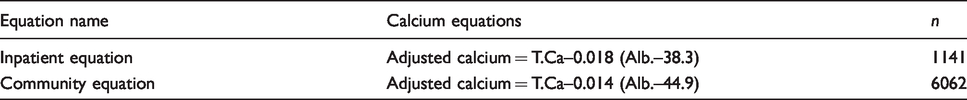
The inpatient and community equations are shown (Table 2) as are the distribution of albumin and calcium concentrations in these two populations (Table 3). The outcome of these equations has been compared with ionized calcium (Figure 2(a) and (b)).
The adjusted calcium equations derived from inpatient and community data.
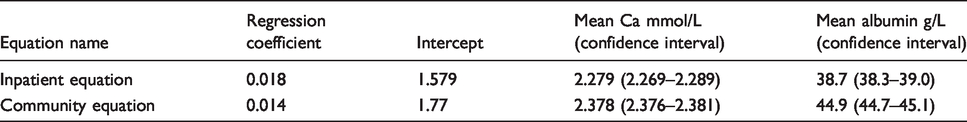
The characteristics of inpatient and community patients in terms of albumin and calcium.
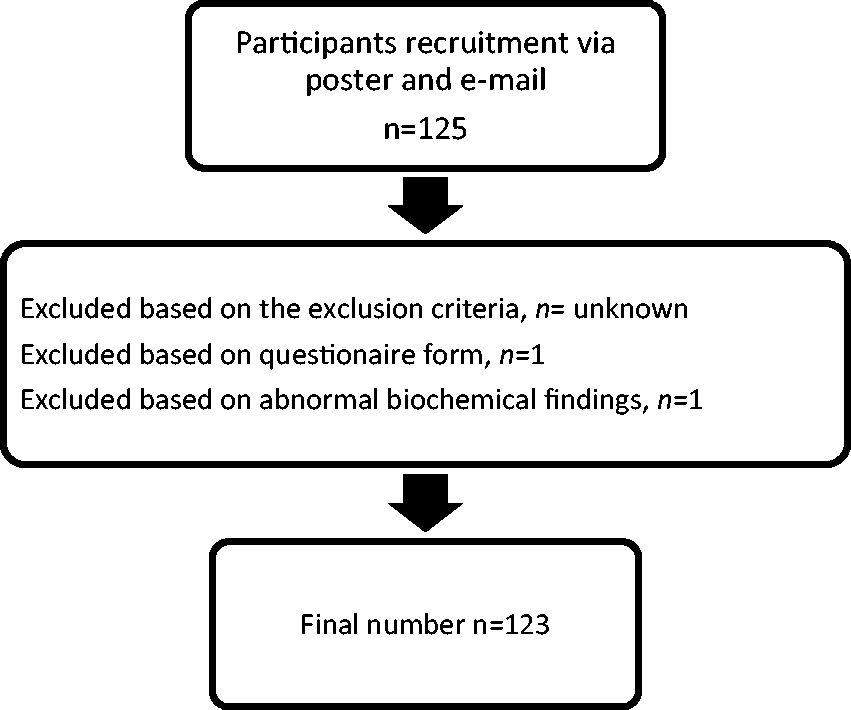
Flow chart of study participant inclusion.
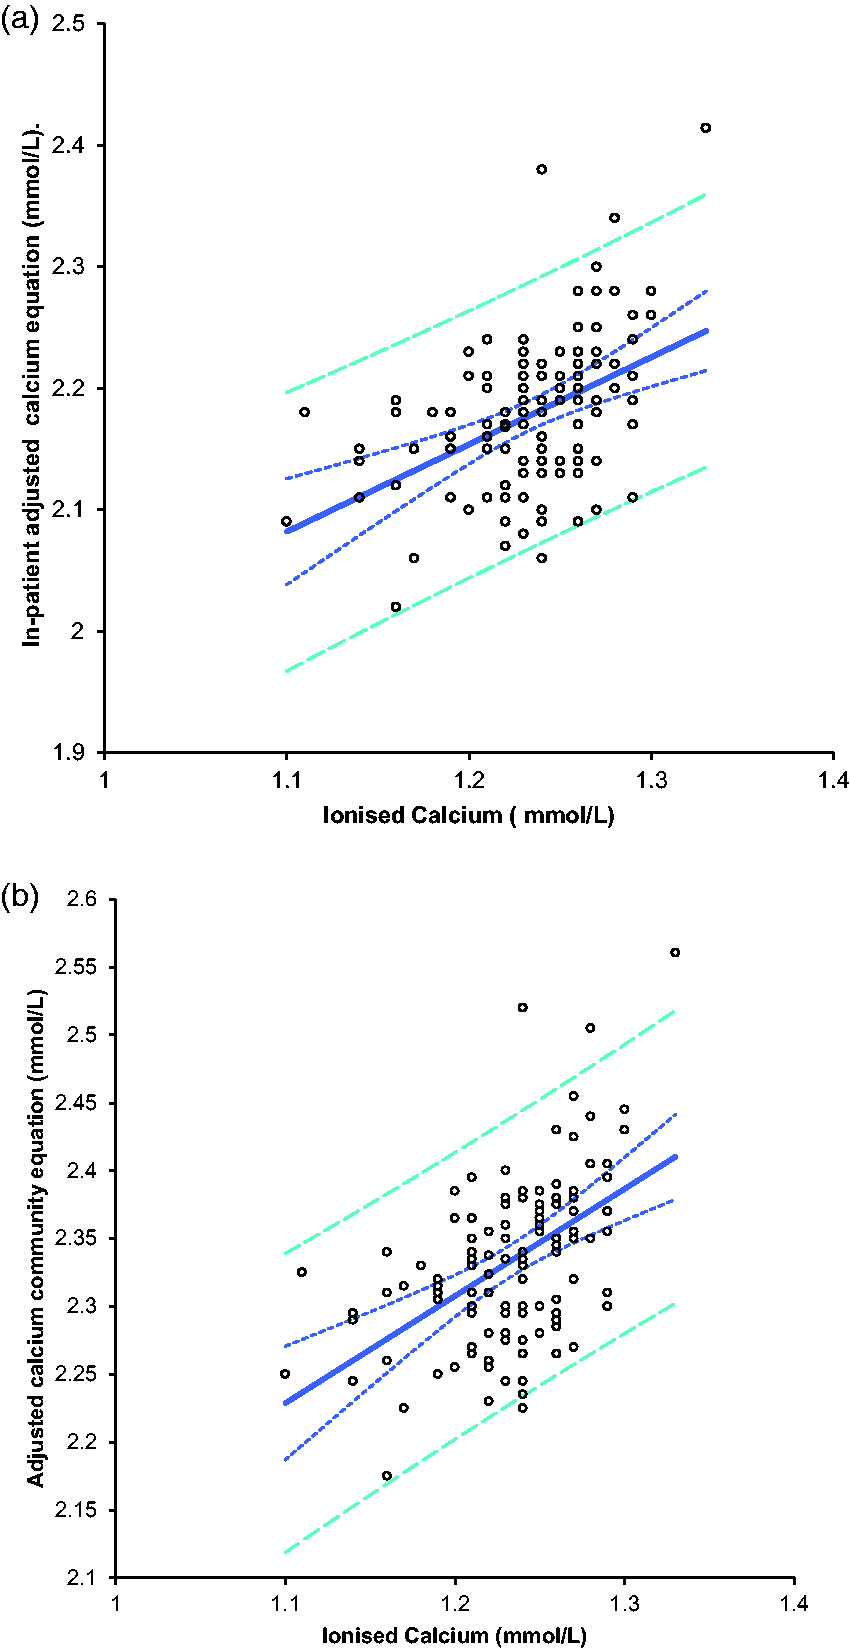
A comparison of ionized calcium and adjusted calcium equations in 123 healthy subjects. (a) Using the routine inpatient adjusted calcium equation. (b) Using the newly derived community equation.
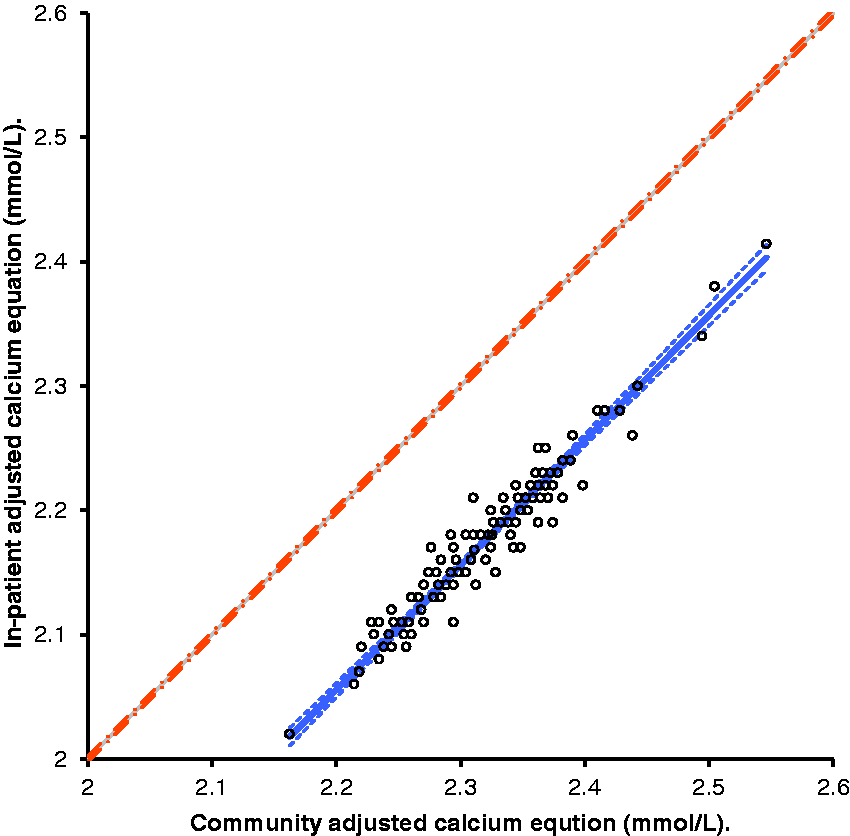
A comparison of adjusted calcium values for 123 healthy subjects derived from inpatient and the community equations.
Validation of the community regression equation against the routine equation
In order to validate the newly derived adjusted calcium for the community population, the routine inpatient equation and the community-specific equation were applied to the data-set obtained from 123 healthy subjects. A statistically significant difference between the two population means was observed with a mean difference of –0.156 mmol/L, 95% CI of (–0.1586 to –0.1539, P< 0.0001; t-test). The adjusted calcium community equation mean of 2.33 mmol/L was higher than the mean from the routine inpatient equation (mean of 2.177 mmol/L). This difference of –0.156 mmol or (7.6%) is also clinically significant as it exceeds the allowable difference of 5% or 0.1 mmol/L for this laboratory or the minimal allowable error of 4.6% as set by the biological variation model. 16
Similar to the t-test finding, the Deming Fit analysis for the adjusted calcium values of the two equations showed that the routine inpatient equations underestimated calcium status by 0.160 mmol/L in comparison to the community-specific equation (Figure 3). This finding agrees well with the calcium mean analysis, and the difference in adjusted calcium values obtained from these equations exceeds the allowable limits for calcium, which suggests that these are distinctly different equations.
Validation of the community regression equation with ionized calcium
Paired samples for ionized calcium and total calcium were analysed for 123 healthy subjects. The routine inpatient equation and the community-specific equation have been applied to the data-set obtained from 123 healthy individuals. The comparison between adjusted calcium that was calculated using the routine inpatient equation and ionized calcium is as follows
Adjusted calcium = 1.292 + (0.7181 × Ionized Calcium), R2 = 0.20
Intercept = 1.292 95%CI (0.983 to 1.601, P< 0.0001)
Slope = 0.7181 95%CI (0.4679 to 0.9683, P < 0.0001)
The comparison between the newly derived adjusted calcium equation for the community population and ionized calcium is as follows
Adjusted calcium = 1.361 + (0.7887 × Ionized Calcium), R2 = 0.26
Intercept = 1.361 95%CI (1.065 to 1.658, P < 0.0001)
Slope = 0.7887 95%CI (0.5483 to 1.0291, P < 0.0001)
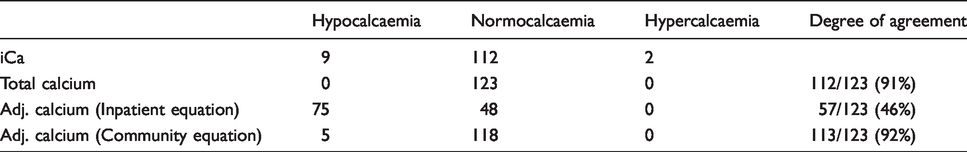
Calcium status was classified as hypo/hypercalcaemia according to the reference intervals of 1.18–1.33 mmol/L (in-house) for ionized calcium and 2.2–2.6 mmol/L (Pathology Harmony) for adjusted calcium and total calcium (Table 4). Using ionized calcium as a gold standard, the number of patients in whom calcium status was correctly predicted was 57/123 (46%) using the routine inpatient adjusted equation, 113/123 (92%) by the community-specific equation and was 112/123 (91%) by total calcium. Our data show that the use of the inpatient adjusted calcium equation, derived using Payne’s exclusion criteria, underestimated and significantly misclassified calcium status in healthy subjects. On the contrary, the newly derived community equation, which was also derived using Payne’s exclusion criteria, compares well with ionized calcium in the classification of calcium status.
Calcium classification status assessed against ionized calcium.
Discussion
At present, adjusted calcium measurements are reported on all patients whether they are hospitalized, outpatients or in primary care settings using equations that have been derived from hospitalized patients’ data. We postulated that this practice may cause misclassification of calcium status in non-hospitalized patients. In this study, we have evaluated the use of a routine inpatient adjusted calcium equation in the primary care setting. A locally derived adjusted calcium equation specific to the community population was formulated. We validated the newly derived equation against ionized calcium results obtained from 123 healthy subjects.
The adjusted calcium community-specific equation agreed well with ionized calcium in predicting the correct calcium status in 92% of the 123 healthy individuals. On the other hand, the routine inpatient equation performed poorly and only correctly predicted the calcium status in less than 50% of the healthy participants. Furthermore, Deming Fit analysis for the adjusted calcium from the routine inpatient equation and the community equation showed that the routine inpatient equation produced lower adjusted calcium results (with an average of –0.160 mmol/L) compared with the community-specific equation. These findings support the suggestion that the application of a single regression equation to different clinical settings may result in misclassification of calcium status. We therefore argue against the general application of a single regression equation in different clinical settings and populations.
Calcium regression on albumin is a mathematically derived factor which depends on a number of variables related to albumin, calcium and the environment where the binding occurs. Affinity studies showed that albumin–calcium binding varies widely between individuals, and this variation is wider in diseased than in healthy populations.17–19 This variation in albumin-binding affinity is mathematically translated to a wide regression variation. 18 One can conclude that regression variation would be greater in diseased individuals due to the presence of disturbed metabolic processes which may alter albumin affinity and the presence of drugs that may compete with calcium on albumin-binding sites.19–21
Binding capacity is another factor that affects the albumin–calcium binding relationship. Pedersen showed that the binding constant depends on the concentration of both albumin and calcium. 22 There is also evidence that albumin concentrations in supine patients are lower than that seen in recumbent or mobile patients.23,24 In agreement with Orrell, the data presented here showed that mean albumin and calcium concentrations in hospitalized patients were significantly lower (P < 0.0001) than in primary care populations (Table 3). 2 Indeed, albumin as an acute phase protein is lower in acutely ill patients than in ambulant patients. A recent study in primary care showed that mean albumin concentration on ambulant patients reaches a peak at the age of 20 years and declines with old age. 3 As our data collection criteria excluded all those under 18 years old in both clinical settings, the proportion of patients with old age would certainly be higher in the hospital data-set and thus contribute to a lower albumin mean in this population. While calcium disorders are prevalent in both hospital and primary care settings, hypocalcaemia of acute severe illness is well documented and thus contributes, among many other causes, to a lower calcium mean in hospitalized patients. 25
These arguments render the use of a single equation derived from hospitalized patients and applied to ambulant patients as questionable. The difference in mean calcium and albumin also suggest that hospitalized patients and primary care patients are two distinct populations. In support of this point, a previous study that evaluated the use of an adult adjusted equation in neonates and children also concluded that the significant difference in albumin mean between these age groups invalidated the use of an adult adjusted calcium equation in neonates and children. 4
To highlight the different characteristics of these two populations, the hospitalized population consists of a group of supine, severely ill patients with probably a higher mean age than the primary care population. The primary care population on the other hand comprises ambulant, chronically ill patients, those who are attending for health screening and a young population with a short episode of illness. One can conjecture that these are two populations with different calcium albumin binding characteristics and concentrations; therefore, different regression equations would arise from those distinctively different populations.
The literature presents compelling evidence supporting the concept of a population specific equation. Ladenson et al. 5 compared 13 published equations versus ionized calcium, and they noted some improvement in calcium classification when an algorithm was derived from a given population’s own data. 5 More recently, Jain et al. also produced a population-specific equation from end-stage renal patients on haemodialysis that out-performed Payne’s calcium equation. 6 Ferrari et al. proved that the inclusion of phosphate in the regression equation improved the diagnostic accuracy of Payne’s equation. 26 It is not known however, if the main reason for equation performance improvement was the addition of phosphate to the regression or the application of an equation to the population from which it was derived. On the contrary, another research group presented a similar concept but could not confirm that the addition of phosphate improved the adjusted calcium equation in renal failure patients. 27
In the healthy individuals, it was found that total calcium was superior to the routine inpatient adjusted equation and predicted the correct calcium status in 91% of healthy subjects. This finding is not surprising, because the concept of albumin-adjusted calcium was introduced to counteract the hypoalbuminaemia effect in the diseased population and this population consisted of healthy subjects. However, in disagreement with the critics of adjusted calcium practice, total calcium failed to pick out those with hypocalcaemia or hypercalcaemia in the healthy participants studied.
Our regression analysis of adjusted calcium equations gave low R2 regression factors of 0.2 and 0.26 for inpatient and community-specific adjusted calcium equations, respectively. It is worth mentioning that low R2 values, but with a good residual plot, can still be indicative of a good regression model. 28 In support of this, the small change in R2 value from 0.2 to 0.26 with the introduction of the population-specific equation resulted in improving the prediction of the correct calcium status from 46% (inpatient equation) to 92% (community equation).
To our knowledge, this is the first study that has derived and validated an equation specific for ambulant patients. The strength of our findings stems from comparing the newly derived community equation outcome to ionized calcium, which is considered the gold standard for calcium measurement. However, some limitations of this study should be discussed.
We have shown previously that different analytical platforms produce different regression equations. 10 This implies that the validated community adjusted calcium equation might only be relevant to a Roche Cobas analytical platform, NM-BAPTA calcium method and BCG albumin method, as used in the current study. The process of replicating this work on all commercially available analytical platforms and to account for different methodologies of albumin and calcium would require the participation of at least 12–18 laboratories to cover all the combinations of commonly used and commercially available calcium and albumin methods. Such an exercise was outside of the scope of this study. Another potential limitation of this study is that the reference subjects studied for ionized calcium were (largely) healthy health care professionals, which may have an impact on the study's conclusion. This may potentially have an impact on this study’s conclusion. Therefore, a larger multicentre study recruiting a reference population from a primary care setting would be recommended to validate the outcome from this study.
In conclusion, we have evaluated the use of an inpatient equation in the primary care setting. We have shown that mean albumin and calcium are significantly different between these two populations which is supportive of the use of a population-specific equation. The literature reports a plethora of attempts to improve the diagnostic accuracy of calcium. This work is an addition to all previous efforts in this field. We found that the diagnostic accuracy of the adjusted calcium equation was improved by the derivation of a population-specific equation. The new practice may lead to better utilization of health-care resources.
Footnotes
Acknowledgements
The ionized calcium analyser was loaned by Roche Diagnostics.
Competing interests
None
Declaration of conflicting interests
The author(s) declared no potential conflicts of interest with respect to the research, authorship, and/or publication of this article.
Funding
The author(s) received no financial support for the research, authorship, and/or publication of this article.
Ethical approval
Guarantor
NJ.
Contributorship
NJ planned, collected and analysed the data. NJ drafted the paper. AV advised on statistics and number of healthy individuals included in this study. All authors contributed to the content and the final outcome. All authors read and agreed the final version of the article.