
Abstract
Background
Ingestion of cooked meat increases circulating blood creatinine concentration due to conversion of creatine during cooking. This may cause falsely low estimated glomerular filtration rate. National Institute for Health and Care Excellence chronic kidney disease guidelines recommend meat avoidance prior to blood testing for estimated glomerular filtration rate. Fish muscle also contains creatine, but the influence of fish consumption on blood creatinine concentration has not been studied.
Method
Four blood samples were collected from each of 20 healthy volunteers: one before and three (at 2, 4 and 20 h) after consuming cooked fish (200 g/person cod, approximately 35 g/person protein). Apart from this meal, for the study duration, subjects were asked to avoid eating meat or fish. Creatinine and cystatin C were measured and estimated glomerular filtration rate (CKD-EPI equations) was calculated.
Results
Serum creatinine concentration (mean) was increased relative to the preprandial concentration (71.8 μmol/L) in all subjects at 2 h (77.3 μmol/L) and in 17/20 subjects at 4 h (75.5 μmol/L) (P < 0.0001) but was not significantly different from baseline after 20 h (73.6 μmol/L P = 0.1170). Mean cystatin C concentration remained unchanged throughout the study (P > 0.05). Estimated glomerular filtration rate calculated using the CKD-EPI (creatinine) and CKD-EPI (creatinine and cystatin C) equations demonstrated significant declines at 2 and 4 h (P < 0.0005), while the CKD-EPI (cystatin C) equation remained unchanged (P > 0.05).
Conclusion
Cooked fish consumption transiently increases blood creatinine concentration and consequently lowers the estimates of glomerular filtration rate derived from creatinine-based equations. Consideration should be given to avoidance of cooked fish consumption before glomerular filtration rate estimation.
Ingestion of cooked meat is known to increase blood creatinine concentration.1–3 This occurs due to the conversion of creatine to creatinine during cooking and its subsequent absorption from the gastrointestinal tract into the bloodstream. Consequently, estimated glomerular filtration rate (eGFR) may be falsely reduced following cooked meat ingestion. This has clear implications for kidney function assessment and represents a risk for misclassifying chronic kidney disease (CKD). 1 National Institute for Health and Care Excellence (NICE) guidelines recommend a period of meat avoidance prior to blood sampling for creatinine measurement. 4 Fish muscle also contains creatine, 5 but the influence of cooked fish consumption on blood creatinine concentration has not been studied. The aim of this study was to address this gap in the evidence.
Twenty healthy volunteers (9 males, 11 females; 19 Caucasian, 1 African-Caribbean; mean [SD] age 34 [12] years; mean [SD] body mass index [BMI] 23.8 [3.9]), not known to have kidney disease were recruited. For the duration of the study, and from 22:00 the evening before the study, the participants were asked to avoid eating any meat or fish other than the study meal provided. Other foods were permitted. At approximately 12:00, the participants consumed a cooked fish meal (200 g/person cod, approximately 35 g/person protein, oven-cooked at 180°C for 15 min as a baked dish in a tomato sauce). Blood samples were collected from each subject immediately before and 2, 4 and 20 h after consumption. Blood was centrifuged and serum stored at −80°C within 2 h of venepuncture. Samples were subjected to analysis within one month of venepuncture. Samples were analysed in random order in a single batch by a single operator. Creatinine (enzymatic assay) and cystatin C (immunoassay) were measured on each sample using an Abbott ARCHITECT® ci41000SR analyser (Abbott Laboratories, Maidenhead, Berkshire, UK) and GFR estimated using Chronic Kidney Disease Epidemiology (CKD-EPI) Study equations.6,7 Within-batch imprecision (coefficient of variation, %) for the creatinine and cystatin C assays was 0.7% and 0.6%, respectively. 8 Participants gave informed consent and the study had full ethical approval (REC reference 18/SC/0273).
All analyses were undertaken using Analyse-It software (Analyse-It, Leeds, UK). The Shapiro-Wilk test was used to test for normality of creatinine, cystatin C and eGFR data-sets at all time-points. Differences in creatinine, cystatin C and eGFR at the three time-points after the meal were compared against baseline using compare pairs – one-way within ANOVA (analysis of variance) testing with subsequent pairwise comparison using paired t-testing where appropriate. Correlation analysis was used to test for relationships between changes in blood markers and participant characteristics.
Data are shown in Table 1. Mean serum creatinine concentration (preprandially 71.8 μmol/L) increased significantly at 2 h (77.3 μmol/L) and 4 h (75.5 μmol/L) postprandially (P < 0.0001; paired t-test) but had returned to baseline at 20 h (73.6 μmol/L P = 0.1170). GFR estimated using the CKD-EPI (creatinine) and CKD-EPI (creatinine and cystatin C) equations demonstrated significant declines at 2 h and 4 h (P < 0.001), mirroring the changes in serum creatinine concentration. Cystatin C concentration and GFR estimated using the CKD-EPI (cystatin C) equation remained unchanged at all time-points (P > 0.05 in all cases). No individual at any time-point in the study, using any of the three GFR equations, had a GFR estimate <60 mL/min/1.73 m2.
Comparison of mean (95% confidence interval, CI), and range serum creatinine, cystatin C and eGFR (using the three different CKD-EPI equations).
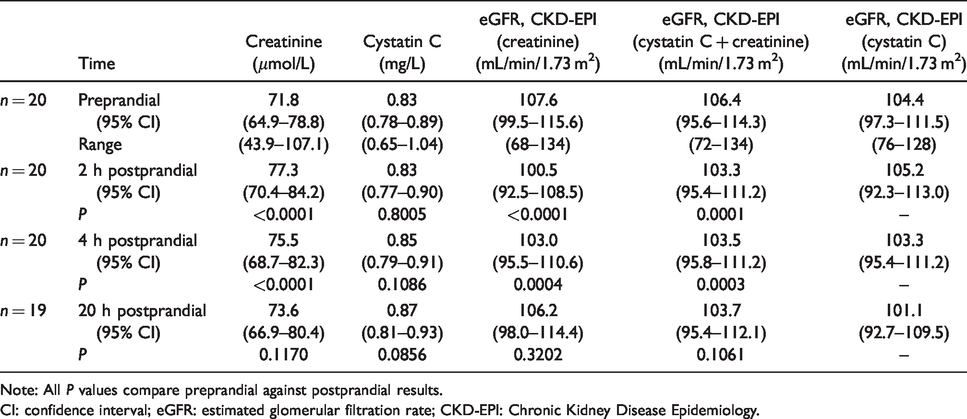
Note: All P values compare preprandial against postprandial results.
CI: confidence interval; eGFR: estimated glomerular filtration rate; CKD-EPI: Chronic Kidney Disease Epidemiology.
Body mass index, height, weight and baseline creatinine concentration were all unrelated (P > 0.05) to both the percentage and absolute increase in creatinine concentration at the 2 h and 4 h time-points. Age was significantly correlated with both the percentage and absolute increase of creatinine at 4 h (P = 0.04).
Our data are consistent with those observed by others following cooked meat consumption and suggest that creatine in fish muscle is also converted to creatinine during the cooking process and increases blood creatinine concentration following consumption. The lack of increase in serum cystatin C concentration postprandially further suggests that the observed increase in serum creatinine concentration is caused by ingestion of creatinine rather than a true effect on GFR and illustrates a potential advantage of cystatin C as a marker of kidney function.
The 7.4% mean increase in creatinine observed 2 h after cooked fish consumption was modest compared with the 24.7% increase observed by Preiss et al. 1 following cooked meat consumption. This was somewhat unexpected since the creatine content of fish skeletal muscle has been reported to be at least equivalent to that of mammalian skeletal muscle. 5 Nair et al. 2 and Toffaletti et al. 3 used standardized meat meals (46 g beef burger or between 142 and 340 g beef, respectively) and observed similar increases in blood creatinine concentration to those of the current study. Toffaletti et al. 3 observed little difference in creatinine concentration whether 142–170 g or 284–340 g hamburgers were consumed, suggesting that the amount of meat ingested was not the main determinant of the observed change in creatinine concentration. Demographic differences between the study cohorts, for example affecting the way the body handles an acute protein load, could explain the lesser effect observed in the present study compared with that of Preiss et al. 1 These authors studied a combination of laboratory volunteers and elderly outpatients with an average baseline eGFR of 84.0 mL/min/1.73 m2, compared with the present study, where all the participants were younger volunteers with a baseline eGFR of 107.6 mL/min/1.73 m2. Although we observed no relationship between the increase in creatinine and baseline creatinine, this may reflect the relatively narrow spread of GFRs within our cohort. Alternatively, differences between studies could be due to differences in the intensity of the cooking procedure, differences in the relative creatine content of fish and meat or differences in the protein load administered. Nair et al. observed larger creatinine increases postprandially in patients with CKD compared with those without. Further investigation could involve the use of different fish loads, different cooking conditions and study in patients with CKD.
Our study did not include control groups. However, previous research has demonstrated no significant change in creatinine measurements postprandially following a vegetarian meal.1,2 Similarly, a raw fish control group could have been used, to confirm that the effect was due to the cooking process of the fish. The data are also unlikely to reflect diurnal variation: creatinine and cystatin C concentrations decrease over the period covering our baseline to 4 h sampling points. 9
The study has identified a further simple yet potentially important preanalytical influence on serum creatinine measurement. The effect appears to be smaller than the effect of cooked meat on blood creatinine concentration, although this may be a result of the younger, non-CKD population we studied. The data from this study suggest that guidelines for estimating kidney function using serum creatinine should recommend avoidance of fish intake in addition to avoidance of meat intake prior to blood testing.
Footnotes
Acknowledgements
We would like to thank the staff in Clinical Biochemistry in East Kent Hospitals and the volunteers who participated in this study, without whom this work would not be possible.
Declaration of conflicting interests
The author(s) declared no potential conflicts of interest with respect to the research, authorship, and/or publication of this article.
Funding
The author(s) disclosed receipt of the following financial support for the research, authorship, and/or publication of this article: The project was funded from internal departmental educational budget.
Ethical approval
Full ethical approval for this study was given by Health Research Authority (HRA) and Health and Care Research Wales (HCRW) on the 10th July 2018 (R&D Ref. 2018/CB/01; REC Ref. 18/SC/0273; IRAS No. 246870).
Guarantor
EL.
Contributorship
All authors contributed to the design of the study. KS undertook the laboratory analysis. All authors read, edited and approved the final version of the article.