
Abstract
Background
Serum total N-terminal propeptide of type I collagen (P1NP) and serum C-terminal telopeptide of type I collagen (CTX) are used as reference analytes of bone turnover in clinical application. Biological variation is important for clinical application of these biomarkers. However, the biological variation data of these biomarkers are not consistent. The present study determined biological variations of total P1NP and CTX and their confidence intervals in China using electrochemiluminescence.
Methods
We collected samples from 25 healthy individuals (17 women and 8 men, ranging from 22 to 49 years of age) at weekly intervals for six weeks. Samples were analysed in a single run in duplicate. Biological variations and their related parameters, such as reference change value and index of individuality (II) were calculated. The results were compared with individual studies in the EFLM database.
Results
Within-subject and between-subject biological variations were 8.0% and 32.5% for total P1NP and 11.4% and 38.7% for CTX, respectively. The index of individuality for total P1NP and CTX was 0.25 and 0.30, while the reference change value for P1NP values and CTX was 22.4% and 31.9%, respectively.
Conclusions
No difference was found in weekly biological variation of bone turnover markers between men and premenopausal women. Compared with daily and monthly variation, the present study based on weekly variation provided additional support for clinical application.
Introduction
Osteoporosis is a major global health problem causing an enormous medical and social burden on the nation. The World Health Organization’s (WHO) criterion for the diagnosis of osteoporosis is bone mineral density (BMD) using dual-energy X-ray absorptiometry. 1 However, the detection of change in BMD can take months or years, so it lacks the value of early diagnosis. Bone turnover markers (BTMs) detection using serum samples is convenient and quick and may provide earlier more sensitive information on changes in bone diseases than BMD.2,3 Serum N-terminal propeptide of type I collagen (P1NP) and serum C-terminal telopeptide of type I collagen (CTX) are referred as reference biomarkers for bone turnover in clinical applications by the International Osteoporosis Foundation and the International Federation of Clinical Chemistry and Laboratory Medicine. 1 P1NP is a marker of osteoblast activity and bone formation, and CTX is a marker of osteoclast activity and bone absorption. 4
For an individual patient, dynamic changes of BTMs are more meaningful. The changes of BTMs can be used to assess the effect of osteoporosis treatment and compliance to therapy. However, the judgment of this change needs the information of biological variation (BV) which refers to a random fluctuation around homeostatic set point of an individual. BV needs to be considered to assess whether the change in a series of tests from an individual are clinically significant and to interpret the utility of conventional population-based reference intervals. 5 For BTMs, BV information is important for doctors to consider whether true changes have occurred and when therapy should be started. 6
The current online BV database is on the homepage of the European Federation of Clinical Chemistry and Laboratory Medicine (EFLM). 7 Most individual studies cited in the database were assessed using outdated methods, such as ELISA 8 and radioimmunoassay.9,10 In recent years, electrochemiluminescence (ECL) has been widely used in BTM assays in clinical laboratories due to improved stability and accuracy. Although several studies on BV in BTMs have been based on ECL, the study period length are days 11 and months, 12 lacking weekly BV data. Given that BTMs will decline to a plateau within a few weeks or months after anti-osteoporosis treatment,13,14 weekly BV is an important complement to other variations. Moreover, most studies were performed using postmenopausal female subjects.11,12 Few BVs in BTMs have been reported in men, and there are not enough data to assess whether age and sex contribute to BV in bone markers. 8
The aim of the present study was first to determine BV of P1NP and CTX in young men and premenopausal women among Chinese people using the ECL method on a weekly basis. Data on BV in men and women were then calculated and compared with previous studies.
Materials and methods
Ethics approval
This study was approved by the ethics committee of the First Hospital of China Medical University.
Participants
Following completion of a detailed questionnaire and examination by a physician, 25 healthy individuals were enrolled from Shenyang, China (Chinese race). Self-reported healthy individuals were not using any prescriptions (including oral contraceptives and medicine that could affect bone status, such as anti-osteoporotic drugs), did not take any vitamins and calcium, did not have chronic diseases such as diabetes, kidney disease, did not have any acute illnesses through the study and did not report a bone disease family history. All premenopausal women were not pregnant or lactating and all had regular menstrual periods. No one was anaemic by haemoglobin detection. Infections were detected by white blood cells and C-reactive protein measurement. Exclusion criteria included smokers and heavy drinkers. Subjects were expected to maintain a stable weight in the two months prior to participation and to continue their typical lifestyle throughout the study. All volunteers had read and written informed consent according to the ethical standards of China Medical University.
Specimen collection
Blood collection was carried out on the same time of day (between 7:20 and 8:10 in the morning) on Wednesday each week for six consecutive weeks in winter. Fasting individuals were in sitting position for 20 min, with a fasting time between 10 h and 14 h. The average fasting time was 12 h. Blood was taken via standardized methods to minimize preanalytical variation. We used 5 mL vacuum collection tubes with polymer gel to collect samples (Becton Dickinson Biosciences, USA). Samples are placed for 15 min and fully clotted before centrifugation (3000g, 10 min). Then serum was separated and stored at −80°C until analysis.
Clinical laboratory testing
For testing, specimens were defrosted for 30 min at room temperature, and then mixed with a vortex-shaking apparatus, analysed in duplicate in random order and in the same analytical run. Before testing, quality control was performed and passed, with the same analyst performing all tests using the same reagent lots to minimize analytical variation. Total P1NP and CTX concentrations were analysed using ECL with the Roche E170 immunology analyser (Roche Inc., Japan). Reagents (TP1NP, lot: 187708; CTX, lot: 185926) and the quality control (precicontrol varia, lot: 172559) were all obtained from Roche.
Statistical analyses
Tests for outliers
Three steps were used to detect outliers before analysis 5 : (a) Cochran’s test was used to detect observations outliers (from duplicate results); (b) outliers among within-subject variances. Cochran test was also performed to examine ratio of the maximum variance to the sum of variances. If an outlier is identified, we exclude all data of that subject; (c) Reed’s method determined outliers among mean values of subjects. The criterion considers the difference between the extreme value and the next highest (or lowest) value and rejects the extreme if this difference exceeds one-third of the range of all values.
Normality tests and index of heterogeneity
The Kolmogorov-Smirnov test was applied to ensure normality for all data, and Shapiro-Wilk test was applied to ensure data normality for each subject. The index of heterogeneity (IH) was used to define the within-subject variation data homogeneous. IH was estimated as the ratio of the observed CVT to theoretical CV, which is [2/(k−1)]1/2, where k is the average number of samples collected per subject. The SD of the difference between this ratio and its expected value of unity (under the hypothesis of no heterogeneity of true within-subject variances) is 1/(2k)1/2. A significant heterogeneity is present if the ratio differs from unity by at least twice the SD. Assessing six samples for each subject, an IH < 0.576 suggests that the within-subject variations are homogeneous.
Analysis of variance
The within-subject and between-subject BV were calculated using nested ANOVA analysis (SPSS 20.0, Chicago, IL) according to Fraser and Harris. 5 In brief, analytical variation was calculated as the average variance from duplicate results of the biomarker. Within-subject biological variance was estimated from the total within-subject variance (referred to as SI2+SA2/2) minus one-half the analytical variance. Between-subject BV was estimated from the total variance of the data minus the analytical and within-subject components. Then, all variance components were converted to the relevant CV utilizing the overall mean.
Confidence intervals (95% CI) for BV of BTMs were calculated according to Burdick and Graybill. 15 We used the balanced two-fold nested random model to estimate CIs of BTMs. Briefly, the two-sided CI was estimated using the respective variance and corresponding F value. We assessed the significance of differences between men and women in CVI and CVG based on overlapping 95% CIs. 16 We also used the F-test to compare BV in the two subgroups (men and women) according to Braga and Panteghini. 17
The index of individuality (II) was calculated using the following equation: II= [(CVA2+ CVI 2 )1/2] ÷ CVG. The reference change value (RCV) was calculated using the following formula: RCV = 21/2× Z × [(CVA2+ CVI 2 )1/2], where the Z score was 1.96. RCV with 95% probability was considered significant. The number of tests that needed to determine the homeostatic set point for the individual was calculated using the formula: n = [Z×(CVA2+CVI 2 )1/2/D] 2 , where n was the number of specimens obtained and D was the percentage closeness to the homeostatic set point.
Results
Participants’ characteristics
A total of 25 healthy individuals were enrolled in this study and they all completed the experiment. All the individuals met the entry criteria and had a normal laboratory values as shown in Supplementary Table 1.
Distribution and BV of CTX and total P1NP
For outliers derived from duplicate measurements, we first excluded two pairs of values of CTX. Then a total of four subjects were excluded from analysis according to Cochrane’s test (for CTX: subjects 3, 18; for P1NP: subjects 3, 4 and 19). No outlier was found in Reed test. CTX concentrations showed a normal distribution, and total P1NP concentrations showed a normal distribution after logarithmic transformation. The values of outliers and reasons for their exclusion are given in Supplementary Table 2. After excluding outliers, there were 272 and 264 for CTX and total P1NP values detected, respectively. As shown in Figures 1 and 2, the mean value of CTX and total P1NP was 418.9 pg/mL and 48.2 ng/mL, respectively. The minimum and maximum values of CTX were 130.8 pg/mL and 821.5 pg/mL, while the minimum and maximum values of total P1NP were 21.3 ng/mL and 85.7 ng/mL. We also evaluated the heterogeneity by IH values, and results (0.18 for CTX and 0.128 for P1NP) fulfilled the homogeneity condition; the mean of the within-subject variation can be used to calculate a reference change value between two consecutive tests, which is valid in different individuals.
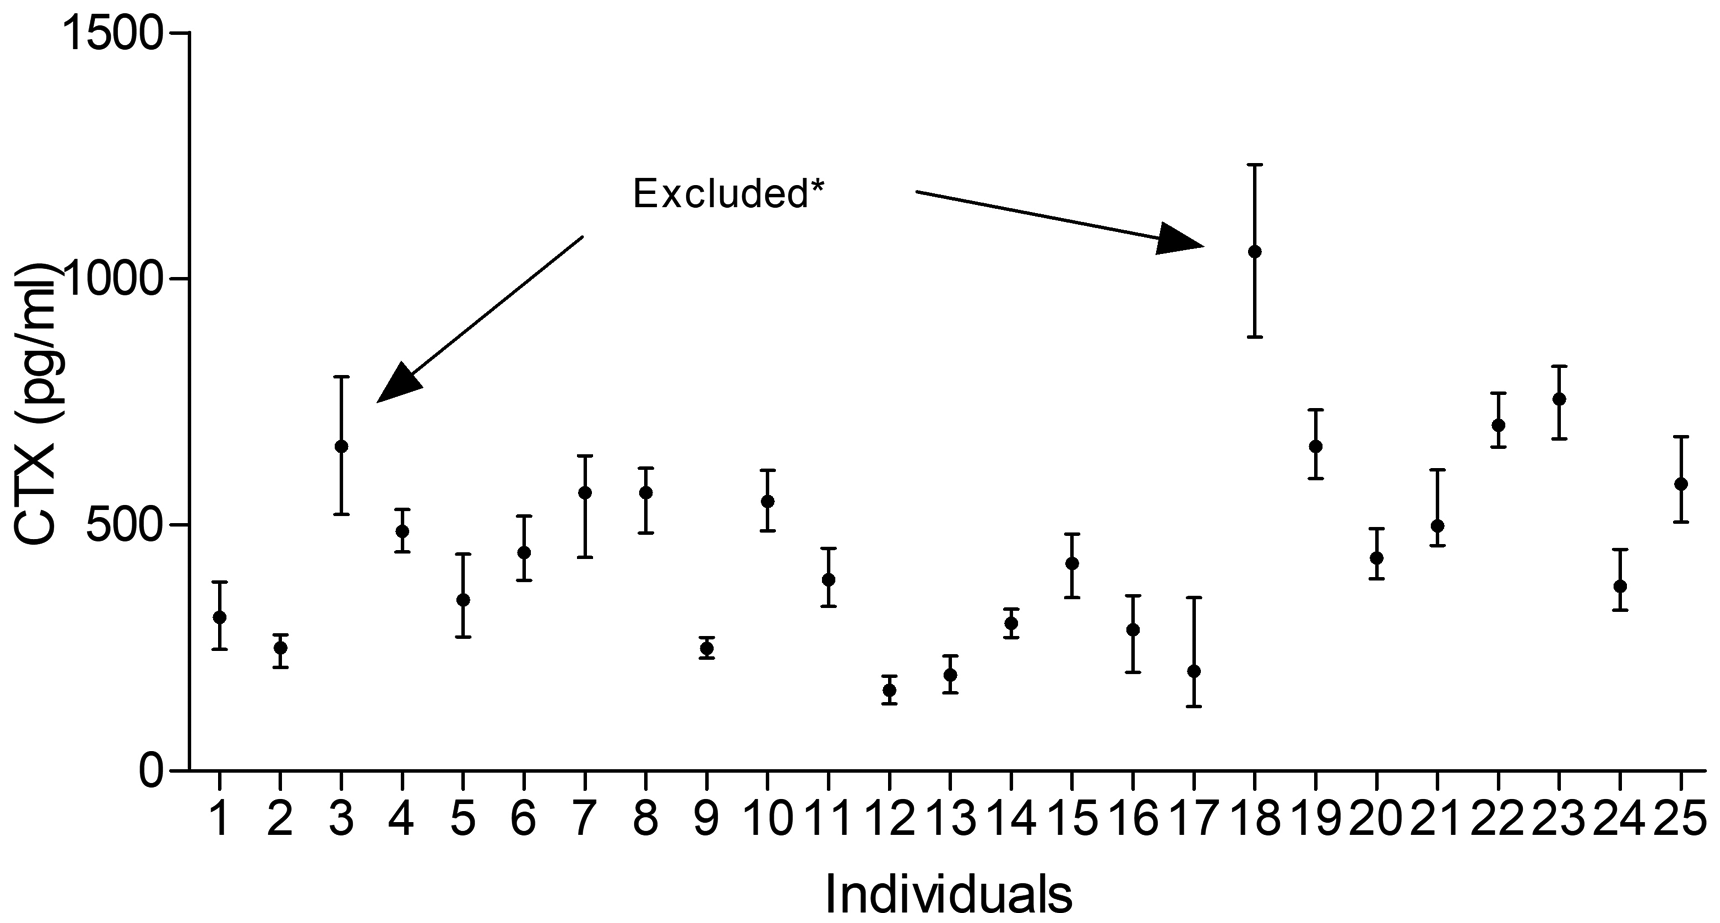
Mean and absolute range of CTX in 25 healthy individuals (1–17 women, 18–25 men); the arrows indicate excluded participants because of Cochran criterion (*).
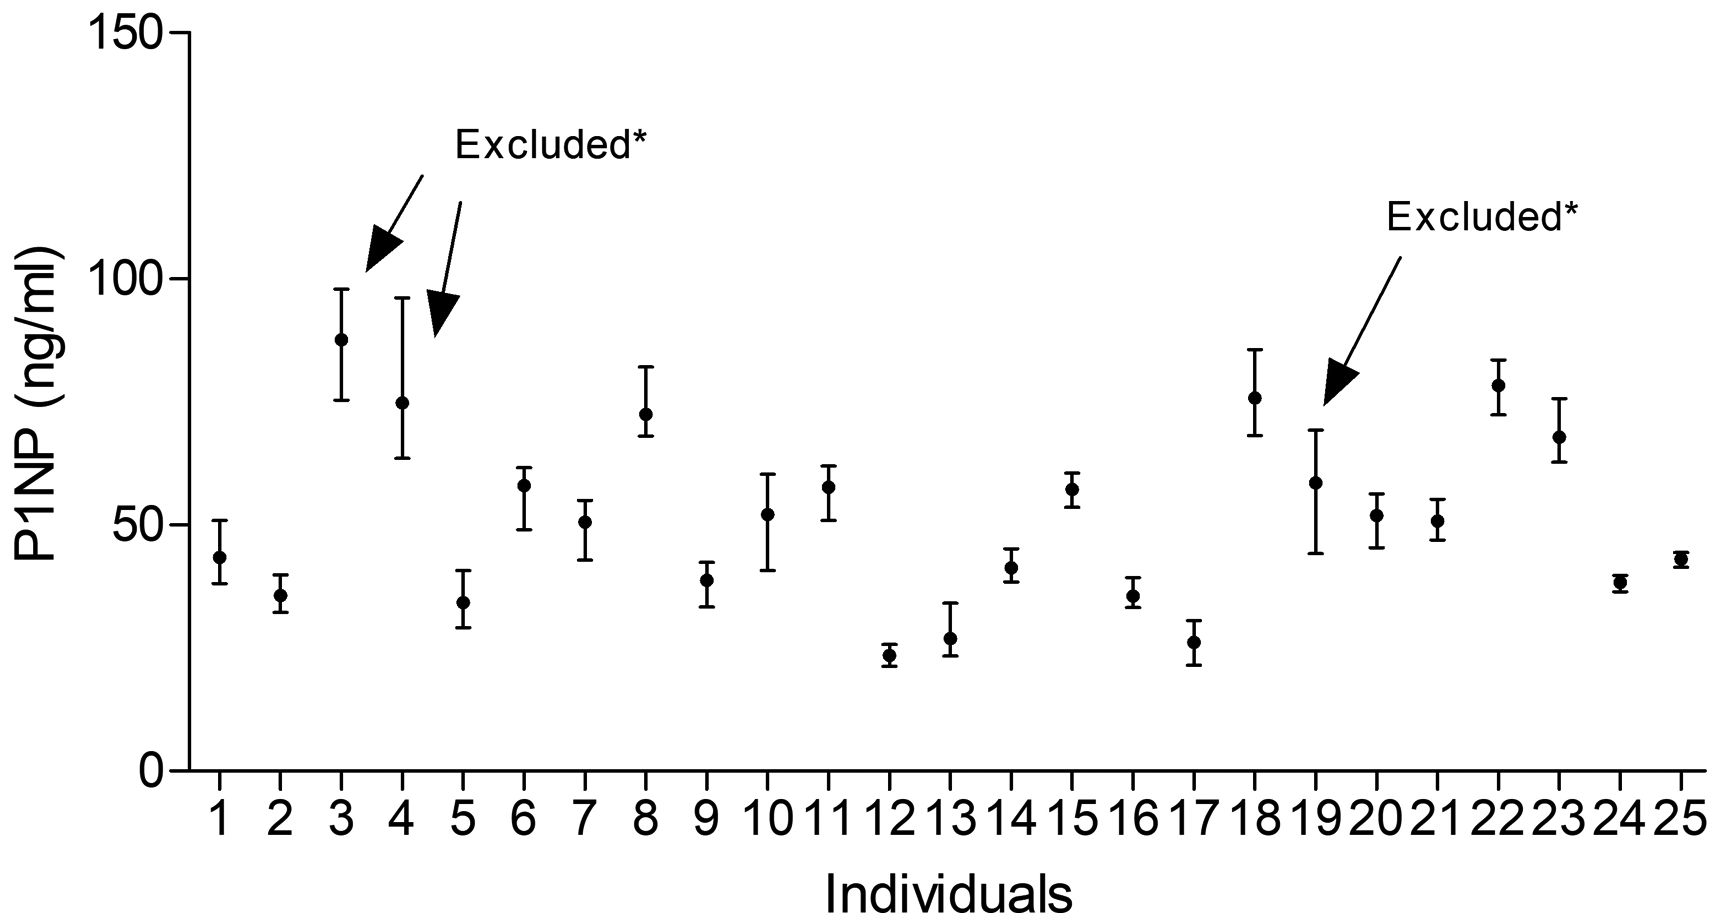
Mean and absolute range of P1NP in 25 healthy individuals (1–17 women, 18–25 men); the arrows indicate excluded participants because of Cochran criterion (*).
Within- and between-subject BV for total P1NP and CTX are shown in Table 1. Analytical variations for CTX and total P1NP were 1.8% and 1.4%, respectively. Within-subject BV was lower than between-subject BV for both markers. CVI, CVG and corresponding CIs were calculated for both sexes. Within-subject BV for total P1NP and CTX in women and men showed overlap in the 95% CIs. The F-test showed no gender differences in BV (P > 0.05).
Analytical, biological variation and II for serum BTM.
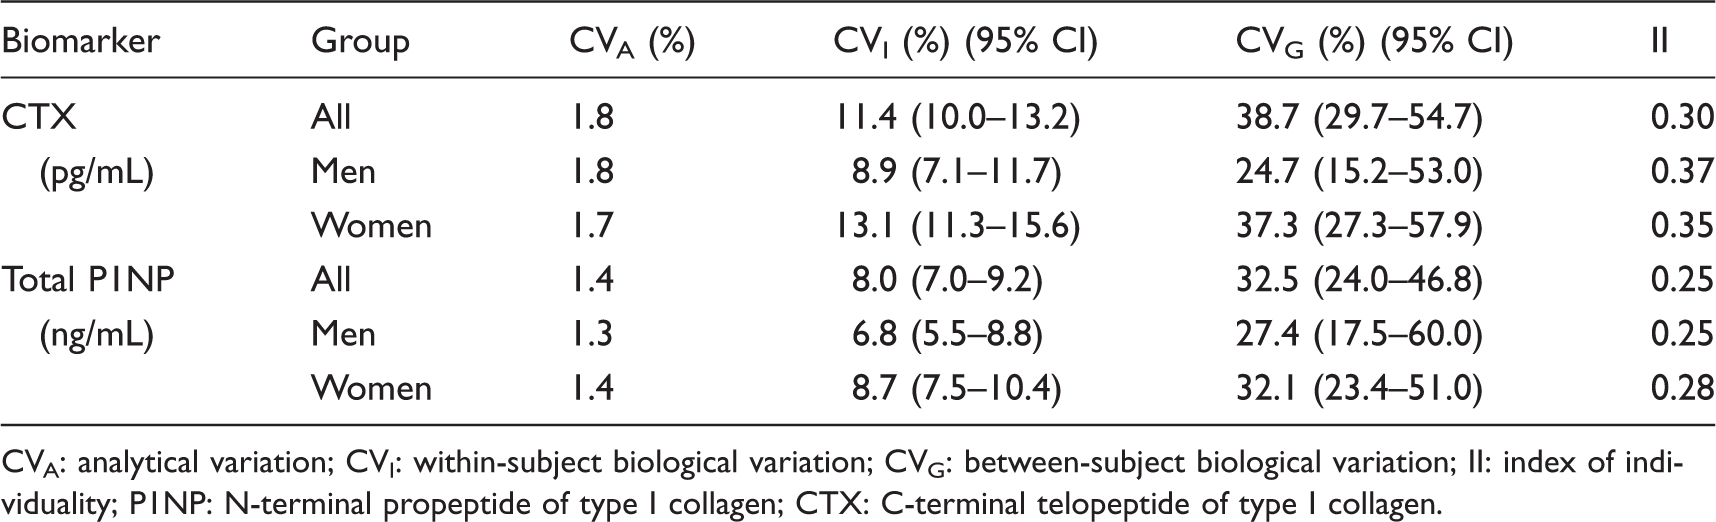
CVA: analytical variation; CVI: within-subject biological variation; CVG: between-subject biological variation; II: index of individuality; P1NP: N-terminal propeptide of type I collagen; CTX: C-terminal telopeptide of type I collagen.
Based on the data of BV, we calculated II. The II value of the two markers was 0.30 and 0.25, respectively, which were all less than 0.6. Therefore, we further calculated RCV, as shown in Table 2. The RCV for CTX and total P1NP values were ±31.9% and ±22.4%, respectively.
RCV and n for CTX and P1NP.
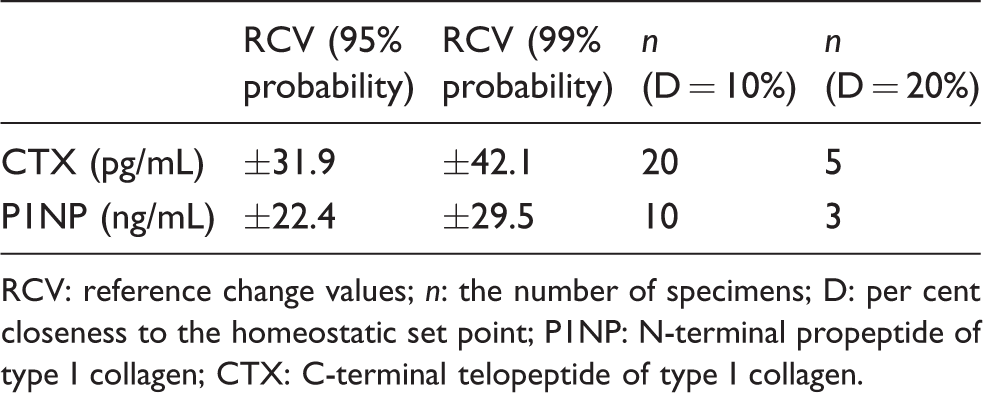
RCV: reference change values; n: the number of specimens; D: per cent closeness to the homeostatic set point; P1NP: N-terminal propeptide of type I collagen; CTX: C-terminal telopeptide of type I collagen.
Comparison of CVI and CVG between this study and previous studies
We compared CVI and RCV obtained in the present study with results from previous studies as shown in Table 3. The CVI of P1NP in the present study was similar to the previous studies based on ECL method. The CVI of CTX in the present study was inconsistent with previous studies that were based on ECL method.
Comparison of CVI of BTMs with previous studies.
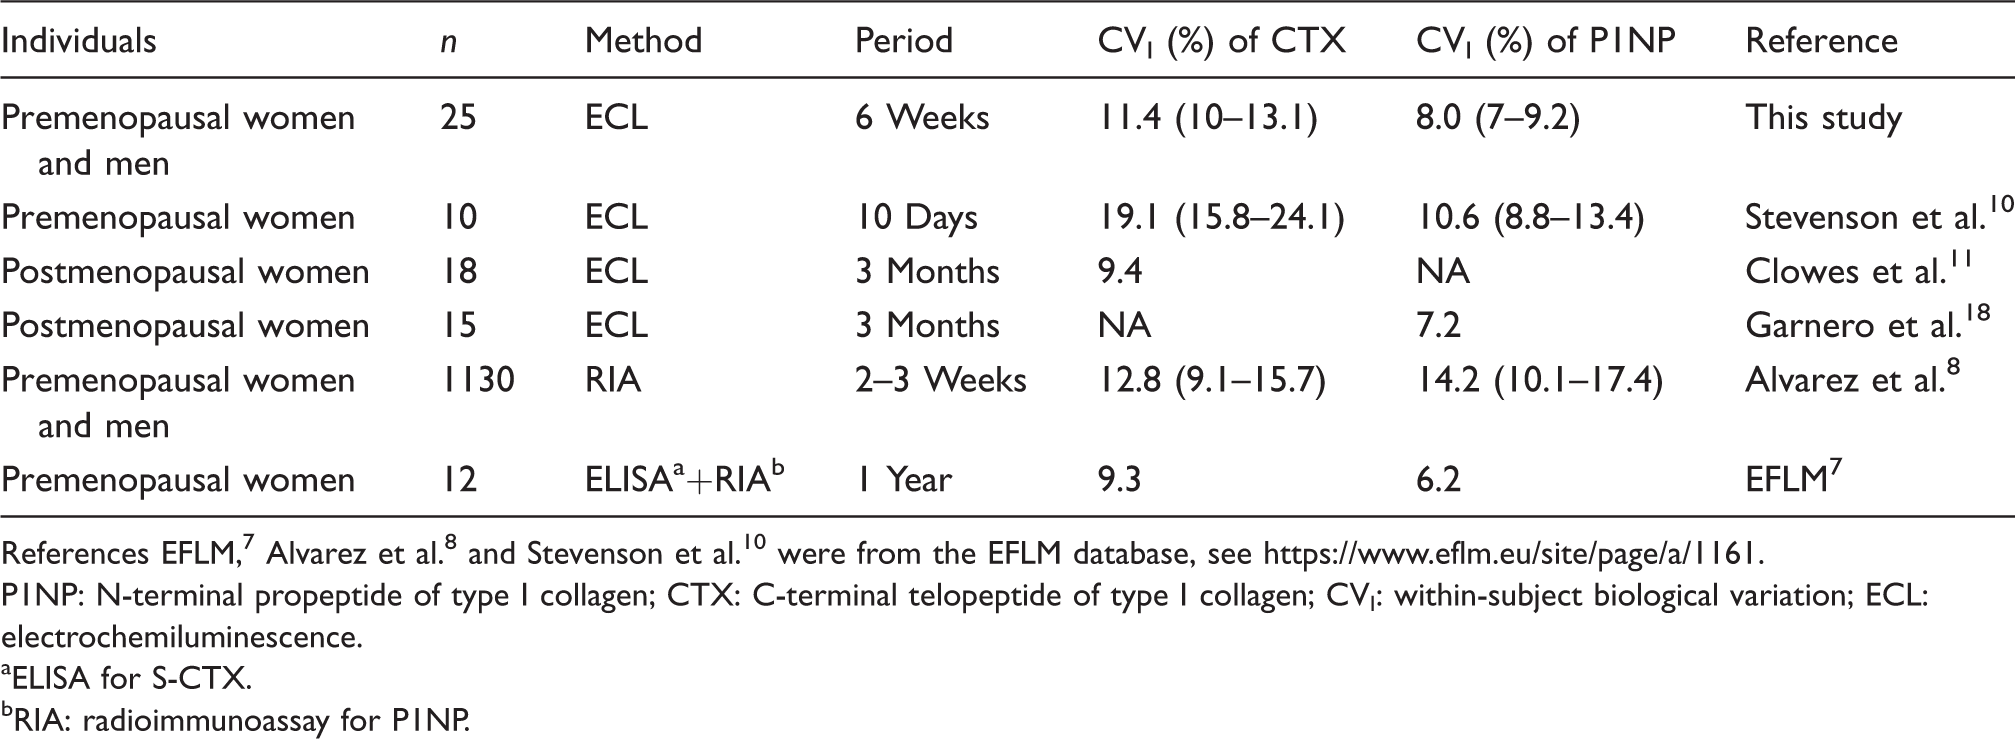
References EFLM, 7 Alvarez et al. 8 and Stevenson et al. 10 were from the EFLM database, see https://www.eflm.eu/site/page/a/1161.
P1NP: N-terminal propeptide of type I collagen; CTX: C-terminal telopeptide of type I collagen; CVI: within-subject biological variation; ECL: electrochemiluminescence.
aELISA for S-CTX.
bRIA: radioimmunoassay for P1NP.
Discussion
In this study, we evaluated the BV of BTMs in a Chinese population by ECL in a six-week period. Because BVs are important for medical laboratories and managing clinical patients, results must be robust and credible. 19 To obtain reliable BV, it is necessary to minimize the analytical and preanalytical variations. The analytical variation mainly depends on the accuracy of the imprecision of the detection system. With advances in instruments and technology, BTM assays have shifted from radioimmunoassay to ECL, leading to more stable results. The CVA obtained in this study was less than 1/2 CVI (<2%), which indicate that BV is suitable for setting desirable performance specifications for imprecision. 10 Bartlett et al. 20 proposed a checklist for critical appraisal of studies of BV. Details for each section from the study population, sampling and measurement methods to statistical methods should be provided. Preanalytical variation of BTMs mainly include circadian rhythms, food intake and exercise. 11 Hence, the present study collected fasting samples in the morning between 7:20 and 8:10 and also required volunteers to avoid intensive exercise on the day before sampling. Meanwhile, samples were taken by the same phlebotomists according to the operating rules. We have adopted various methods to reduce the preanalytical variation to ensure the accuracy of BV data.
In this study, CVI of total P1NP was 8.0%, which was similar to the 7.2% 18 reported in 15 postmenopausal women during a three-month period and the 10.6% 11 reported in 10 premenopausal women during a 10-day period using ECL method. The CVI of serum CTX in the present study is lower than that in Clowes et al.’s 11 study which was also based on ECL method. The reason may result from the difference in the duration. We collected sample weekly for six weeks, while Clowes et al. collected samples on a daily basis. The length of study may be one of the factors affecting CVI of CTX. 21 The CVI of CTX in the present study and Clowes et al.’s 11 study were higher than that reported in other study on postmenopausal women (9.4%). 12 This indicates that the menopausal status may also play a role, because menstrual cycles had effect on CTX in premenopausal women, 22 but such effect was absent in postmenopausal women. This was consistent with Chubb's view. 23 Other studies on BV of BTMs mostly use ELISA and RIA detection methods. Comparison of the present study with other published studies is difficult due to different detection methods, different statistical methods and different sampling periods.
Information about BV in men is lacking. BV for BTMs in women and men showed an overlap in 95% CIs in this study. The difference between BV in men and women was also compared using an F test for each analyte. 17 The results were similar to the overlap method, suggesting that there is no difference in BV between men and women. Thus, we used a total merged BV data when calculating RCV.
Individuality index (II), which is calculated as CVI/CVG ratio, 24 provides information about the utility of population based reference intervals. When II is smaller than 0.6, population-based reference intervals are not sensitive enough to detect unusual results for a particular individual. In this study, the IIs for total P1NP and CTX were both less than 0.6. Thus, population-based reference intervals may not be appropriate for assessing the results of these indicators, especially for follow-up examination of disease. In this situation, we can calculate the RCV. 25 For the two BTMs, the difference in continuous results must be greater than their RCVs to exceed the combined inherent variation. In this study, changes in the follow-up results need to be higher than 31.9% for CTX and 22.4% for P1NP before being considered from the true changes rather than laboratory and BVs. A minimal decrease of 30% for CTX and 20% for P1NP was considered as reference change value in oral bisphosphonate treatment as recent consensus of the Asia-Pacific Region. 26 The RCVs in our study are very close to this consensus. It is more appropriate for each laboratory using its own between-run analytical imprecision in calculating the reference change value. However, once the analytical imprecision is a fraction of the CVI, changes in imprecision do not significantly affect the magnitude of RCV. 27 We used the average of between-run analytical imprecision of BTMs from 12 months in our laboratory to calculate RCV. The results were similar to the RCV in our experiment (data not shown).
Samples were collected in the winter for six weeks. We did not evaluate the impact of seasons on BV, as seasonal variations in BTMs show little effects and serum P1NP and CTX concentrations do not change obviously throughout the course of a year. 28 There were two observed limitations in this study. Firstly, we studied young adults (up to 49 years of age), and further validation for older men and women is needed. Secondly, some outlier removals (28 outliers for CTX, 36 outliers for P1NP) would lead to the lower estimates of BV, even though it is essential for the outlier detection and removal as a part of statistical analysis of the BV study. 5
Conclusions
In this study, we obtained reliable BV data for BTMs through a strict protocol-controlled condition during a six-week period. We did not find difference between BV estimates in premenopausal women and young men. Compared with other studies using ECL method, we found that the CVI of CTX was affected by the study period, but such effect was not found for P1NP. We perfected weekly BV data of CTX and P1NP, which are a supplement to the previous studies. We found II values were low for both indicators. When we use BTM in monitoring the disease or managing patient compliance of bisphosphonate treatment, the BTM should be compared with RCV to discover the real change.
Supplemental Material
ACB899119 Supplemental Material1 - Supplemental material for Biological variation in serum bone turnover markers
Supplemental material, ACB899119 Supplemental Material1 for Biological variation in serum bone turnover markers by Shuo Wang, Runqing Mu, Xin Zhang, Ke Yun, Hong Shang and Min Zhao in Annals of Clinical Biochemistry
Supplemental Material
ACB899119 Supplemental Material2 - Supplemental material for Biological variation in serum bone turnover markers
Supplemental material, ACB899119 Supplemental Material2 for Biological variation in serum bone turnover markers by Shuo Wang, Runqing Mu, Xin Zhang, Ke Yun, Hong Shang and Min Zhao in Annals of Clinical Biochemistry
Footnotes
Acknowledgements
We would like to thank Professor Han Xiaoxu for her assistance and guidance in this research.
Declaration of conflicting interests
The author(s) declared no potential conflicts of interest with respect to the research, authorship, and/or publication of this article.
Funding
The author(s) disclosed receipt of the following financial support for the research, authorship, and/or publication of this article: This work was supported by National Key Technologies R&D Program of China (2012BAI37B01), Laboratory Medicine Innovation Unit (2019RU017) and Chinese Academy of Medical Sciences.
Ethical approval
This study was approved by the ethics committee of the First Hospital of China Medical University (2013–2013-127–2).
Guarantor
MZ.
Contributorship
SW, MZ and HS researched literature and conceived the study. RM, XZ and KY were involved in protocol development, gaining ethical approval, patient recruitment and data analysis. SW wrote the first draft of the article. All authors reviewed and edited the article and approved the final version of the article.
Supplemental material
Supplemental material for this article is available online.
Appendix
References
Supplementary Material
Please find the following supplemental material available below.
For Open Access articles published under a Creative Commons License, all supplemental material carries the same license as the article it is associated with.
For non-Open Access articles published, all supplemental material carries a non-exclusive license, and permission requests for re-use of supplemental material or any part of supplemental material shall be sent directly to the copyright owner as specified in the copyright notice associated with the article.