
Abstract
Background
Clinical laboratory instrument verification testing is often an accreditation requirement. However, it is not known what verification procedures are in routine use or how often the process identifies problems which need addressing prior to testing clinical samples.
Objective
To investigate which standards are currently being used for laboratory verification in UK and New Zealand (NZ) clinical laboratories and to help establish if the activity justifies the effort required.
Methods
A survey of verification of clinical laboratory instrumentation was distributed to members of the Association for Clinical Biochemistry and Laboratory Medicine and New Zealand Institute of Medical Laboratory Scientists. The survey consisted of questions on the verification elements used and whether acceptance criteria were met.
Results
Nineteen of 72 (26%) of responders only used organization-developed protocols for verification, 20/72 (28%) solely used national/international guidelines, while 16/72 (22%) used a combination. Manufacturers’ claims were partly or entirely used as acceptance criteria for imprecision (89%), accuracy (64%) and analytical measuring range (94%), with these being met on 61%, 67% and 93% of occasions, respectively. For patient comparison and linearity, acceptance criteria were met by 71% and 91%. Only 27–36% undertook any troubleshooting before accepting a failed component of verification.
Conclusions
Laboratories in the UK and NZ are currently using a variety of verification standards and acceptance criteria for instrument verification. It is common for instruments to fail, especially following the assessment of imprecision and accuracy. While this suggests the process is warranted, only a minority address failed elements before accepting verification.
Introduction
Laboratory instrumentation requires many different verification protocols such as imprecision, accuracy (or, more correctly, trueness) and patient sample measurement comparison to check the performance of the instrumentation (the ‘measuring system’) prior to its use in a clinical setting and the subsequent analysis of patient samples.1–12 International accreditation standards applicable to medical laboratories, such as ‘International Standardization Organization (ISO) 15189:2012 Medical Laboratories-requirements for quality and competence’, recommend the verification of new laboratory instrument prior to the testing of clinical samples, and state that the performance for the instrumentation should be checked against the manufacturers’ claims. 13
The validation of instrumentation by the manufacturer is performed using extensive testing protocols to establish the performance characteristics of the test on the instrument. 9 By comparison, instrument verification is performed by laboratory staff to ensure the instrument meets the performance claims of the manufacturer prior to the analysis of patient samples.9,14 If the verification is not performed appropriately, there is a possibility of generating and releasing inaccurate or inappropriate results with a consequent risk of patient misdiagnosis or mistreatment. 15 Thorough instrument verification, and the use of protocols assessing imprecision, accuracy and patient comparison testing by laboratory staff should be used to reduce this risk 15 and help identify if there is an issue with the test or instrument prior to the analysis and release of clinical results to requesting healthcare staff.
While accreditation bodies such as ISO and the College of American Pathologists (CAP) 16 recommend instrument verification, there is a lack of international agreement on the value of laboratory instrument verification and the extent of verification procedures required. 9 Guidance on the verification protocols and how they should be performed is provided by professional organizations such as Clinical Laboratory and Science Institute (CLSI) 17 and the Association for Clinical Biochemistry and Laboratory Medicine (ACB), 18 and while there are similarities, there are also inconsistencies between the protocols used for the performance verification. In addition, the instrument manufacturers often provide their own recommendations for instrument verification.
The current process of verifying the measuring system of a laboratory instrument is time consuming and resource intensive, 5 and the evidence base for this activity is not well established. This study aimed to understand which standards are currently being used for measuring system verification in the UK and New Zealand (NZ) laboratory communities and to identify what value there is in performing verification prior to a test or instrument adoption for patient samples.
Methods
A questionnaire was developed and circulated to the clinical laboratory communities in the UK and NZ. The survey questions enquired about the protocols used for the verification of both clinical laboratory and point-of-care instrumentation. However, only results for the laboratory data are included in this paper. The questionnaire was electronically collated through Survey Monkey (www.surveymonkey.com) and consisted of 80 questions in total, but the actual number of questions answered was dependent on the responses, as logic was included to direct the responder. Open and closed questions were asked on the details of each of the different verification protocols performed, including those associated with imprecision, accuracy, linearity, patient comparison and analytical measurement range (AMR)/clinical reportable range (CRR).
The survey was distributed by email link via the National Audit Group of the ACB in the UK, and to the members of the New Zealand Institute of Medical Laboratory Scientists (NZIMLS). The survey was open from May to July 2017.
The laboratory verification survey enquired about which guidelines were followed (if any) for laboratory instrumentation verification and their source of acceptance criteria. The sequence of questions about each of the protocols (imprecision, accuracy, etc.) was designed to evaluate the laboratory’s performance findings for each protocol. Questions common to each of the protocols included whether verification was performed at all, whether the results met the acceptance criteria and then what actions were taken in response to the results that did not meet the acceptance criteria.
Statistical analysis
For the purpose of the analysis, data from the UK and NZ were combined. However, chi-squared testing was used to determine whether there were statistically significant differences in the responses from the UK compared with NZ relating to whether imprecision, accuracy, patient comparison, linearity and AMR/CRR were performed and whether the testing did or did not meet the acceptance criteria.
The project was approved by the Faculty of Science Human Low Risk Ethics Committee at Charles Sturt University, Bathurst, NSW, Australia. The protocol number issued with respect to this study is 400/2017/11.
Results
The response rate (number of responders as a proportion of those surveyed) from the ACB (UK) was 38/352 (11.1%) and NZIMLS (NZ) 54/1711 (3.2%). The total number of responses to the survey was 92. The department/specialty of the responders together with their job role/title is shown in the Supplemental Figures A and B.
Seventy-two of 92 (78%) of responders indicated that laboratory instrumentation (rather than POC) had been verified in the last five years. Table 1a shows the responses that were obtained in respect to whether the verification of imprecision, accuracy, patient comparison, linearity and analytical measuring range/clinical reportable range was performed or not.
Elements of verification employed, acceptance criteria, and verification findings.
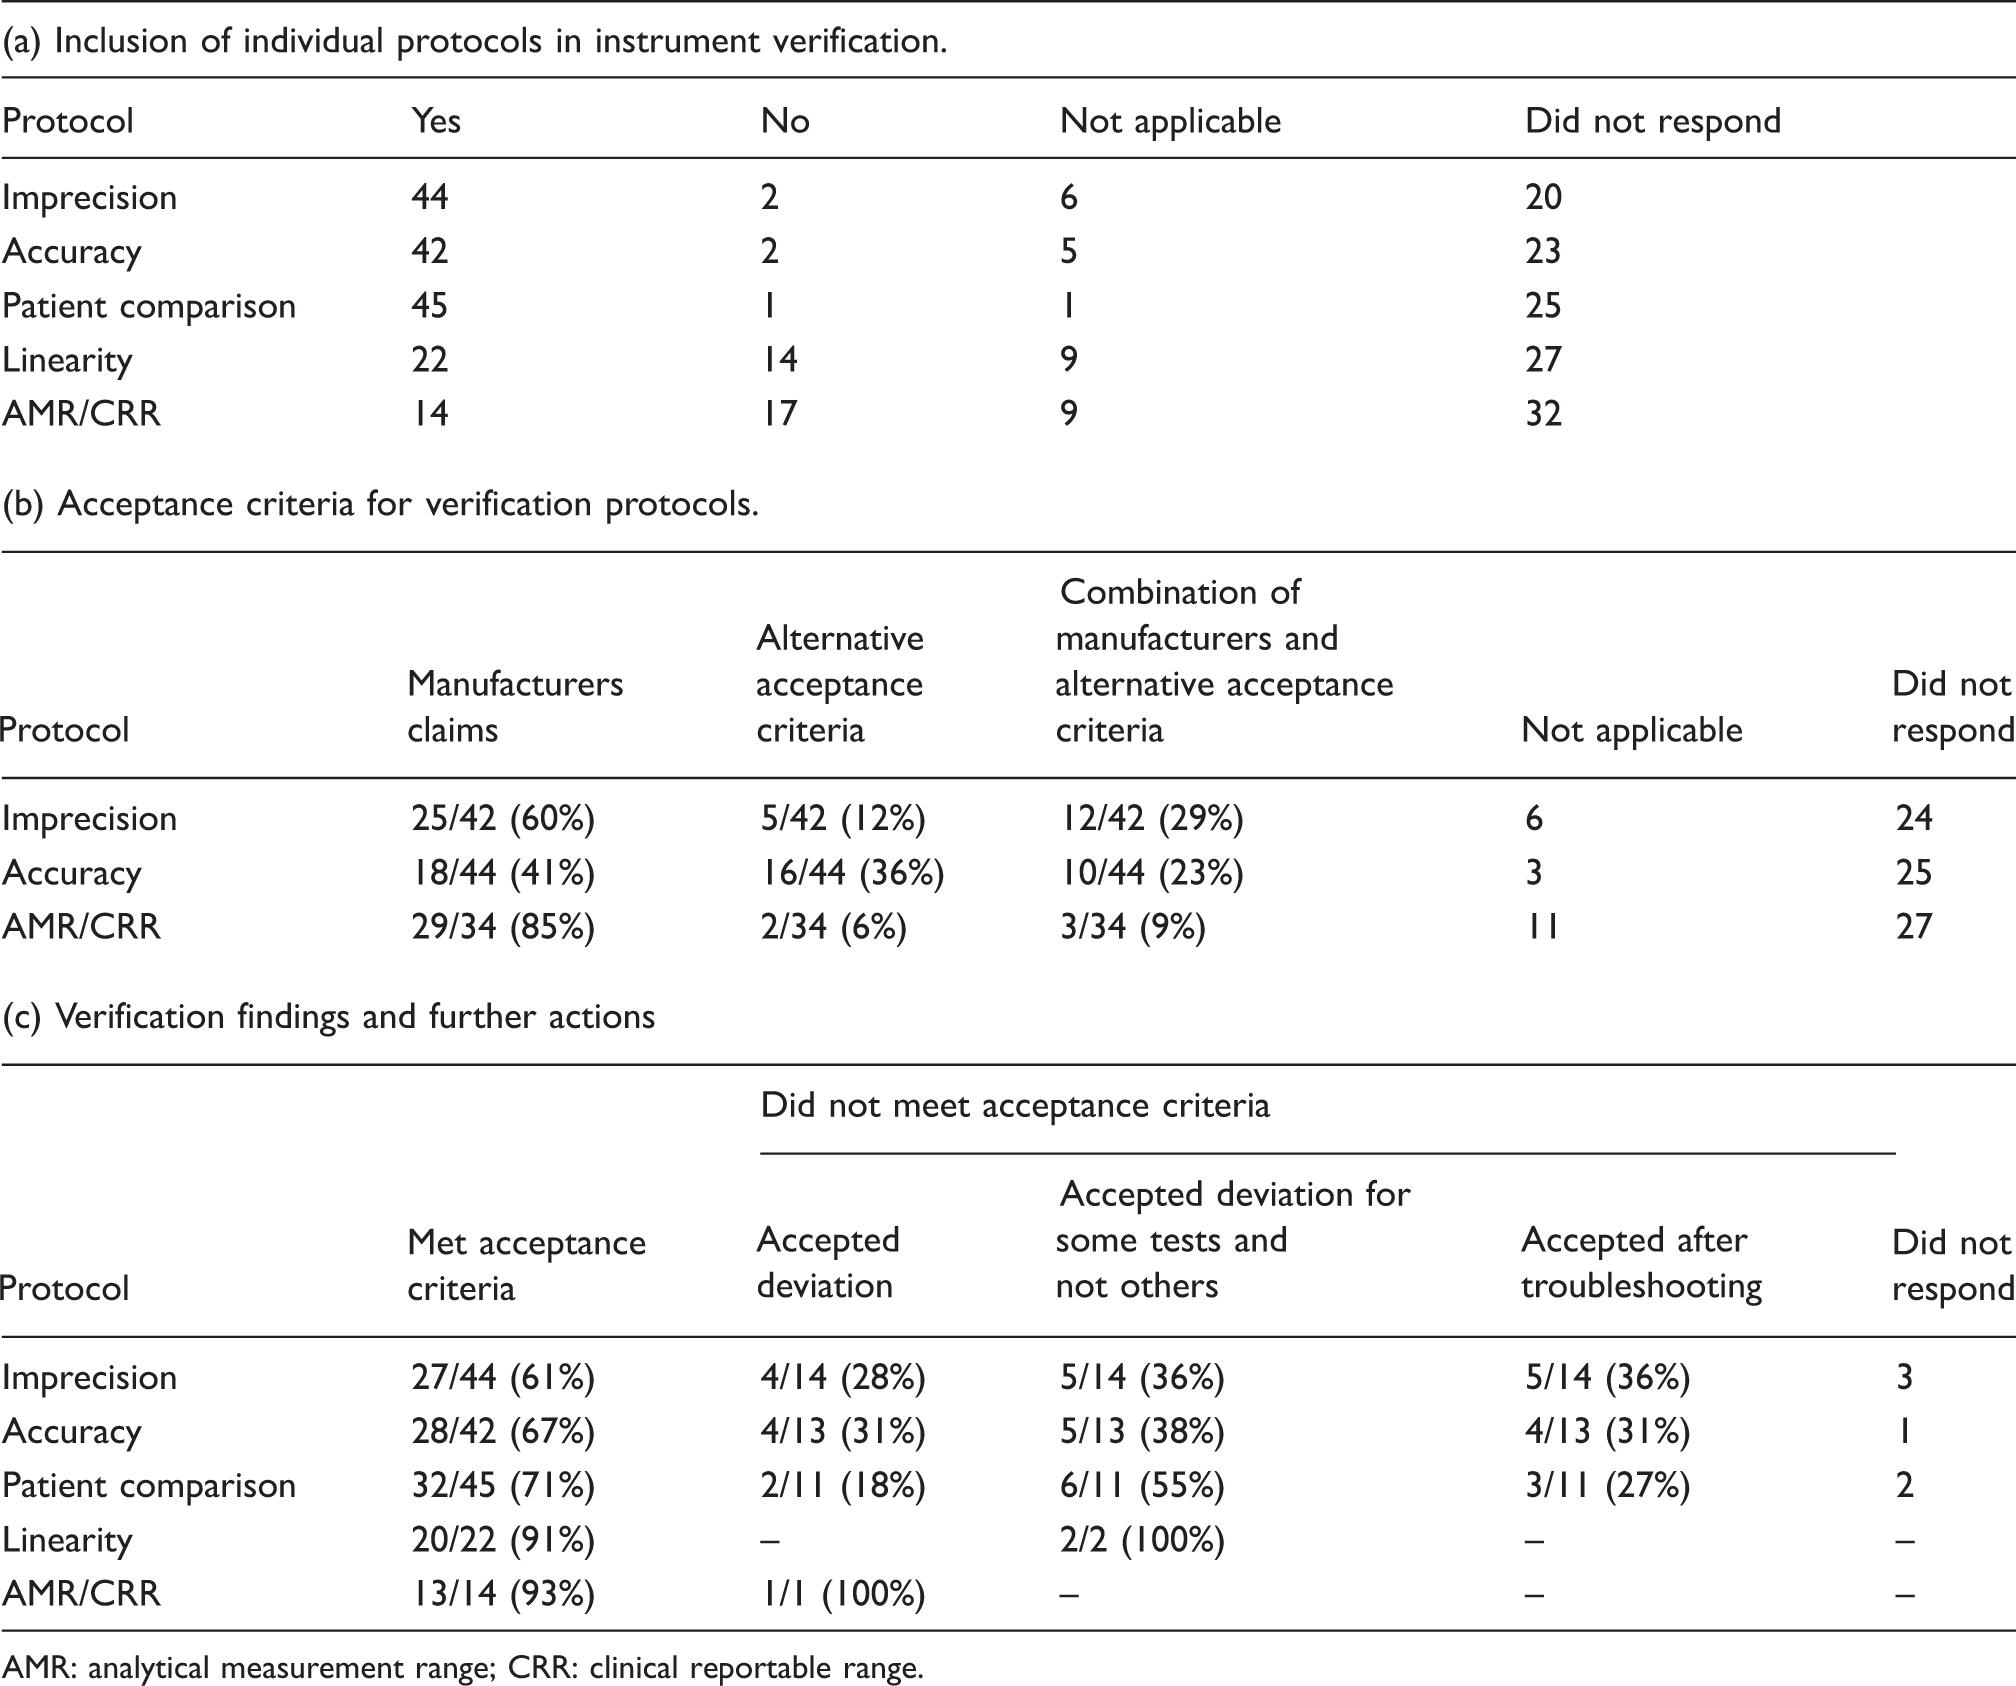
AMR: analytical measurement range; CRR: clinical reportable range.
Protocol followed when performing verification
Nineteen of 72 (26%) of responders indicated that the organization used their own protocols for measuring system (instrument) verification; 16/72 (22%) stated their protocol used a combination of the organization’s together with those from the CLSI, ACB, ISO and others (Figure 1); 2/72 (3%) of responders stated that the CLSI guidelines alone were used and 8/72 (11%) of responders stated that the ACB guidelines were the sole basis for their protocol; 5/72 (7%) specified that the ISO standard was used as a basis for their protocol. One indicated they used ACB and CLSI together and one used ACB with ISO; 3/72 (4%) stated they followed other guidelines, for example International Council for Standardization in Haematology, or those of the instrument manufacturer itself. Seventeen did not respond to the question.
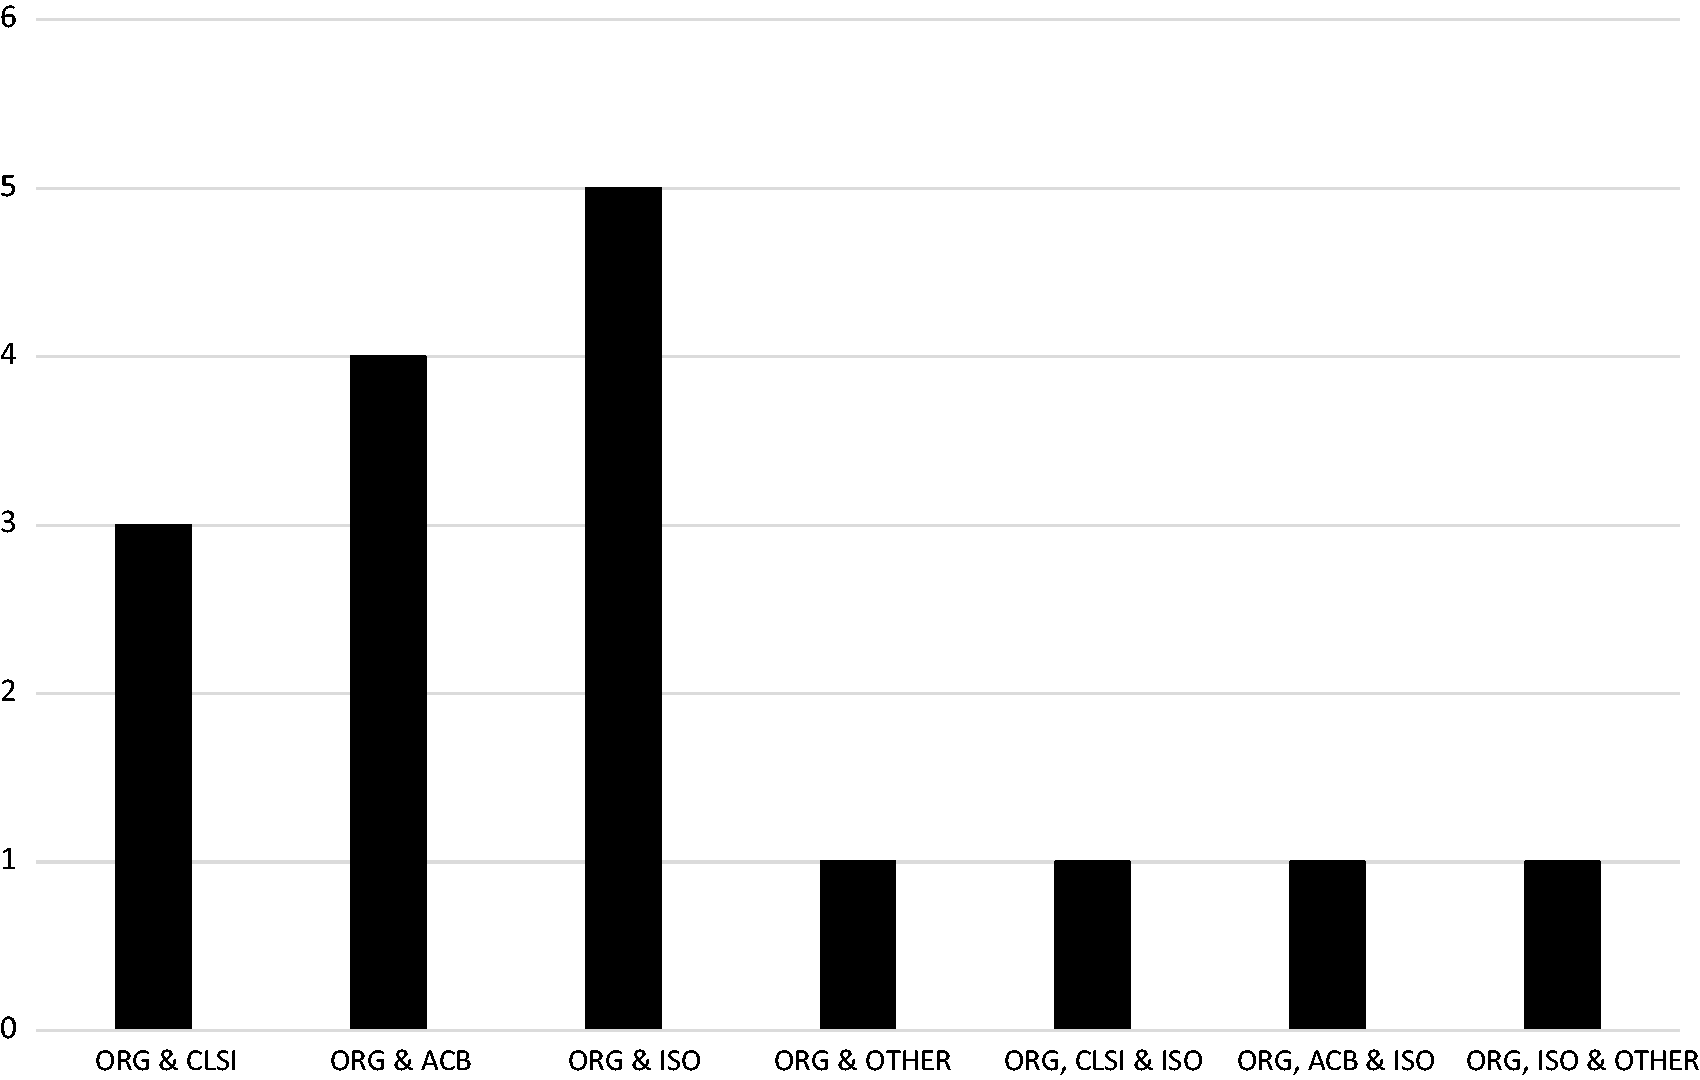
Main source of guidelines combined with organization own developed protocols.
Table 1a shows which verification elements (imprecision, accuracy, patient comparison, linearity and AMR/CRR) were included in the full verification process. Of those that answered ‘no’ or ‘not applicable’ to the question on imprecision, the main reason related to using a non-numerical rather than a quantitative test. The group of responders who answered ‘no’ or ‘not applicable’ to the accuracy question was because the instrument was from a histopathology department.
The acceptance criteria used for imprecision, accuracy and AMR/CRR are shown in Table 1b. Curiously, there were more responders to this question in respect of accuracy and AMR/CRR than said they performed these elements as part of the verification process. Manufacturers’ acceptance criteria were easily obtained by 47/72 (65%). The correlation coefficient was the predominant acceptance criterion for linearity assessment, used by 13/22 (59%) of responders; 8/22 (36%) of responders stated that they used an alternative option, for example manufacturers claims or CLSI guidelines; 1/22 (5%) did not respond to the question.
Twenty-seven of 44 (61%) of responders stated that the imprecision findings met their predefined acceptance criteria, which suggests that 17/44 (39%) did not (Table 1c). Of those 17, 14 stated how they addressed failing to meet the acceptance criteria (Table 1c). For accuracy, patient comparison, linearity and AMR/CRR. Table 1c details how the failures in meeting their acceptance criteria would be addressed.
Forty-two of 72 responders (58%) answered the question relating to how accuracy was assessed. External Quality Assurance material was the most widely used method for assessing accuracy, with 36/42 (86%) responding it was either used on its own or in combination with internal quality control (IQC) material, calibration material, or with an alternative option as shown in Figure 2. For the remaining responders, 2/42 (5%) stated IQC was used on its own or in combination with calibration and an alternative option; 2/42 (5%) stated they used patient samples to assess accuracy, with the remainder stating calibration material as the sample of choice.
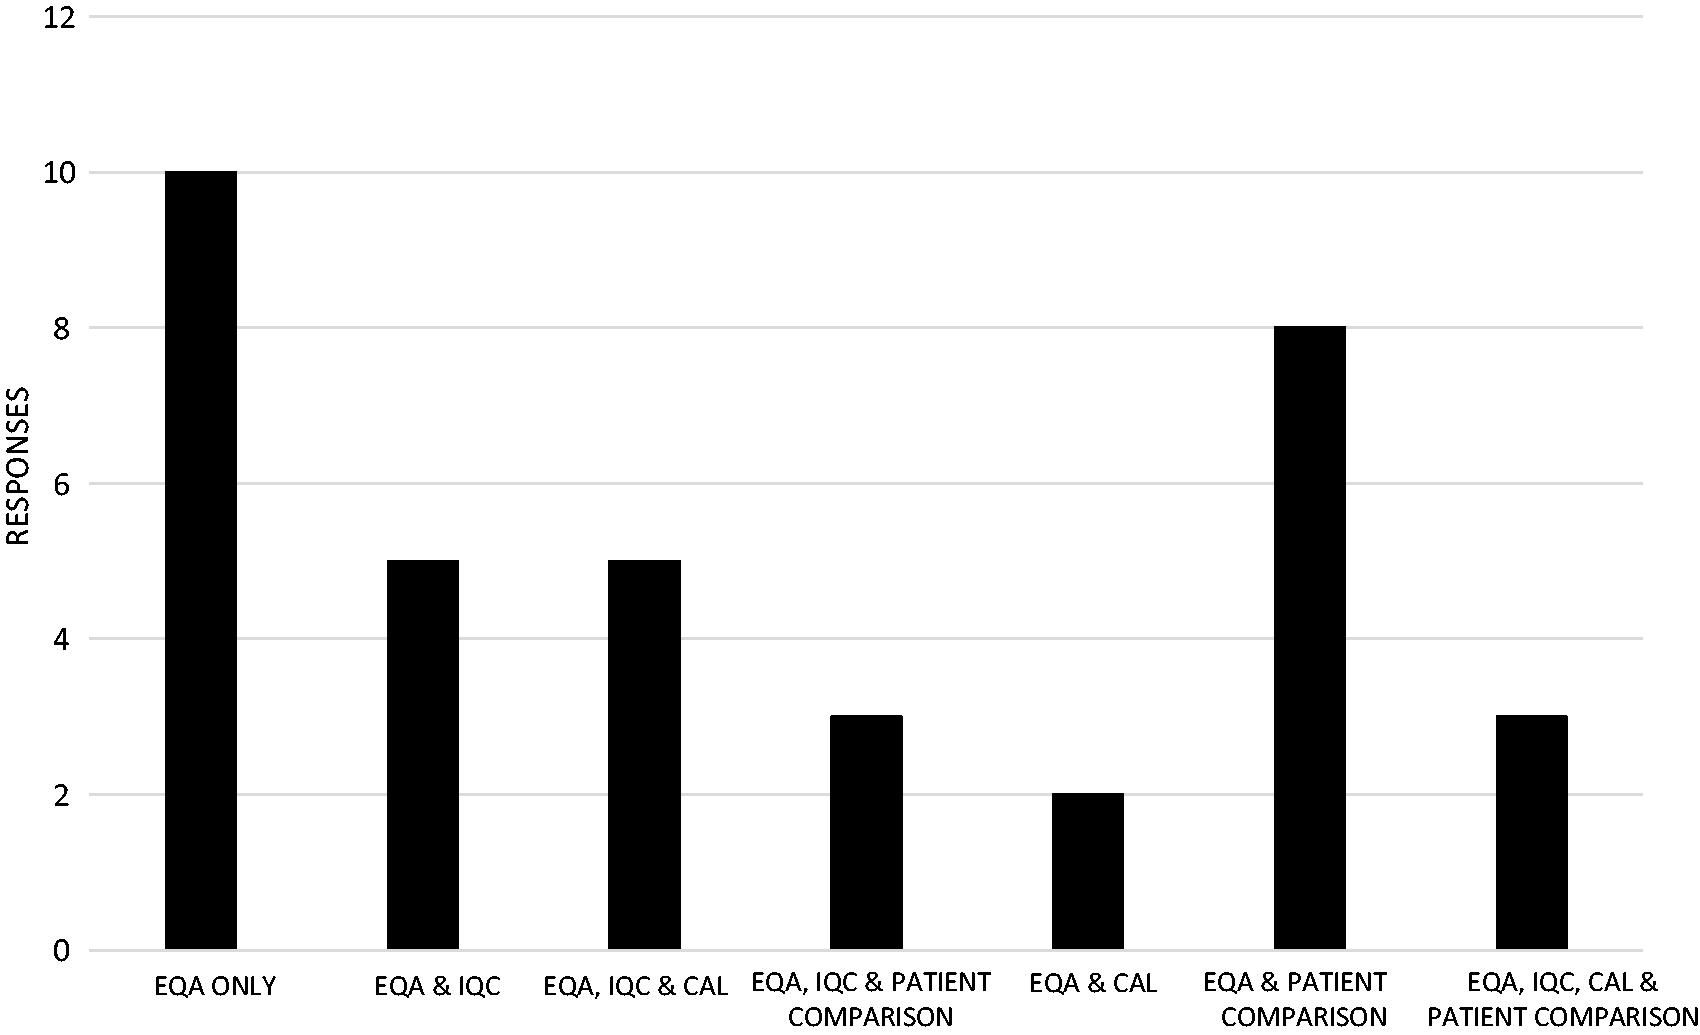
Accuracy testing using EQA samples with or without alternatives.
The mode for the number of patient samples used for comparison testing was 50 with a median of 40 (interquartile range was 20.4–50). The minimum number of samples was 2 (an example given of ammonia) and the maximum number of samples was 1000 as represented in Figure 3. Most responders stated a single number such as 50, while some responders stated a range of values for the number of samples used, for example 20–40. In the latter case, both values are quoted in Figure 3.
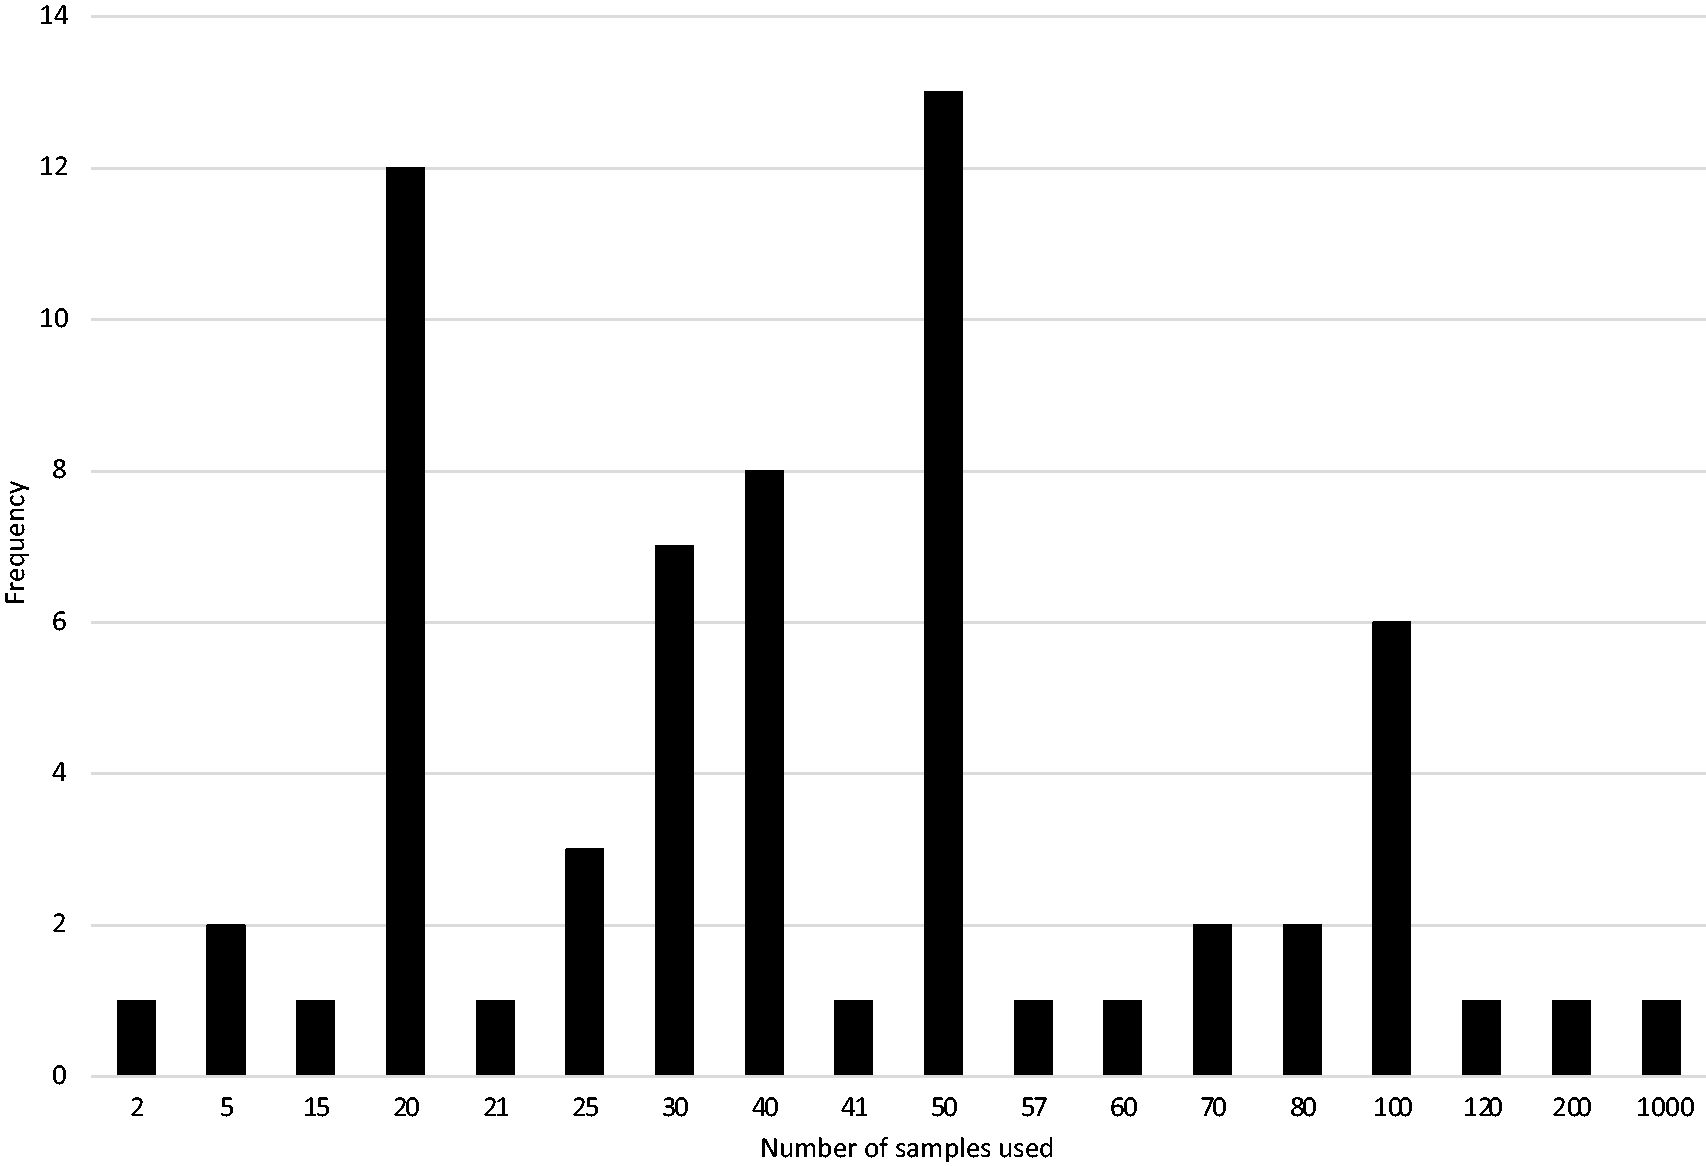
Number of samples used in patient comparison testing.
International comparison
There was no statistical difference in the proportion of responders who performed imprecision, accuracy, patient comparison, linearity or AMR/CRR testing between the UK and NZ (Table 2a). However, there was a significant statistical difference between the UK and NZ responders in respect of the proportion whose imprecision failed to meet the acceptance criteria (Table 2b). There was no statistical difference observed for any of the other verification protocols between the UK and NZ responders.
UK and NZ responses to individual verification elements used and failing predefined acceptance criteria.
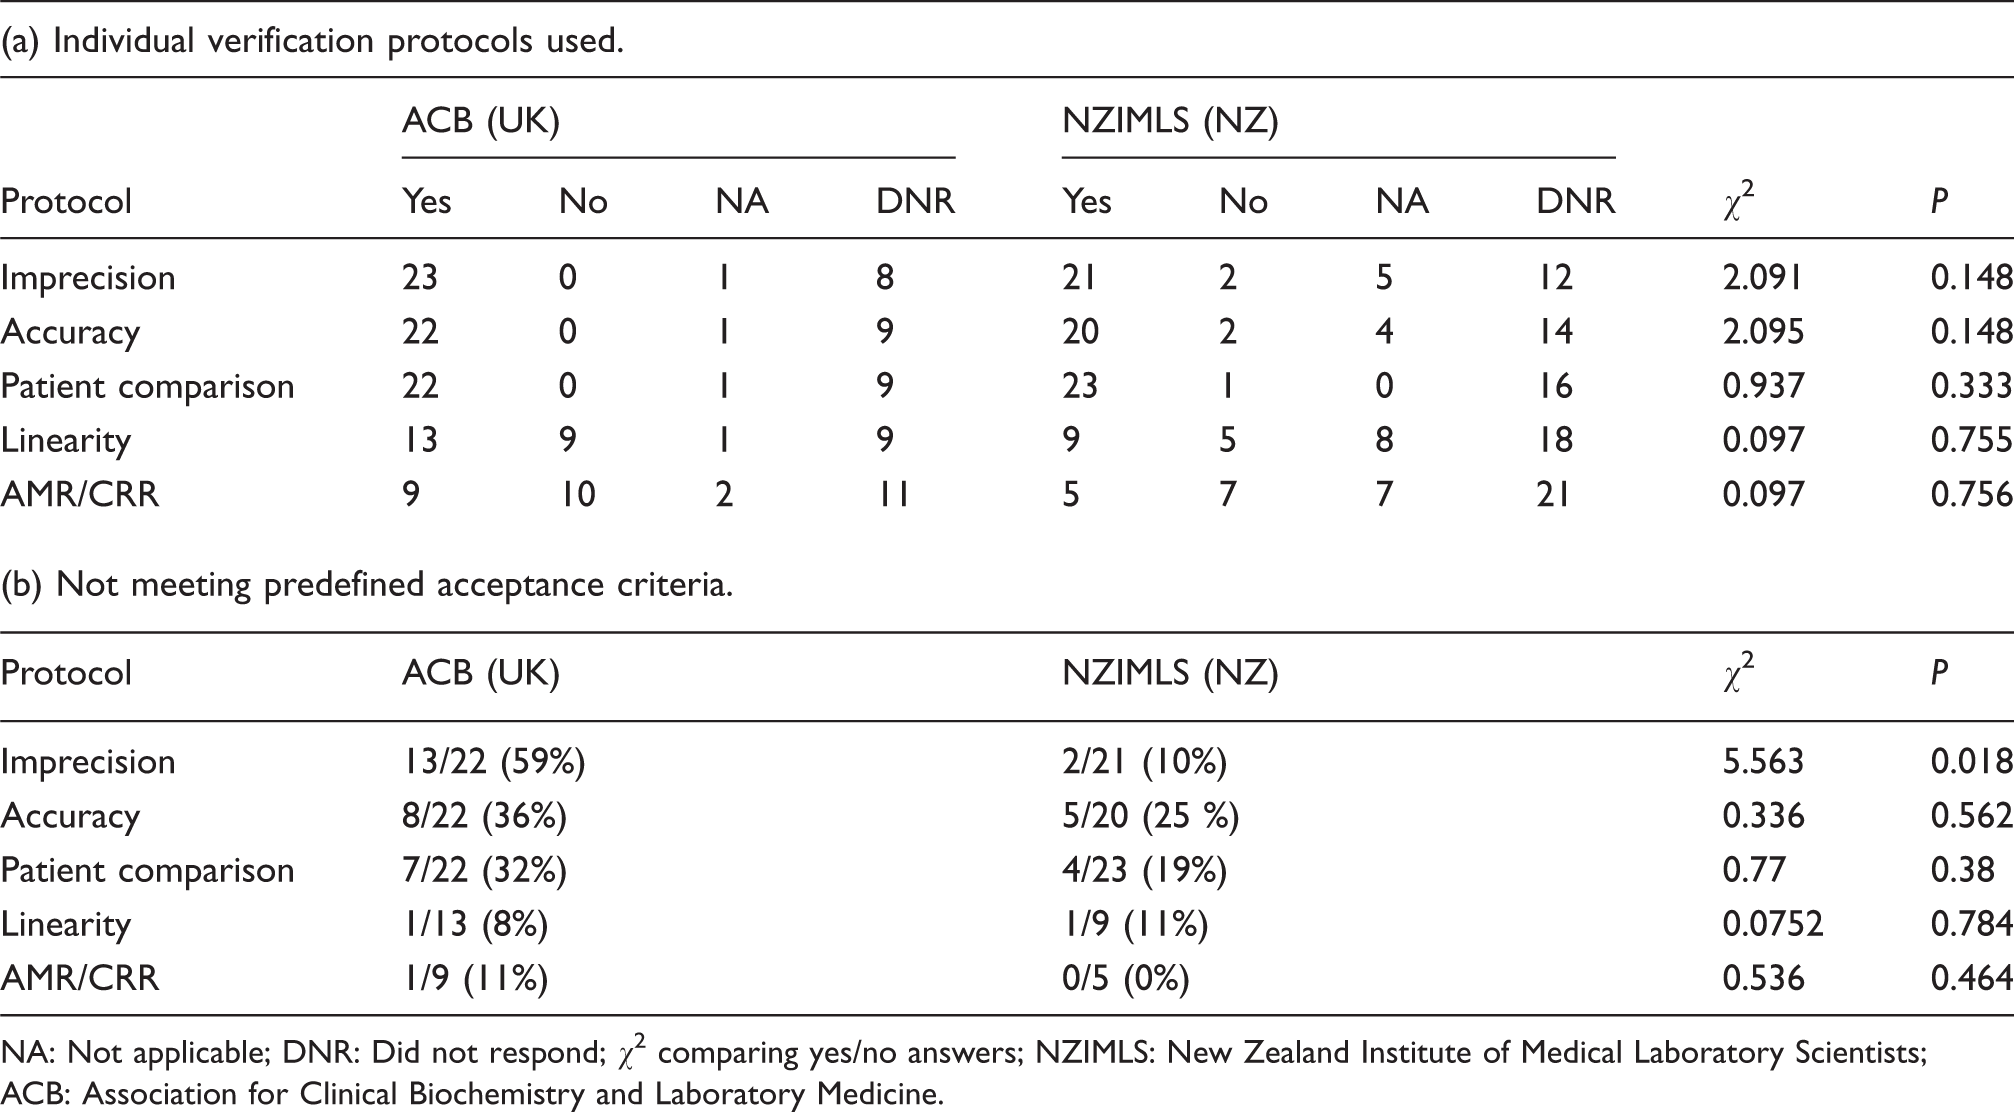
NA: Not applicable; DNR: Did not respond; χ2 comparing yes/no answers; NZIMLS: New Zealand Institute of Medical Laboratory Scientists; ACB: Association for Clinical Biochemistry and Laboratory Medicine.
Concurrent failures of verification elements
To help establish if an instrument which failed one element of verification was more likely to fail another element, 39/72 (54%) of responders who fully answered the imprecision, accuracy and patient comparison sections of the questionnaire were examined in more detail. The Euler’s diagram (Figure 4) demonstrates the number of responders who identified results that deviated from their predefined acceptance criteria for each of these verification assessments.
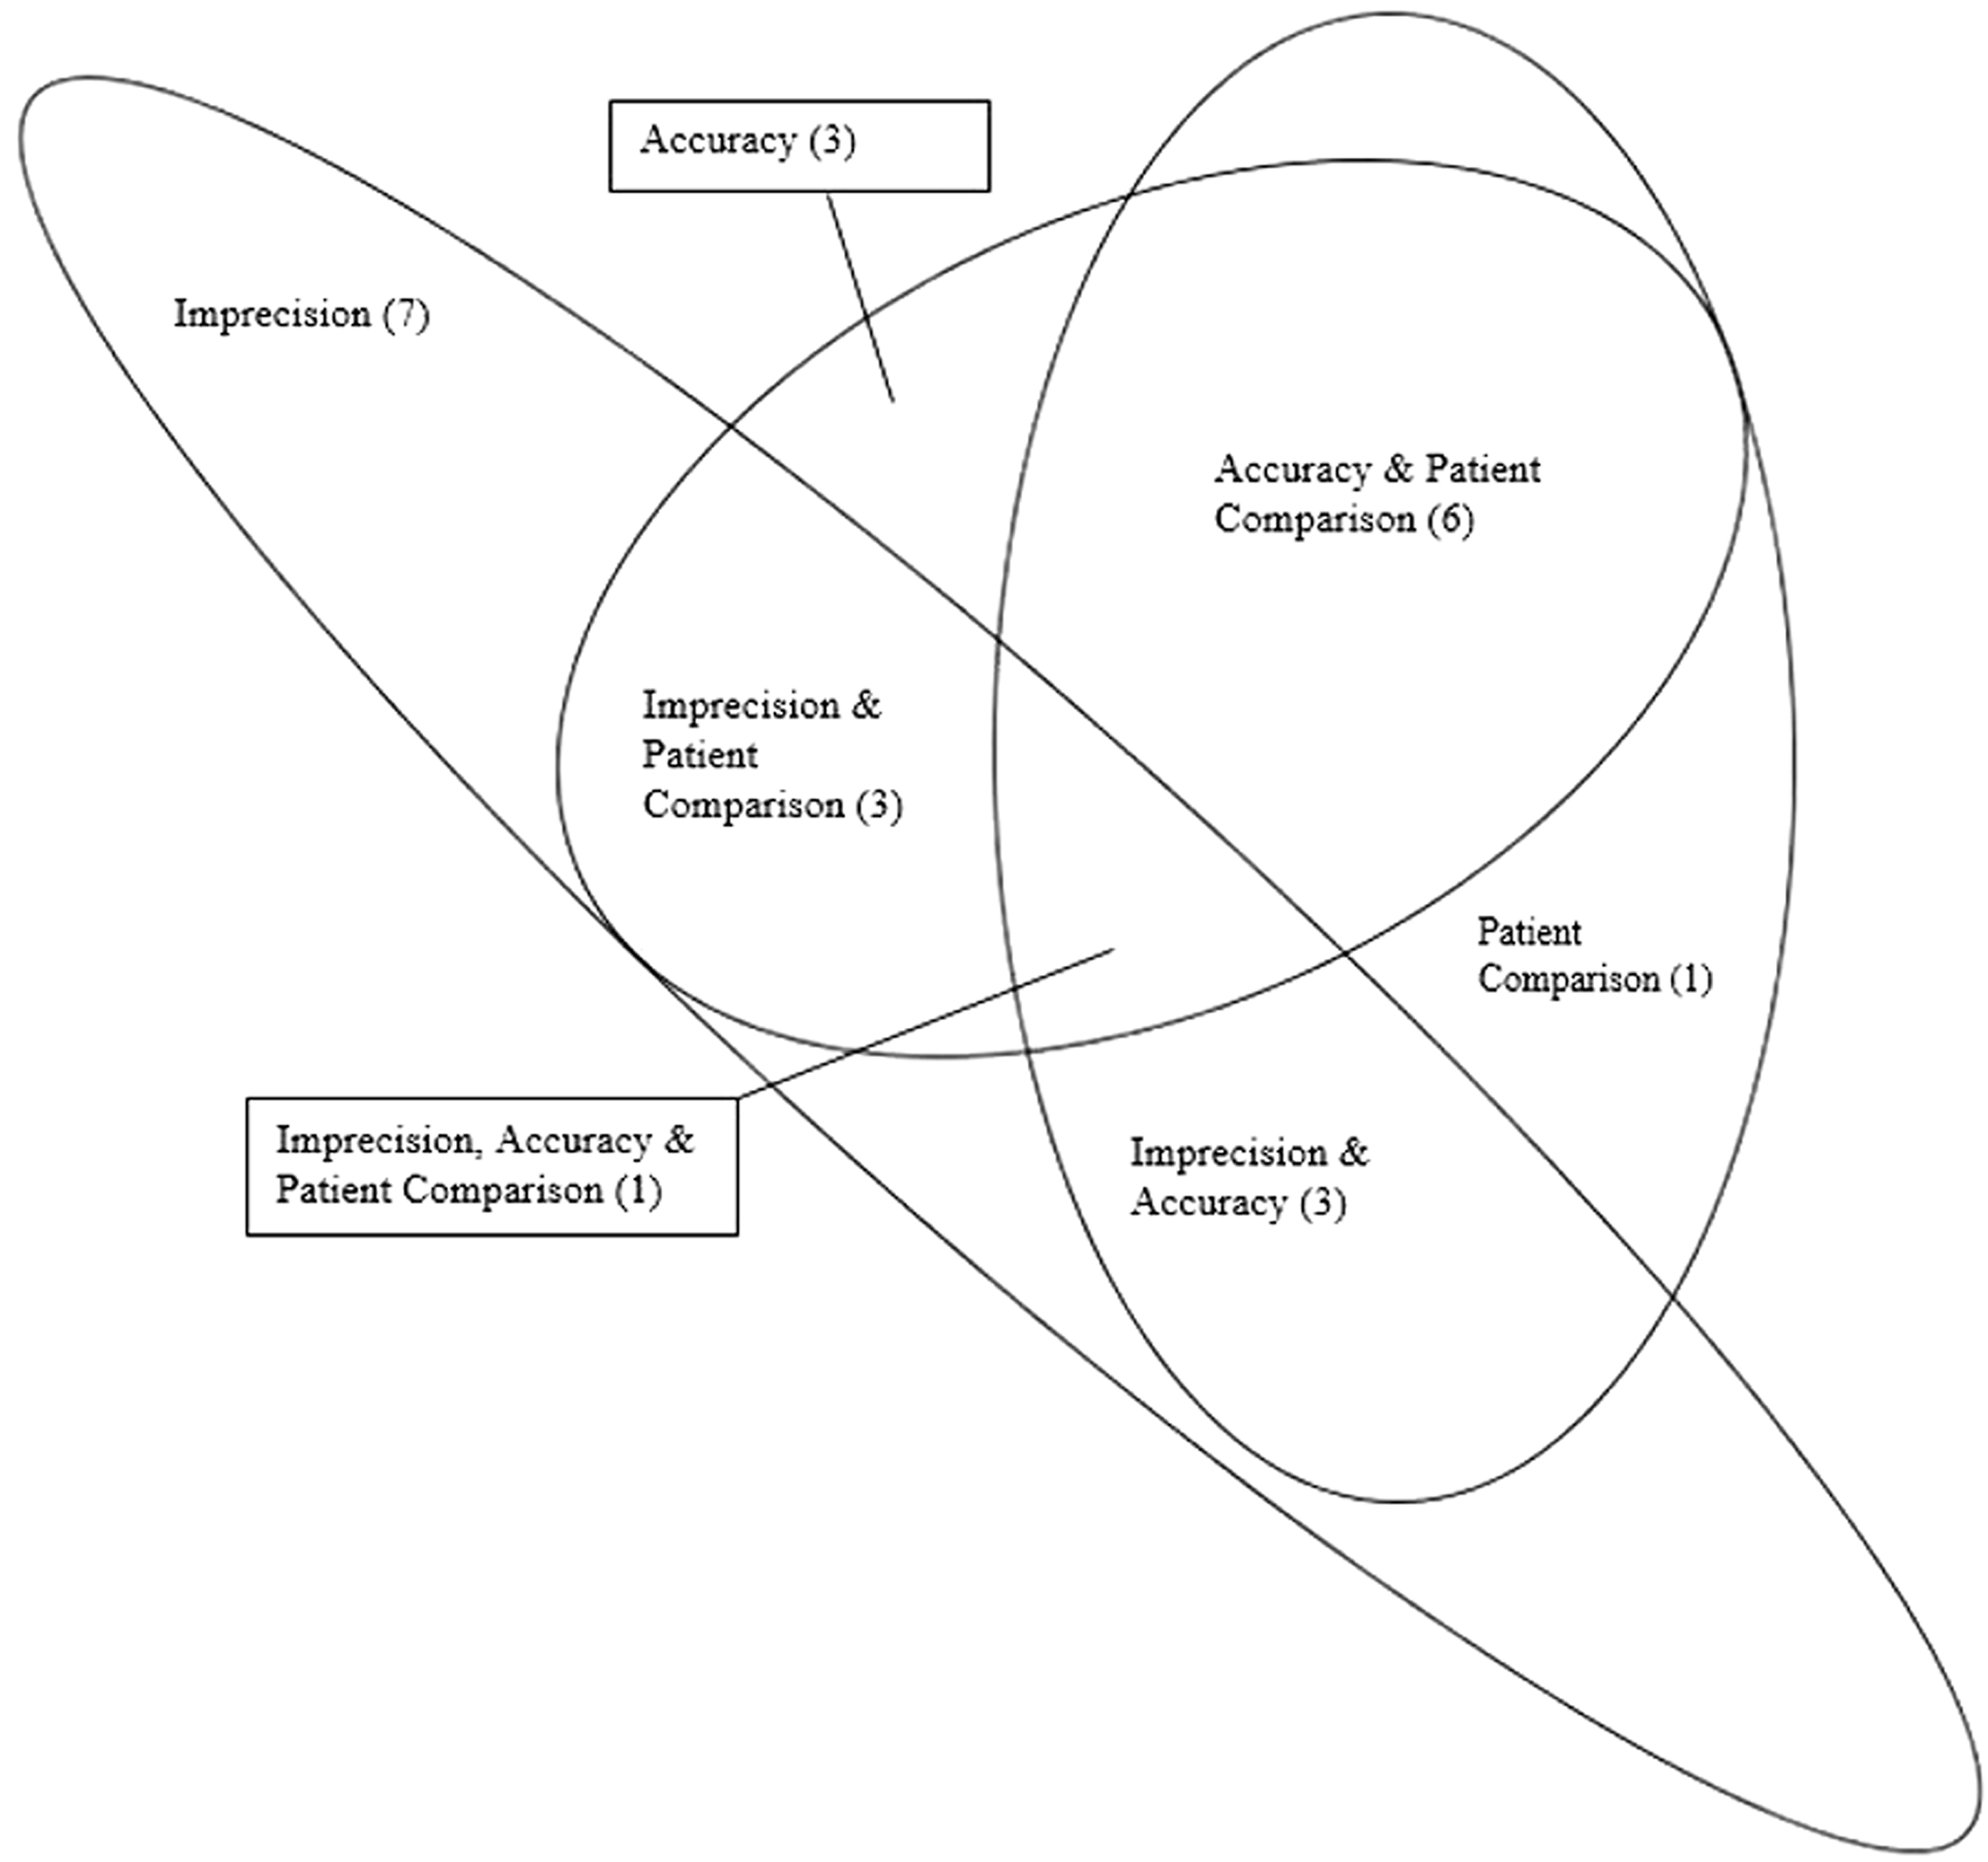
Euler Diagram – results that did not met the acceptance criteria.
Discussion
This study provides the first evidence of the protocols routinely used in clinical laboratories for measuring system (instrument) verification, the source for their acceptance criteria, whether these were being met and, if not, the actions taken.
In respect of the protocols used, of those who answered this question, the majority of responders (64%) have indicated that they are following guidelines that have at least been partly generated from within their own laboratory rather than just following national or international guidelines. The reason(s) why local protocols are so popular remains speculative. There may be historic reasons, for example the verification plan that was used for the new laboratory instrument was based on an existing device. There may also be financial reasons for using a local plan. For example, while ACB verification recommendations are openly accessible to laboratory staff, CLSI require laboratories to pay for access to the relevant verification guidelines. Curiously, five responders were using ISO for verification even though that organization does not provide specific recommendations on how this should be performed.
There were some other anomalies. This includes 2/12 (17%) responders stating they used ACB guidelines for linearity when the document states that this is not a requirement for verification. 5 In a similar vein, International Accreditation New Zealand (IANZ) standards mandate that linearity testing need only be conducted for new methods/procedures being validated but not for verification, 19 yet 24% of NZ responders indicated the testing was performed.
CLSI’s guidelines, EP15-A2 (User Verification of Performance for Precision and Trueness) 7 and CLSI’s EP09 (Method Comparison and Bias Estimation using Patient Samples) 19 recommend that a minimum of 20 and 40 patient samples, respectively, should be used to assess the bias between the new instrument and comparator instruments. The ACB recommends that at least 20 patient samples should be used. 5 It would seem that these recommendations are being largely followed with a median of 40 samples being used and a mode of 50. Perhaps understandably, fewer samples were used when patient samples were rare or the analyte was unstable.
This study also investigated the verification acceptance criteria used by the laboratories. Manufacturers’ claims comprised at least part of these criteria in the assessment of imprecision (89%), accuracy (64%) and AMR/CRR (94%). However, these high percentages appear despite manufacturer’s criteria only being easily obtainable by 47/72 (65%) of responders.
For each of the verification elements of imprecision, accuracy and AMR, there were a number of responders (12%, 36% and 6%, respectively) who indicated that their acceptance criteria were different with that from the manufacturer. It is not known from the survey what sources of information were used to decide these alternative acceptance criteria.
It was not uncommon to fail verification with the most common reasons being a failure in the assessment of imprecision (39%) followed by accuracy (33%), patient comparison (29%), linearity (9%) and AMR/CRR (7%). It is possible this rank order is influenced by the fact that manufacturers’ claims were usually adhered to for some verification elements such as imprecision, but not for others, such as patient comparison.
Of those that performed linearity testing, over 90% of responders indicated that the testing met the acceptance criteria, with 13/22 (59%) of responders using the correlation coefficient as the acceptance criterion. This supports the ACB recommendation that linearity is not a requirement of the verification process for laboratory instrumentation and questions whether the testing for linearity and AMR/CRR adds any value either. 5 Notwithstanding this, accreditation organizations, for example IANZ and CAP, require this testing should be conduct for all new methods/procedures to be used within laboratories.16,19,20
As shown in Figure 4, there is no clear indication that when one element of the verification testing fails to meet the acceptance criteria (for example, imprecision), that this may make it any more likely that another element will fail (for example, accuracy).
The international comparison of data between the UK and NZ was remarkably similar except that imprecision testing was more likely to fail in the UK (57%) than in NZ (10%). Although the reason(s) for this are not clear, it does not appear associated with the two countries using different acceptance criteria.
The survey’s last questions investigated laboratories’ response should one or more elements of the verification protocol fail. It was notable that when one or more verification components failed, it was most common to accept the deviation, with only a minority accepting tests after troubleshooting. However, the number of responders were small, and the survey did not establish whether the deviations were only accepted if they were small rather than clinically significant (Table 1c).
There were several limitations to this study. The most important is the low response rate from both countries, with the UK being 11.1% and NZ 3.2% of those surveyed. It is possible that this simply reflects the small proportion of laboratories which had performed verification in the last five years, or it may be a reflection of the lack of time made available to the respective laboratory professionals to gather the data required to complete the survey. Whatever the reason, it seems unlikely that survey responders were less organized regarding verification routines than those who did not respond. Another limitation was that not all the questions in the questionnaire were answered by each responder, which made interpretation difficult when, for example, not all elements of verification were known to have passed or failed. As already mentioned, if an element failed the acceptance criteria, we do not know the magnitude of the failure. Lastly, there is an argument that more elements of verification, such as establishing limits of quantitation, could have been enquired about.
In conclusion, laboratories in the UK and NZ are currently using a variety of verification protocols and acceptance criteria for instrument verification. It is common for instruments to fail, especially following the assessment of imprecision and accuracy. While this suggests the process is warranted, only a minority address failed elements before accepting verification. The study therefore raises questions as to whether there should be a more standardized approach to this activity and that failure following verification should be dealt with in a more uniform way.
Footnotes
Acknowledgements
Our thanks to the Association for Clinical Biochemistry and Laboratory Medicine National Audit Group and the New Zealand Institute of Medical Laboratory Science for circulating the questionnaire among their members.
Declaration of conflicting interests
The author(s) declare no potential conflicts of interest with respect to the research, authorship, and/or publication of this article.
Funding
The author(s) received no financial support for research, authorship, and/or publication of this article.
Ethical approval
The survey was approved by the Faculty of Science Human Low Risk Ethics Committee at Charles Sturt University, Bathurst, NSW, Australia (Reference # 400/2017/11).
Guarantor
MH.
Contributorship
MH, ESK and AC conceived the study and its design. AT facilitated the circulation of the questionnaire. MH performed the data analysis and wrote the paper with amendments from all other authors.