
Abstract
Background
The primary hyperoxalurias are inherited disorders of glyoxylate metabolism that lead to overproduction of oxalate, urolithiasis and renal failure. Delays in diagnosis can be costly in terms of preserving renal function. Here we present a rapid liquid chromatography tandem mass-spectrometry screening method for the analysis of metabolites (primary hyperoxaluria metabolites) produced in excess by primary hyperoxaluria patients that include glycolate, glycerate and 2,4-dihydroxyglutarate.
Methods
Assay performance was compared to our existing gas chromatography–mass spectrometry method and clinical utility established by analysis of urine samples from patients with confirmed primary hyperoxalurias (11 PH1, 12 PH2 and 8 PH3) and controls (n = 12). An additional 67 urine samples from patients with PH3 were used postvalidation to confirm the derived 2,4-dihydroxyglutarate cut-off.
Results
Glycolate, glycerate and 2,4-dihydroxyglutarate showed a mean bias of 3.3, −22.8 and 5.7%, respectively, compared to our previously published gas chromatography–mass spectrometry method. The mean total imprecision for glycolate, glycerate and 2,4-dihydroxyglutarate was shown to be 6.4, 10 and 11%, respectively. Clinical assessment confirmed that mean urinary glycolate, glycerate and 2,4-dihydroxyglutarate excretion were significantly elevated in patients with PH1, PH2 and PH3, respectively. The greatest sensitivity and specificity for PH1, PH2 and PH3 was achieved at cut-offs of 193, 100 and 4.9 μmol/mmol for glycolate, glycerate and 2,4-dihydroxyglutarate, respectively.
Conclusions
A rapid screening method for the identification and differentiation of patients with suspected PH1, PH2 and PH3 is presented that allows focussing of genetic testing, saving time, money and, with earlier treatment, potential preservation of renal function for these patients.
Keywords
Introduction
The primary hyperoxalurias (PHs) are rare inherited metabolic disorders of hydroxyproline and glyoxylate metabolism leading to excess production of oxalate and thus hyperoxaluria, a well-recognized risk factor for renal calculus formation.
1
There are at least three distinct forms, namely PH1, PH2 and PH3 (for a review, see Cochat and Rumsby
2
) (Figure 1). PH1 (Online Mendelian Inheritance in Man [OMIM] #259900) is caused by a deficiency of the peroxisomal enzyme alanine:glyoxylate aminotransferase (AGT), encoded by AGXT, which catalyses the conversion of glyoxylate to glycine. Deficiency of AGT leads to a build-up of glyoxylate, which is converted to oxalate by lactate dehydrogenase (LDH) and to glycolate by glyoxylate reductase (GR). PH2 (OMIM 260000) is caused by mutations in GRHPR, which encodes GR, an enzyme with both glyoxylate and hydroxypyruvate reductase activities and deficiency thus leads to accumulation of both substrates. LDH converts the excess substrates to oxalate and
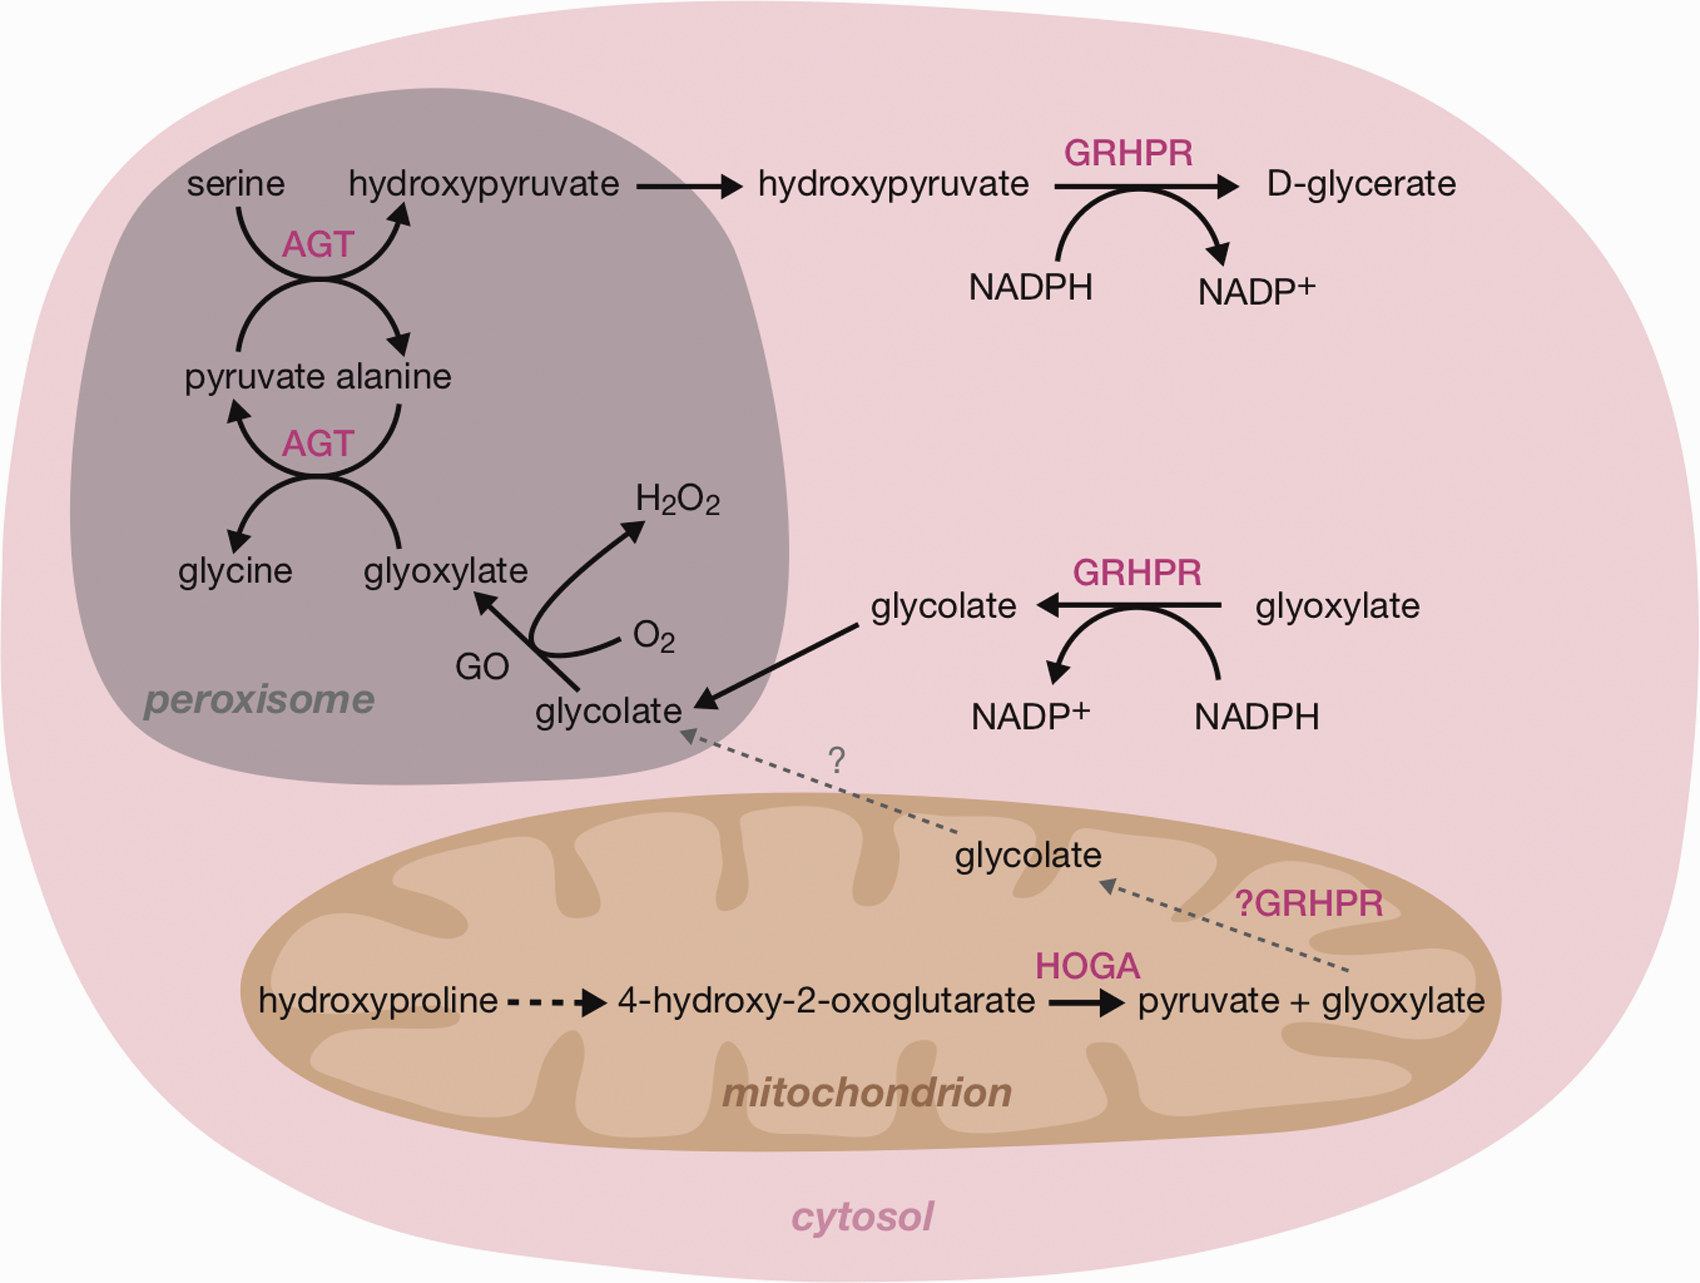
Glyoxylate and hydroxyproline metabolism in the hepatocyte. Deficiencies of AGT, GRHPR and HOGA cause PH1, PH2 and PH3, respectively. In PH1 and PH2, the excess glyoxylate is converted to oxalate by LDH. The source of oxalate in PH3 is as yet unclear. AGT: alanine:glyoxylate aminotransferase; GO: glycolate oxidase; GRHPR: glyoxylate/hydroxypyruvate reductase; HOGA: 4-hydroxy-2-oxoglutarate aldolase; NADPH: nicotinamide adenine dinucleotide phosphate (reduced).
The first-line test for PH is urine oxalate in patients with normal renal function. 7 However, this test is not diagnostic given the more common secondary causes relating to exogenous oxalate, either from increased dietary intake or due to fat malabsorption. 8 Definitive diagnosis of PH requires gene sequencing or enzyme activity analysis in a liver biopsy but analysis of the metabolites, glycolate, glycerate, HOG and DHG, can help to make a provisional diagnosis and thus focus genetic testing. From earlier studies in our laboratory, 5 HOG was found to be unstable, dependent on uncontrollable preanalytical factors such that in some cases false negative results were found; DHG alone is therefore now our preferred metabolic marker for PH3. Simultaneous analysis of these metabolites is currently only available by GC–MS analysis, which is complex, requiring derivatization.3,5 A rapid screening method for the analysis of primary hyperoxaluria metabolites (PHMs), i.e. glycolate, glycerate and DHG, would be invaluable in a diagnostic programme and would also open up the possibility of screening for these conditions in a wider cohort of individuals to assess the true incidence in patients with renal stones.
The aims of this study were to set up a rapid liquid chromatography tandem mass-spectrometry (LC–MS/MS) method for the quantification of the PHM, glycolate, glycerate and DHG and to assess its clinical utility for the diagnosis and differentiation of the three known forms of PH.
Materials and methods
Patients’ samples and collection
For assay validation, urine samples collected during routine clinical practice from patients with suspected PH (later confirmed by genetic testing; 11 PH1, 12 PH2 and 8 PH3), and controls (n = 12, with no biochemical indications of renal pathology) were analysed for PHM by both GC–MS and LC–MS/MS methods. Since urine oxalate analysis, in addition to PHMs, was typically requested on these samples the urines were either aliquots from 24 h collections (acidified) or random samples acidified on receipt with HCl, to pH <2. Confirmation of the utility of DHG in the diagnosis of PH3 was assessed on 67 urines from PH3 patients collected during routine follow-up at the Division of Paediatric Nephrology, University Children’s Hospital, Bonn, Germany. DHG results from our assay were compared with those for HOG analysed by University Children’s Hospital as previously described. 9
Effect of thymol preservative
Since some clinical laboratories receive 24 h urine samples containing thymol, the effect of this preservative on the analysis of PH metabolites was preliminarily assessed. In brief, 0.06% w/v thymol was added to 10 urine samples (representing an addition of 3 ml 10% w/v thymol per 24 h urine collection containing 500 ml urine, a plausibly concentrated urine sample). The samples in the presence and absence of thymol were quantified by the LC–MS/MS methods and the paired results compared using a paired Student’s t-test.
Preparation of calibrators
Glycolate (glycolic acid >99%) and glycerate (
Sample preparation
Sample preparation for LC–MS/MS analysis of glycolate, glycerate and DHG was minimal. A 1:1 dilution was performed on patients’ urine samples with aqueous internal standard (glycolate-D2) followed by microfiltration (Amicon® Ultra Centrifugal Filters 10k).
Chromatography
The filtrate was injected onto the LC–MS/MS system that consisted of a Shimadzu Nexera X2 LC coupled to a Shimadzu 8060 tandem MS/MS. Retention of these polar analytes was achieved on a Phenomenex Luna-Omega column (100 mm × 2.1 mm; 1.6 μm). Mobile phase A consisted of deionized water and elution was achieved with increasing concentrations of mobile phase B (0.5% formic acid in methanol). The flow rate was at 0.35 ml/min with an elution gradient of 1% B at 0 min, rising to 80% B at 1.3 min that was maintained for an additional 2 min.
Mass spectrometry
The mass spectrometer used electrospray ionization in negative ion mode. MS/MS parameters were as follows: nebulizing gas flow 3 L/min, drying gas flow 10 L/min, heating gas flow 10 L/min, heating block temperature was 300°C and desolvation line temperature 150°C. All transitions were monitored in multiple reaction monitoring (MRM) mode with a dwell time of 14 ms and event time of 34 ms. Quantification and qualification ions are shown in Table 1.
MRM transitions for the quantitation and qualification of PHM.
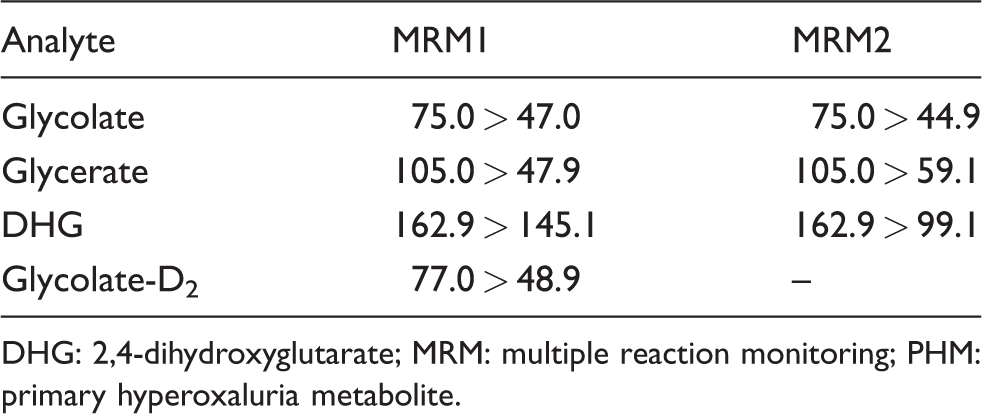
DHG: 2,4-dihydroxyglutarate; MRM: multiple reaction monitoring; PHM: primary hyperoxaluria metabolite.
Validation
To assess the limit of detection (LOD) and lower limit of quantification (LLOQ), low levels of analyte (150–50 μM glycolate, 30–5 μM glycerate and 10–1 μM DHG) were analysed as five replicates on sequential days and their CV calculated. LOD was defined as the lowest concentration of analyte that could be distinguished from zero but with a CV >20% and signal-to-noise greater than 3 but less than 10. LLOQ was defined as the lowest level with a CV <20%.
Accuracy
Results for glycolate, glycerate and DHG by both GC–MS and LC–MS/MS were compared by Deming regression. This method was used as an indication of bias between the two methods but may not reflect ground-truth given the lack of a ‘gold-standard’ method for the analysis of these metabolites. Recovery studies were used as a measure of accuracy.
Imprecision
Two samples with differing analyte concentrations were quantified daily in replicate (n = 4 serial injections) over a one-week period (n = 5) to assess inter- and intra-assay (between group degrees of freedom = 4 and within group degrees of freedom = 15) imprecision as CV (374 and 696 μmol/L glycolate, 64 and 292 μmol/L glycerate and 1 and 15 μmol/L DHG).
Linearity
Samples containing high analyte concentrations (3000 μM glycolate, 2000 μM glycerate and 100 μM DHG) were serially diluted 1:1 with blank urine over four steps. Observed analyte concentrations were compared against expected values. In addition, high calibrators were serially diluted 1 in 2 with water over four steps.
Recovery
Low analyte concentration or blank urine (for glycerate and DHG) was spiked at four concentrations (3000, 1500, 750 and 375 μM glycolate, 2000, 1000, 500 and 250 μM glycerate and 100, 50, 25, 12.5 μM DHG) and observed concentrations were compared against expected values.
Interference, carryover and ion suppression were not formally assessed, the latter because the assumption was made that the co-eluting IS and metabolites would be expected to be similarly affected if ion suppression was an issue. Clinical validation was performed on urine samples from genetically confirmed individuals.
GC–MS sample preparation and analysis
Sample preparation and GC–MS analysis of glycolate, glycerate, DHG and HOG was performed as previously described. 5 For the additional PH3 samples, HOG was quantified as previously described. 9
Urine creatinine was measured on a Cobas 8000 autoanalyser (Roche Diagnostics GmbH, Mannheim, Germany) using a kinetic Jaffe reaction according to the manufacturer’s instructions.
Statistical analysis
Statistical analysis and graphing were performed in R (version 3.4.1) using the ‘BlandAltmanLeh’, ‘ggplo2’, ‘mrc’, ‘plotROC’, ‘ReferenceIntervals’ and ‘stats’ packages. Deming regression and Bland–Altman plots were used to assess bias between the GC–MS and LC–MS/MS methods. Shapiro–Wilk normality tests were performed on each data group before significance testing using the ‘Shapiro.test’ function within R. Statistical significance between disease groups was assessed by two-way ANOVA and Tukey’s post hoc test, with significance defined at P ≤ 0.05. Comparison of samples with and without the addition of thymol was performed by paired Student’s t-test. ROC curves were used to assess clinical assay performance. DHG correlation with HOG was assessed using Pearson’s correlation coefficient.
Results
LC–MS/MS assay performance
A typical chromatogram for this method is shown in Figure 2. Since glycolate, glycerate and DHG co-eluted, the peak widths were an important factor of consideration because a small dwell time and cycle time would be required to collect multiple data points across several co-eluting peaks. A dwell time of 14 ms was applied with an overall cycle time of 140 ms (10 transitions each at dwell times of approx. 14 ms). Given a peak width of approx. 6 s, this translated to >40 data points across each peak and MRM transition (transition switching time is approximately 10 ms). It is important to note that the method did not discriminate between
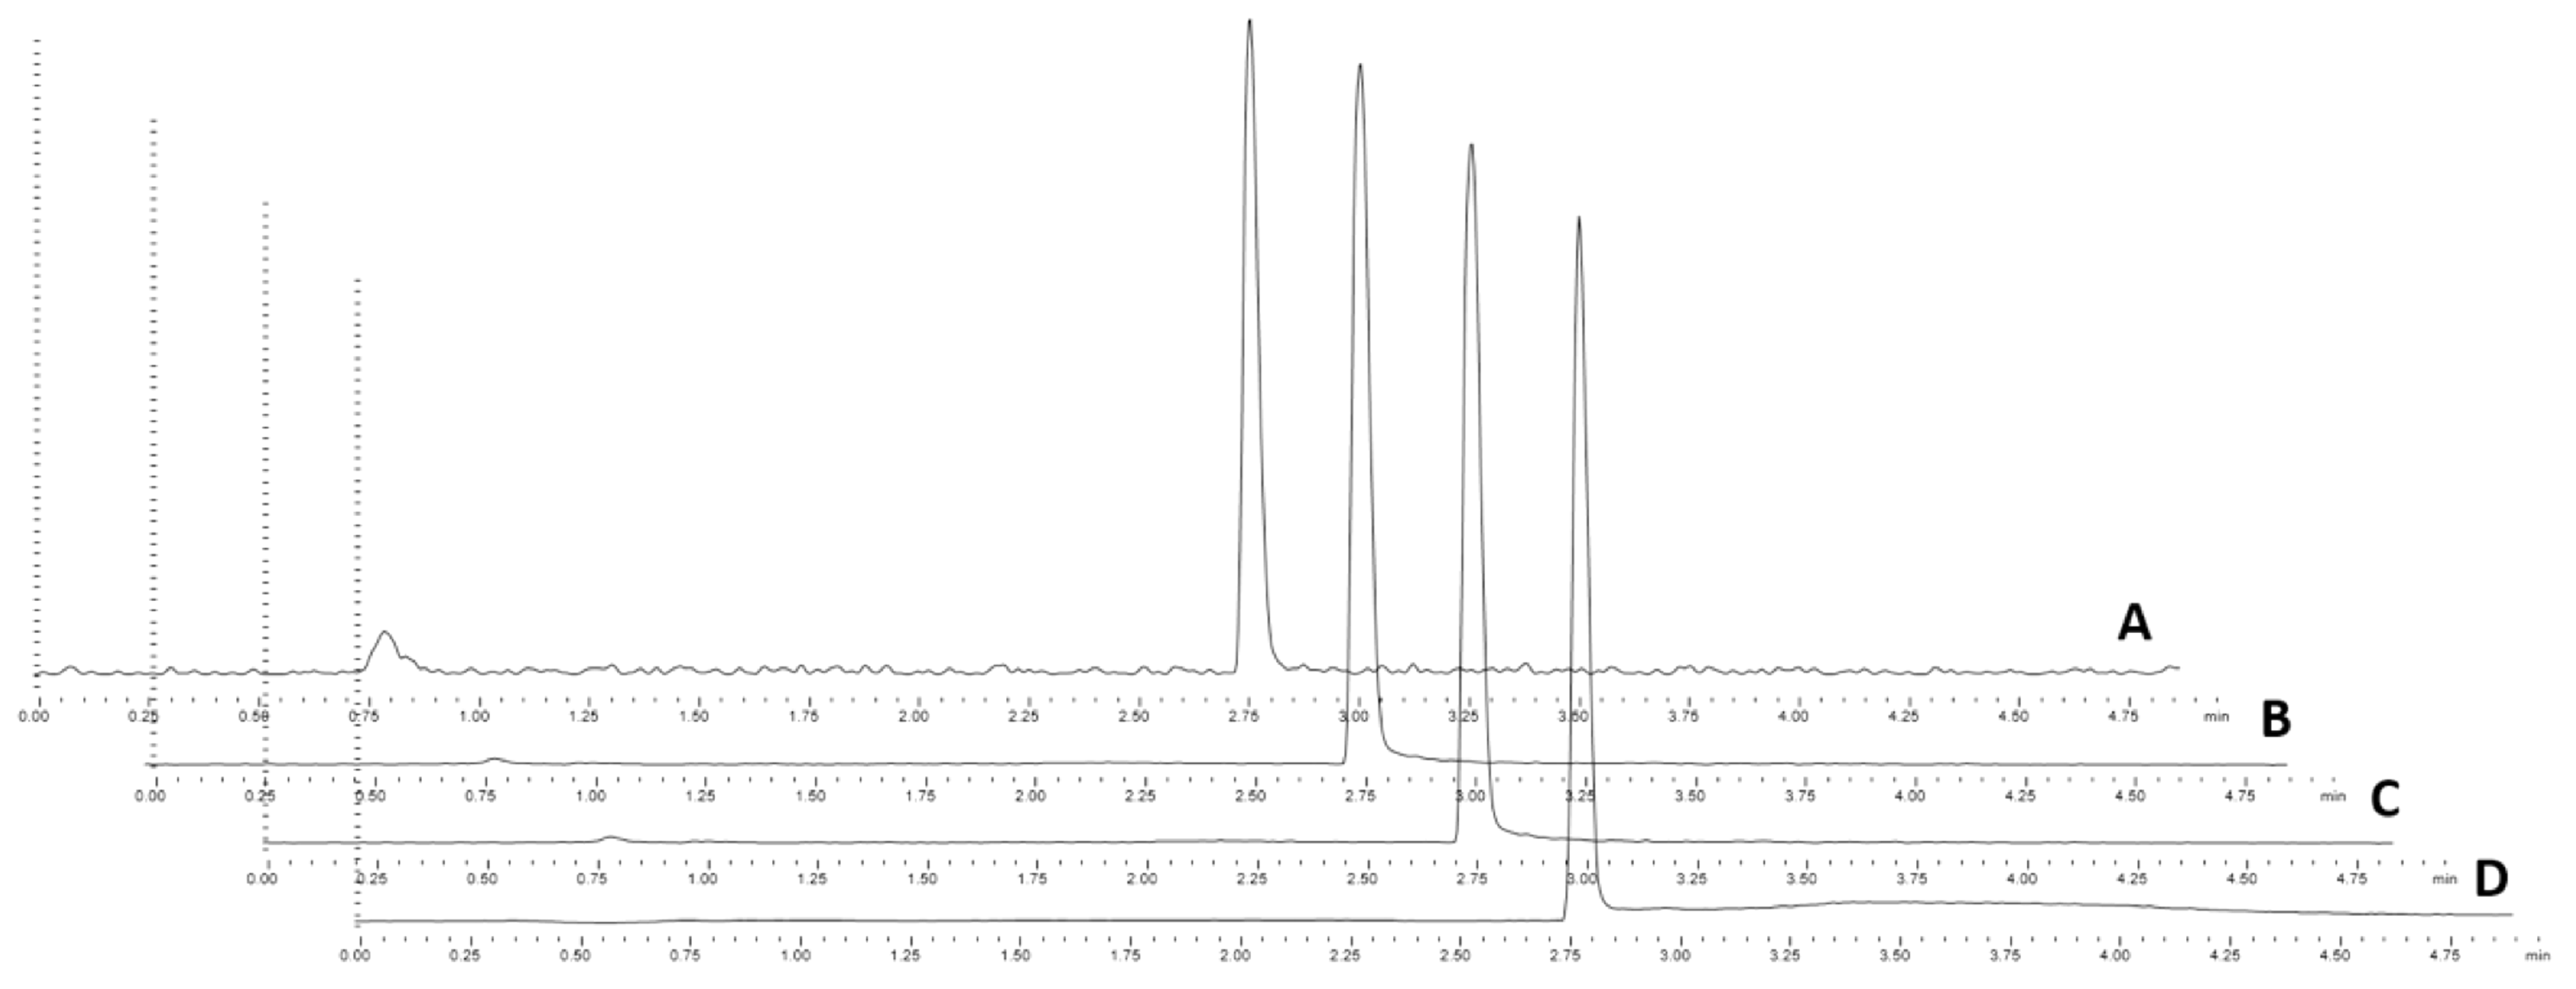
Representative chromatograph for PH metabolite analysis by LC–MS/MS. A – glycolate; B – glycerate; C – 2,4-dihydroxyglutarate; D – glycolate-D2. Note the plots are offset for clarity of co-eluting peaks. GCMS: gas chromatography–mass spectrometry; DHG: 2,4-dihydroxyglutarate; LCMS: Liquid chromatography–mass spectrometry.
Replicate analysis of serially diluted patients’ samples demonstrated a LLOQ at 76, 10 and 1 μmol/L for glycolate, glycerate and DHG, respectively. Peaks were detectable (peak integration was possible on pre-set integration parameters) down to the measured levels of 50, 5 and 1 μmol/L for glycolate, glycerate and DHG, respectively. The replicate CVs for these levels were >20% for glycolate and glycerate (LOD), although the lowest tested level for DHG (1 μmol/L) maintained a CV of 15% and as such the true LOD should be considered <1 μmol/L.
Correlation by Deming regression was greater than 90% for all metabolites (Figure 3) with glycolate, glycerate and DHG showing a mean bias of 3.3, −22.8 and 5.7% (Figure 4), respectively, when compared to the GC–MS method. Since no certified reference material was available for the assessment of glycerate quantitation accuracy, the large glycerate bias was further investigated by standard addition experiments (see supplementary material). It was clear that the results achieved by standard addition were in keeping with those achieved by the LC–MS/MS standard curve interpolation. The LC–MS/MS assay remained linear to the highest measured glycerate level of 3000 μmol/L, while the GC–MS/MS method was only linear to 1000 μmol/L. However, since the bias did not appear to be concentration dependent, assay linearity does not fully account for the apparent bias observed.
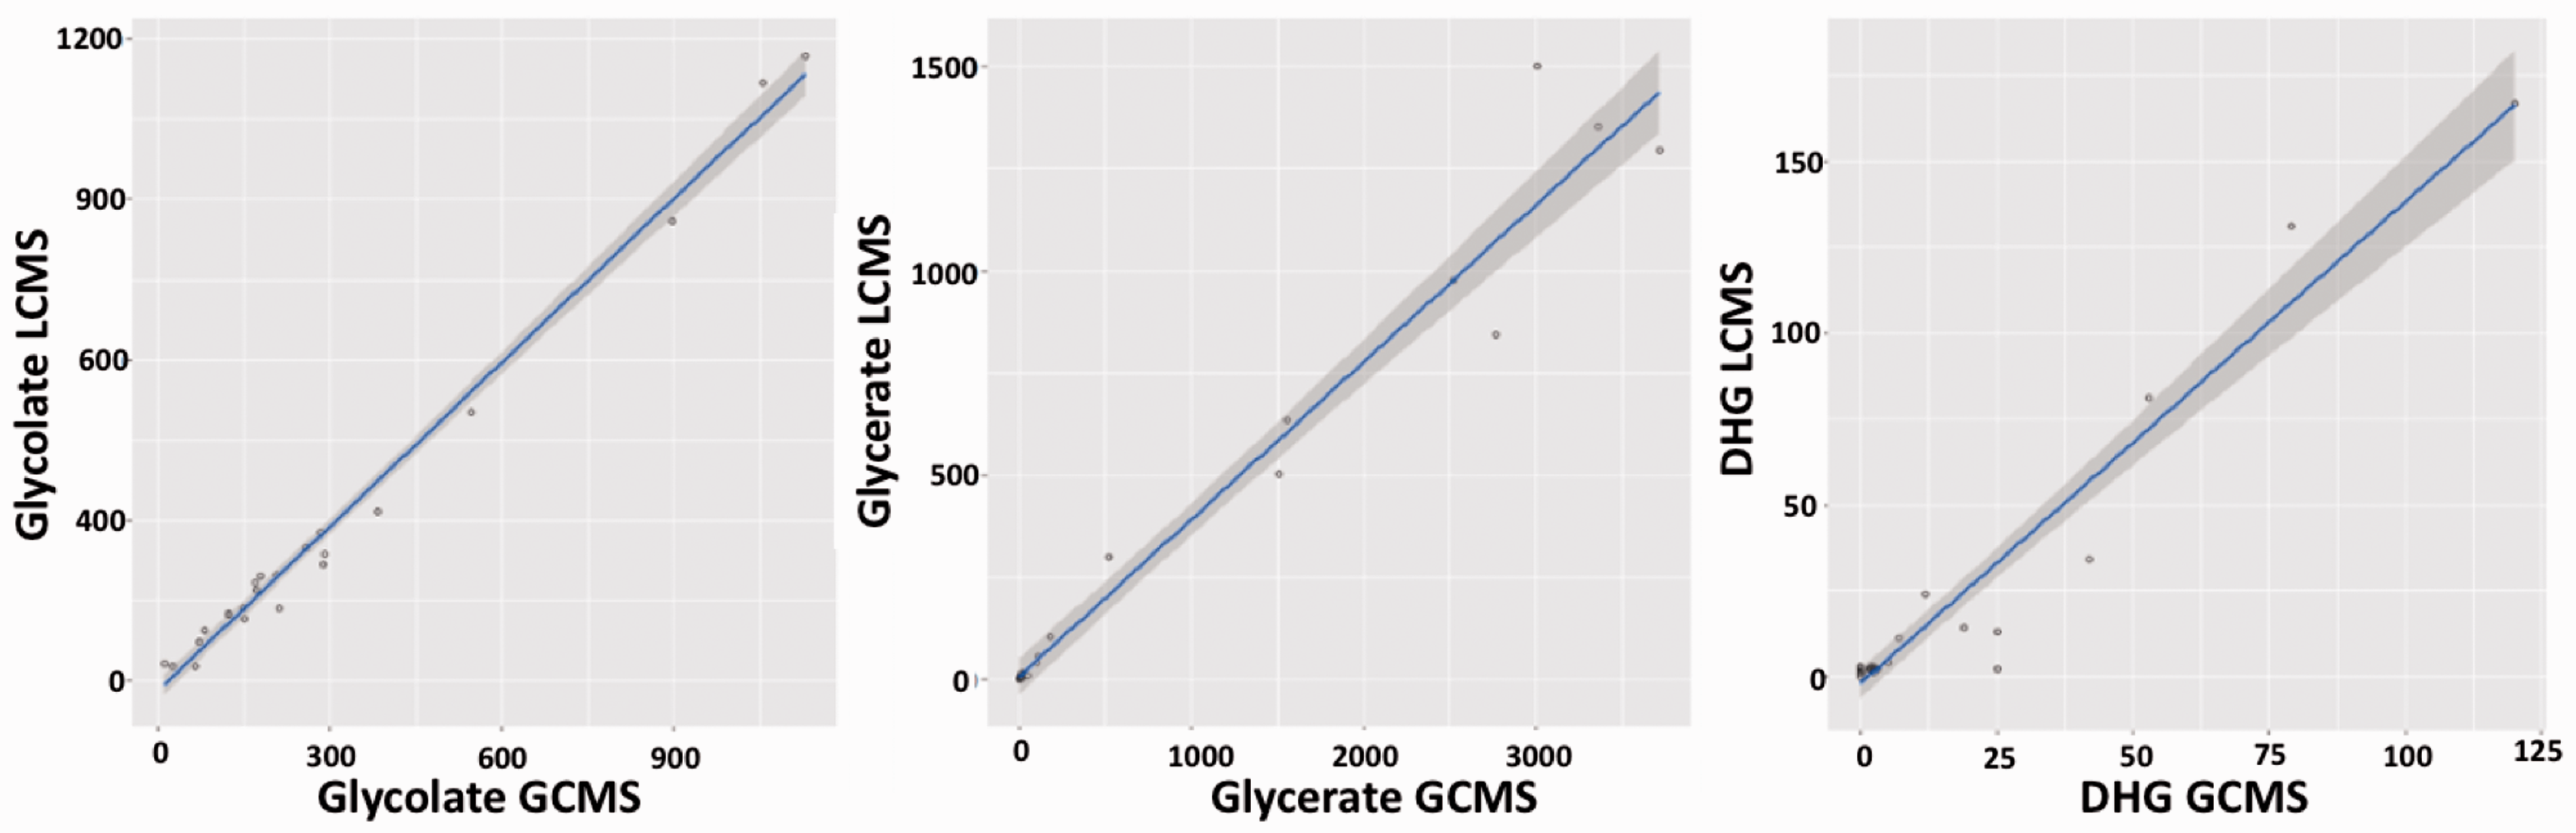
Deming regression comparison of PH metabolite analysis by LC–MS/MS and GC–MS. DHG, 2,4-dihydroxyglutarate; concentrations were in μmol/L. Deming regression line (blue) with 95% confidence intervals (grey portion). r2 of 0.99, 0.96 and 0.94 for glycolate, glycerate and DHG, respectively.
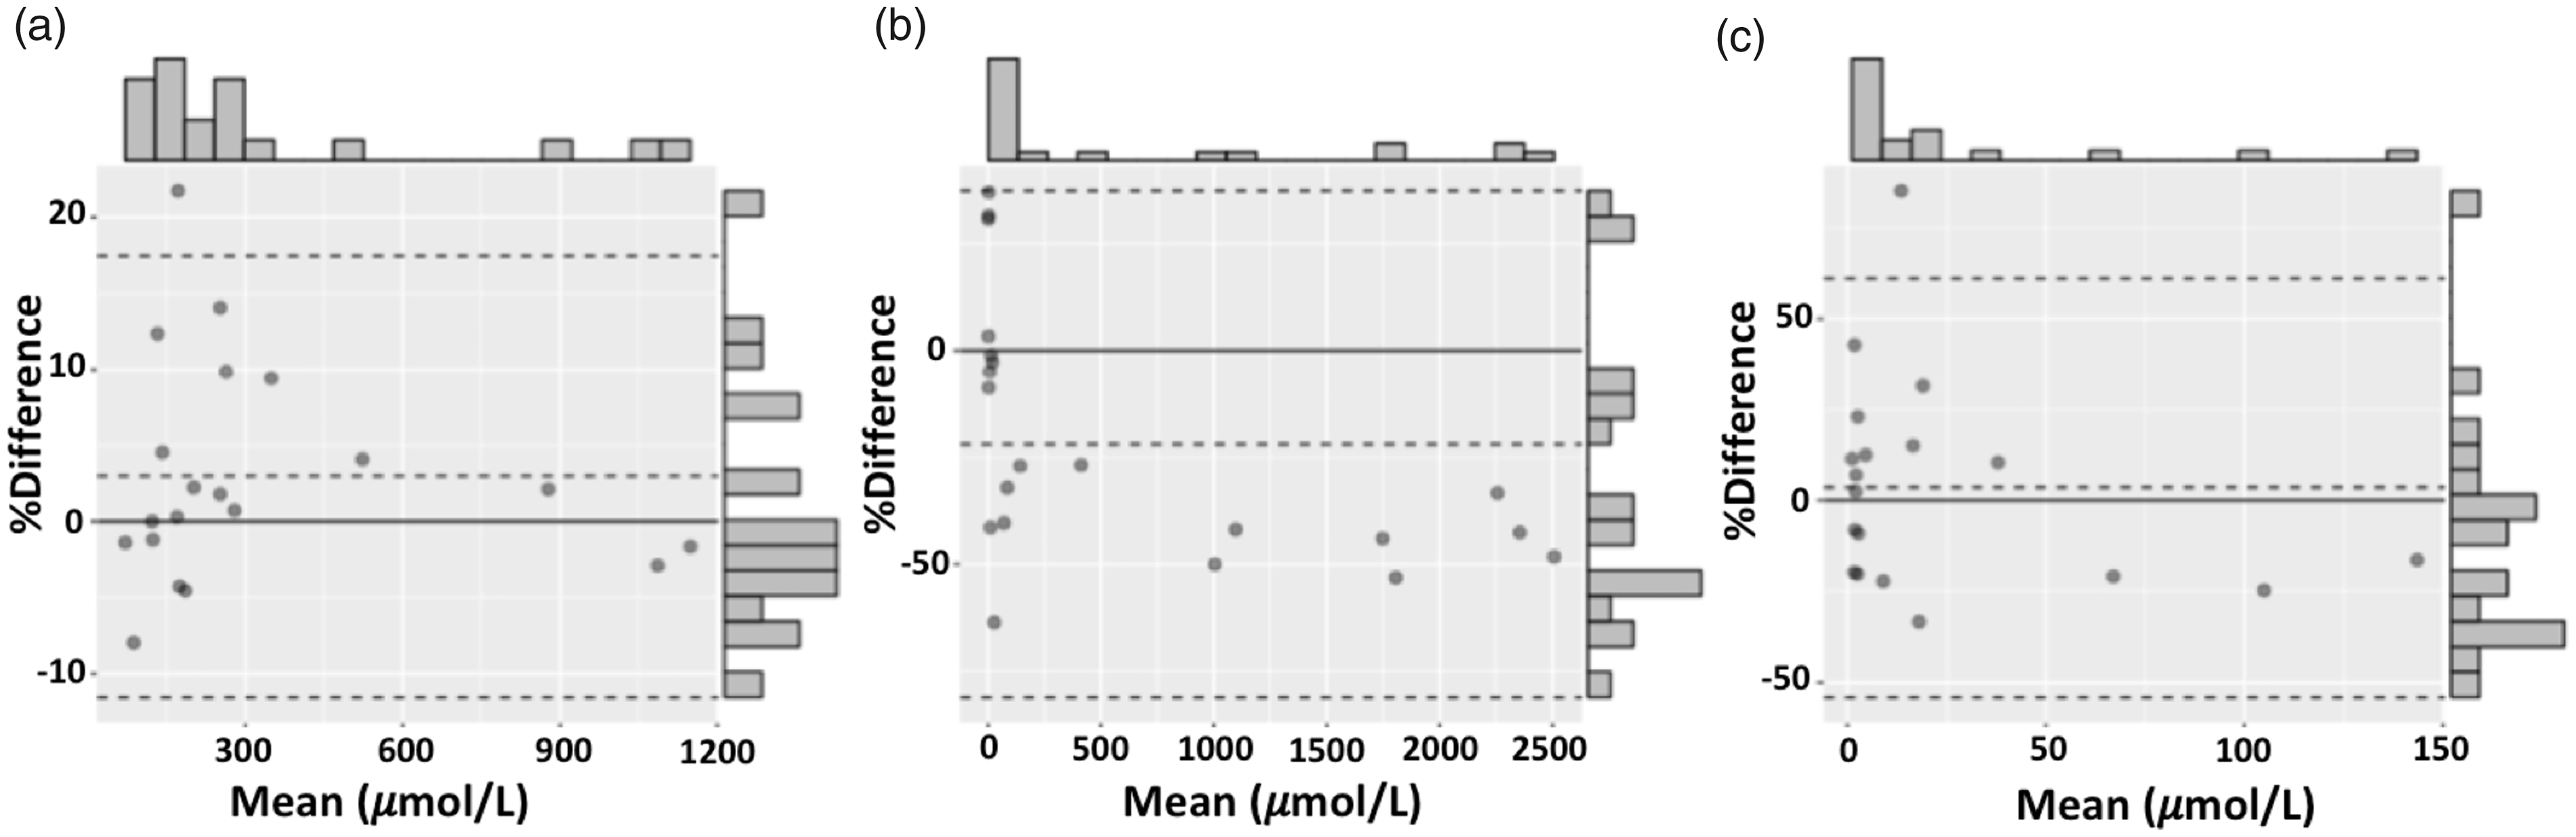
Bland–Altman with frequency distribution plots for PH metabolite analysis by LC–MS/MS and GC–MS. (a) glycolate, (b) glycerate, (c) DHG. Dashed lines represent mean bias and limits of agreement.
The mean recovery across the measured range was 103, 104 and 93% for glycolate, glycerate and DHG, respectively. The assay for glycolate and glycerate remained linear (r2 > 0.99) until the highest measured concentration of 3000 μmol/L, while DHG remained linear to 300 μmol/L. These levels all exceed the expected concentrations found in PH. In conclusion, the measuring range of the assay was 76–3000, 10–3000 and 1–300 μmol/L for glycolate, glycerate and DHG, respectively.
The mean total imprecision (CV) was 6.4, 10 and 11% for glycolate, glycerate and DHG, respectively.
The paired urine samples (n = 10), with and without the addition of thymol, were compared by paired Student’s t-test. The presence of thymol as a preservative did not significantly affect the quantitation of the PHM (P > 0.05). There was also no change in analyte retention times and peak shape did not appear affected on visual inspection. Excessively acidified samples did produce peak shape and retention changes, in some cases making the samples unsuitable for quantitation, thus over-acidification should be avoided. Further evaluation of the phenomenon remains to be carried out.
Diagnosis of PH by LC–MS/MS analysis
All metabolite results were normalized by expressing as analyte/creatinine ratio to minimize the effect of variable urine concentrations and to enable comparison of random samples.
The levels of PHM in each disease group and controls are shown in Figure 5. In the control group glycolate was 10–40 μmol/mmol creatinine (interquartile range [IQR]), which was in keeping with our previous findings. 5 The median glycolate:creatinine ratio of 268 μmol/mmol (138–366 IQR) was significantly higher in patients with PH1 (P < 0.001) than patients with PH2, PH3 and controls, ranging from normal to grossly elevated (31–692 μmol/mmol). There was, however, a clear overlap for this analyte between the groups as seen in Figure 5(a). The highest values were only seen in urines from patients with PH1, which suggested that a higher cut-off can be used to diagnose PH1 albeit with a reduced sensitivity: a cut-off of 193 μmol/mmol gave 100% specificity for PH1 at a sensitivity of 73%. The median glycerate:creatinine ratio of 321 μmol/mmol (252–598 IQR) was significantly higher in urine from patients with PH2 (P < 0.05) than those with PH1, PH3 and controls. The lowest level of glycerate in the PH2 group (100 μmol/mmol) was 3.7-fold higher than seen in the other groups. Given the clear separation of distribution between PH2 and other groups, a 100% specificity and sensitivity for diagnosis of PH2 was possible using a cut-off of >100 μmol/mmol. The median DHG:creatinine ratio of 12.2 μmol/mmol (5.9–15.2 IQR) in PH3 urines was significantly higher (P < 0.001) than PH1, PH2 and controls. The lowest level for DHG in the PH3 group (5 μmol/mmol) was more than 1.7-fold higher than the highest level in the other groups. Therefore, 100% specificity and sensitivity for diagnosis of PH3 was possible using a cut-off of >4.9 μmol/mmol. To further confirm the derived DHG diagnostic cut-off, 67 additional independent PH3 patients’ samples, previously analysed for HOG in the Bonn laboratory, were analysed by the LC–MS/MS method. All PH3 patients in this cohort had DHG levels above our derived clinical cut-off of 4.9 μmol/mmol and there was only a weak correlation with HOG levels, with a Pearson’s correlation coefficient (r) of 0.61 (Figure 6), the discrepancy particularly marked at low HOG concentrations as one might expect as HOG is unstable. Glycolate and glycerate were not elevated in any of the PH3 patient urines.
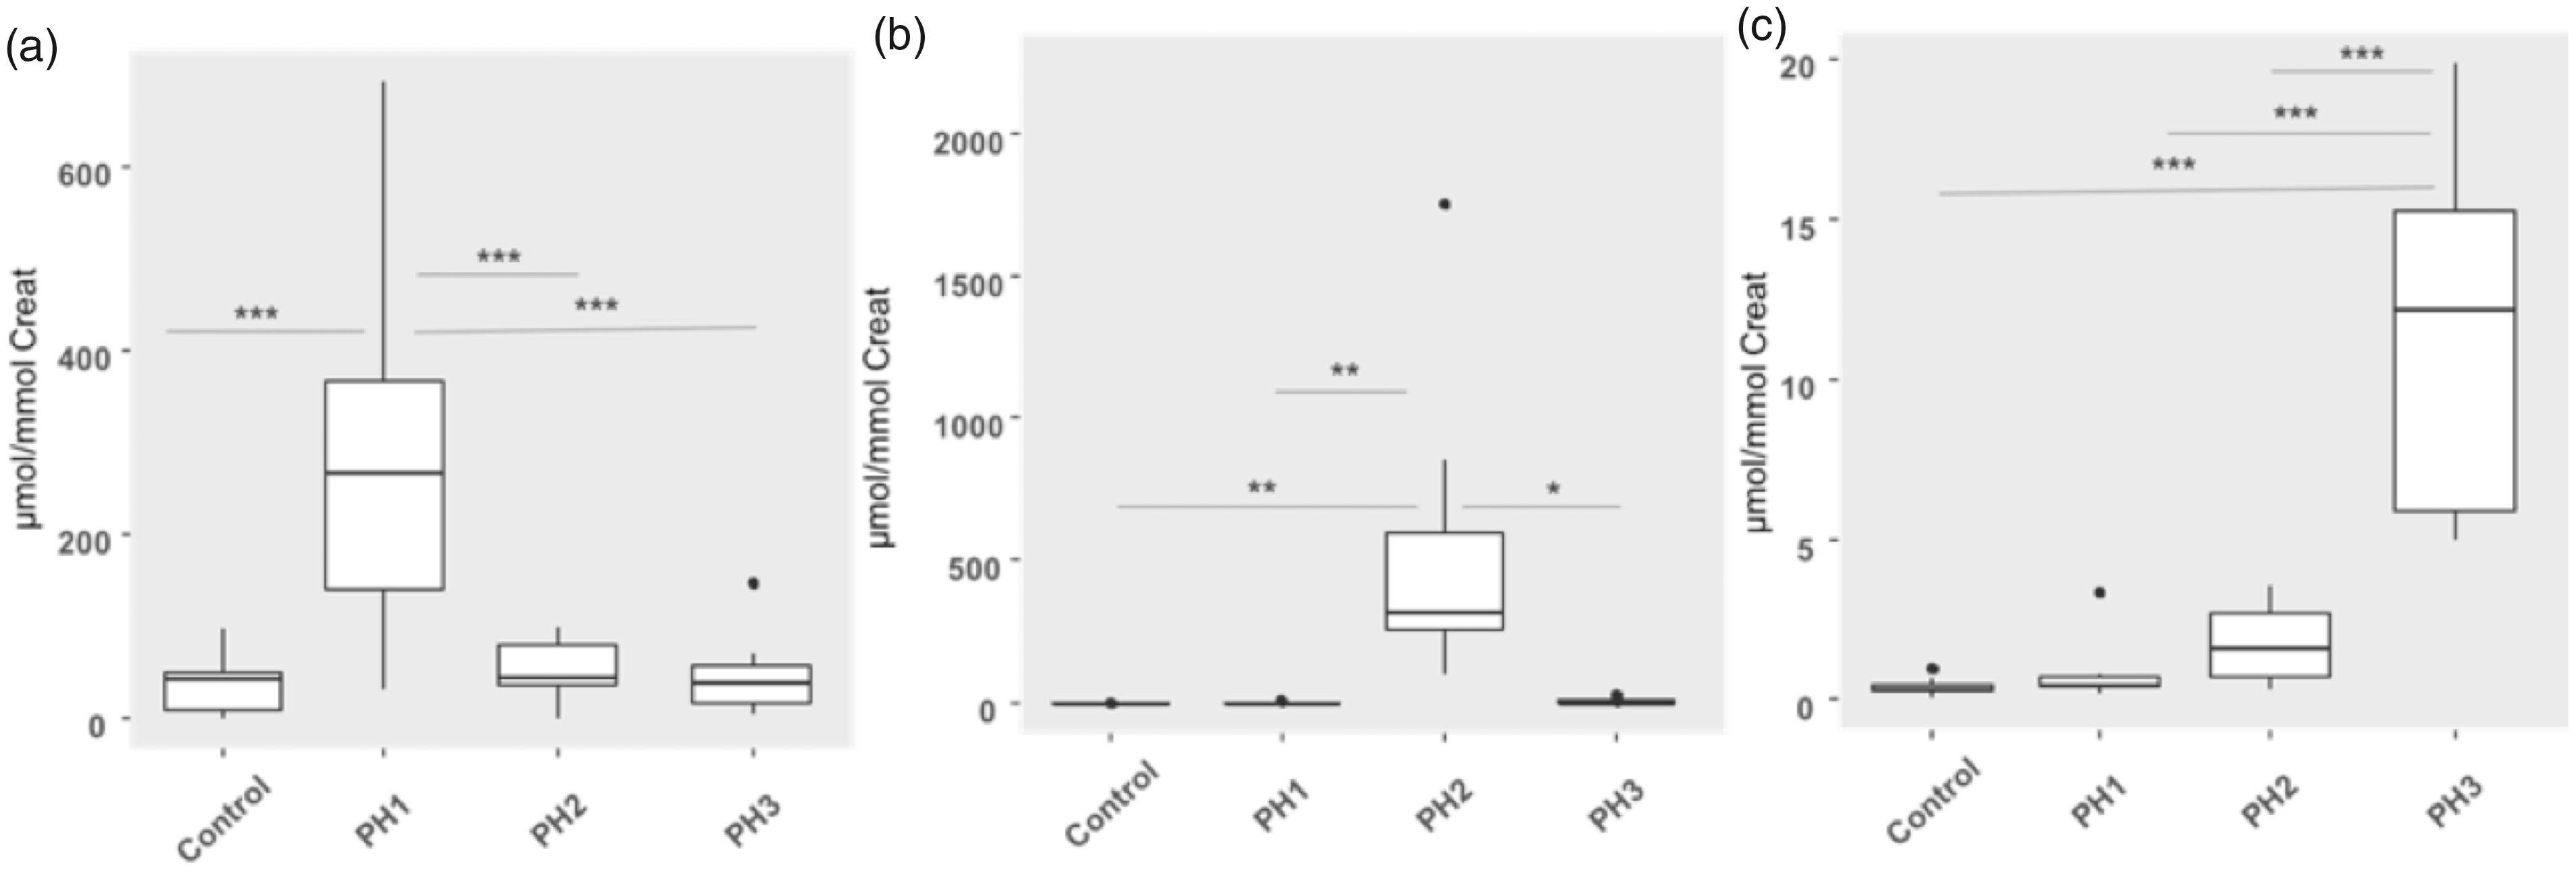
PH metabolites in PH patients as analysed by LC–MS/MS. (a) glycolate, (b) glycerate, (c) DHG. Statistical significance was determined by ANOVA with Tukey’s post hoc test; *P > 0.05; **P > 0.01; ***P > 0.001.
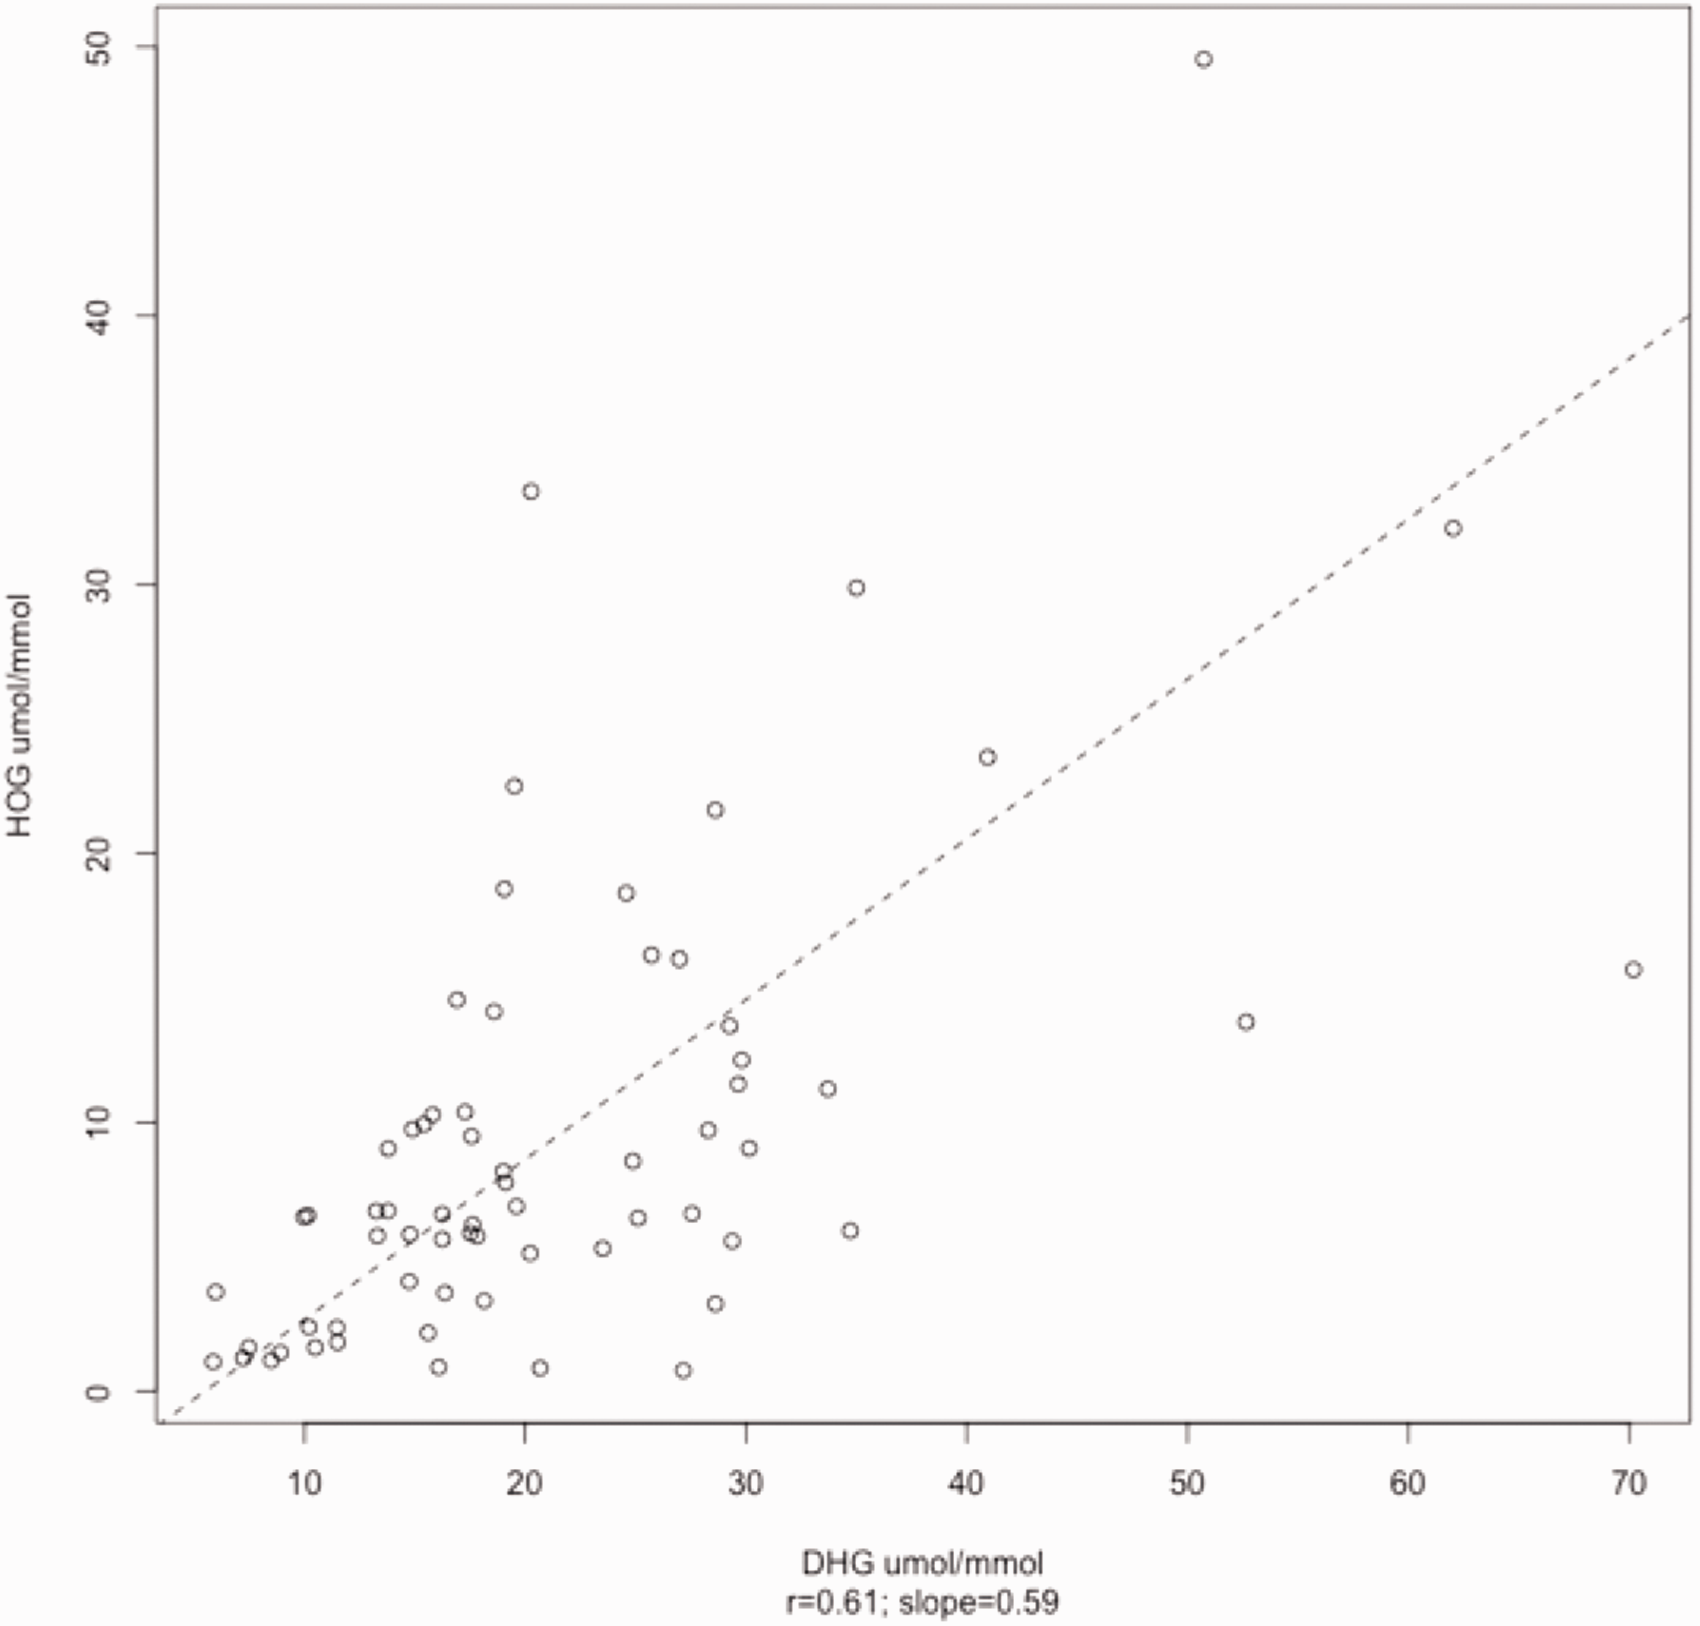
Deming regression of DHG and HOG, showing a Pearson’s correlation coefficient (r) of 0.61. DHG: 2,4-dihydroxyglutarate; HOG: 4-hydroxy-2-oxoglutarate.
Discussion
A novel LC–MS/MS screening method for the simultaneous quantitation of the urinary PHM, glycolate, glycerate and DHG is here described. The PHM appeared to be poorly retained on standard reverse phase LC columns when initially tested and modified columns with polar end capping along with sensitive instrumentation were required for analysis. This approach was preferred to changing to normal phase columns or hydrophilic interaction chromatography, as it had the advantage of fitting in better with our routine laboratory environment, requiring less equilibration time following column switching. An important hindrance for the accurate quantitation of PHM is the lack of certified reference material and appropriate internal standards, particularly stable isotopes. A D2-glycolate stable isotope internal standard was used as a surrogate for both glycerate and DHG in this study and the metabolites were purposely co-eluted to allow for less variation between analyte and internal standard. This approach produced comparable results to our GCMS method on the whole, albeit with a negative bias for glycerate and some degree of scatter, which may be expected given the novelty of these analytes and differences in analytical methodology. The bias had no clinical implications.
For co-eluting compounds there is competition for access to the droplet surface for gas-phase emission within the spray. The relative liquid phase basicities and surface activities of compounds are therefore likely to affect the ionization efficiency of the individual compounds and the MS source’s ion limit may be exceeded leading to ion suppression. Theoretically, the effect of ion suppression on the co-eluting internal standard should be proportional to suppression of the analyte and thus the analyte-to-internal standard response ratio should compensate for any ion suppression that may be present, although this assumes all analytes are affected in the same way.
The custom-made calibrator for DHG gave much lower results to those previously reported for this analyte3,5 that were based on in-house preparations and presumably related to impurities in the latter, as no significant mean bias to the same degree was subsequently seen between our two methods using the same calibrators. It should be noted that all urine samples in this study were acidified according to our existing PHM clinical protocol allowing reflex testing of samples received for urinary oxalate. Extreme over-acidification of urine samples (i.e. if a disproportionally large volume of acid was used to acidify random urine samples) does affect the chromatography of glycolate and glycerate. This situation cannot be completely resolved by neutralizing the sample and may need additional sample preparation or perhaps even the use of non-acidified urine samples although this would lose the benefit of reflex testing and slow down the diagnosis of these disorders.
The glycolate:creatinine ratios in PH1 patients and controls produced by our method were similar to those previously reported.10–12 Glycolate was not a completely sensitive nor specific marker for PH1 since not all PH1 patients had elevated levels – a finding that has been previously documented. 7 This situation possibly reflects inter-individual variation of enzymes including glycolate oxidase, LDH and GR involved in endogenous glycolate and glyoxylate metabolism as well as a dietary contribution. 13 Glycolate oxidase deficiency is also characterized by increased levels of urinary glycolate but far in excess of those seen in PH1.14,15 The biological variation of glycolate has previously been shown to be 18.9%. 5 This degree of variation outweighs that from the analytical imprecision and has important significance in the diagnostic setting, where a single measurement cannot be relied upon to reflect the true baseline glycolate excretion.
Unambiguous identification of all PH2 cases was possible based on the glycerate results, given there was no overlap in glycerate:creatinine ratios between PH2 and other groups. This finding was consistent with our previous findings using GC–MS 5 and those of others. 10
Previously, and confirmed in this study, we have shown that DHG is elevated in all PH3 urines but not in PH1, PH2 and control groups. 5 This metabolite appears to be stable in contrast to HOG, the other marker for PH3, that degrades rapidly when the sample is not collected into acid 5 and may explain why a significant number of PH3 patients in a recent study did not have elevated HOG. 9 Furthermore, analysis of DHG in a cohort of PH3 patients showed that all patients had DHG above the cut-off for this disorder and significantly higher than HOG in almost all cases (Figure 6). It should also be noted that a high purity analytical standard was available for DHG, while those for HOG are of variable purity which may contribute to differences in addition to sample instability. Thus, we advocate that DHG is the better marker for PH3, with 100% specificity and sensitivity. As in our previous study using GC–MS, glycerate was not elevated in the PH3 group and this finding again refutes the hypothesis that hyperoxaluria in PH3 may be the result of HOG inhibition of GRHPR as suggested by others. 4
The LC–MS/MS method proved of significant utility for the investigation of suspected PH and was less labour intensive than GC–MS, with faster sample preparation. The method provides a viable system for future screening of hyperoxaluric renal stone patients for PH, particularly PH3 which is thought to be significantly under-diagnosed based on the apparent frequency of mutations. 10 We also provide further evidence in support of DHG as the preferred metabolic marker for PH3.
Supplemental Material
Supplemental material for Rapid liquid chromatography tandem mass-spectrometry screening method for urinary metabolites of primary hyperoxaluria
Supplemental Material for Rapid liquid chromatography tandem mass-spectrometry screening method for urinary metabolites of primary hyperoxaluria by G Woodward, R Pryke, B Hoppe and G Rumsby in Annals of Clinical Biochemistry
Footnotes
Acknowledgements
We would like to acknowledge the contribution of both past and present members of our laboratory for the processing, analysis and developments made to the clinical service.
Declaration of conflicting interests
The author(s) declared the following potential conflicts of interest with respect to the research, authorship, and/or publication of this article: GW, GR and RP are employees of Health Services Laboratory LLP that provide diagnostic testing services.
Funding
The author(s) disclosed receipt of the following financial support for the research, authorship, and/or publication of this article: No specific grant funding was obtained for this study. The overhead cost for this study was covered by Health Services Laboratory LLP.
Ethical approval
Ethical approval was not required. This study was a method comparison conducted as per routine laboratory practice for change of method validation.
Guarantor
GR.
Contributorship
GW performed the method developments and manuscript drafting. GR was involved with the study design, supervision and manuscript writing. RP performed the GC–MS analysis. BH provided additional expert advice and support from his specialist PH clinic.
References
Supplementary Material
Please find the following supplemental material available below.
For Open Access articles published under a Creative Commons License, all supplemental material carries the same license as the article it is associated with.
For non-Open Access articles published, all supplemental material carries a non-exclusive license, and permission requests for re-use of supplemental material or any part of supplemental material shall be sent directly to the copyright owner as specified in the copyright notice associated with the article.