
Abstract
Background
The synthesis and glycosylation of glycoproteins and glycolipids take place in the liver. Thus, liver diseases may affect serum concentrations of some carbohydrate derivatives, especially the concentration of sialic acid which is attached to the end of oligosaccharide chains. The aim of this study was to measure and compare the serum concentration of total sialic acid in chronic hepatitis B and C. The hypothesis is that both viruses responsible for the development of inflammation work differently at the cellular level.
Methods
Serum samples were obtained from 90 patients suffering from liver diseases: 50 from chronic hepatitis B and 40 from chronic hepatitis C at the time of diagnosis. The total sialic acid concentration in the serum was measured according to the enzymatic method using a colorimetric procedure.
Results
The mean total sialic acid concentration in patients with chronic hepatitis B was significantly lower than the mean concentration in the healthy group, while in patients with chronic hepatitis C, it was significantly higher than that in healthy people and in patients suffering from chronic hepatitis B. There were no significant differences in total sialic acid concentrations in patients with chronic hepatitis B and C according to the grade of portal/periportal activity, the grade of lobular activity and the stage of fibrosis.
Conclusions
We conclude that chronic viral hepatitis affects the total serum concentration of sialic acid. Moreover, the concentration of total sialic acid may be a useful marker to differentiate between chronic hepatitis B and C but is not useful for evaluation of the progression of these diseases.
Introduction
Sialic acid (SA) is a nine-carbon acetylated derivative of neuraminic acid.1–3 It is widely distributed in human fluids and tissues.2,3 This monosaccharide occurs at the end of sugar chains attached to the surface of cells and soluble proteins, e.g. glycoproteins and gangliosides.1–3 The location and unique structural features of SA determine biological functions of this molecule.2–4 These are (among others): stabilization of glycoproteins conformation, stabilization of cellular membranes, cell to cell recognition and interaction and contribution to membrane transport. This unique localization enables the changes in its concentration in many pathological states. 5 Increased concentration of total sialic acid (TSA) has been observed in patients suffering from various diseases, including malignancy, cardiovascular and infectious diseases.2,3 The synthesis, catabolism and attachment of this molecule to the oligosaccharide chains of proteins and lipids take place in the liver. Therefore, the sialylation patterns of glycoproteins and glycolipids are highly variable and depend on the liver status. The estimation of serum SA concentration may be a helpful biomarker of liver diseases.3,5
Among others, HBV infections were associated with an increasing number of N-glycan branches or with an additional N-acetylglucosamine residues linked to the mannose. 6 Changes in glycosylation are also present in HCV infections, e.g. the presence of an additional N-acetylgalactosamine, which occasionally occurs in the structure of the normal protein N-glycans. 7 These changes in protein sialylation can affect the serum TSA concentration. Additionally, two viruses responsible for infection present profound differences in their molecular structure, life cycle and interplay with host factors which significantly differentiate the mechanisms involved in the infection process. 8 Therefore, the aim of this study was to assess and compare serum concentration of TSA in chronic hepatitis B and C and evaluate the effect of the disease activity on its serum value.
Material and methods
Subjects
The tested group consisted of 90 patients (62 males and 28 females) (mean age: 33.2 years; range: 19–71) who were admitted to the Department of Infectious Diseases and Hepatology of Medical University of Bialystok. They were hospitalized because of chronic hepatitis B – 50 patients (35 males and 15 females) (mean age: 33.2 years; range: 19–71) and chronic hepatitis C – 40 patients (27 males and 13 females) (mean age: 41.7 years; range: 19–67).
The diagnosis was based on the clinical data such as signs, symptoms, physical exams, abdominal ultrasound or abdominal CT and laboratory tests (biochemical liver panel: mean corpuscular volume – MCV, platelet – PLT, international normalized ratio – INR, aspartate aminotransferase – AST, alanine aminotransferase – ALT, gamma-glutamyl transferase – GGT, bilirubin). To confirm the diagnosis of hepatitis B and hepatitis C, the HBs antigen, anti-HBV and anti-HCV tests were performed. Because the liver biopsy is considered a gold standard for diagnosing and assessing liver fibrosis in all patients with chronic hepatitis, the liver biopsies were performed. To evaluate the grade of inflammation and stage of fibrosis, we used the Scheuer classification for grading (G0 to G4) and staging (S0 to S4) of chronic hepatitis.
Healthy group
The healthy group consisted of 30 healthy volunteers (16 males and 14 females) (mean age: 29.5 years; range: 21–54) recruited from hospital workers. Informed consent was obtained from all individuals (healthy and sick) included in the study. This study was in accordance with Helsinki Declaration and was approved by the Bioethical Committee at the Medical University of Bialystok.
Sample collection
Blood samples from patients with liver disease (hepatitis B and C) and controls were collected by peripheral vein puncture into tubes without anticoagulants. The serum samples were separated by centrifugation at 1500 × g for 10 min at room temperature and stored at –86°C until analysed. Besides serum, a part of each blood sample was collected into tubes containing EDTA-2 for haematological analyses and 3.8% liquid sodium citrate for haemostasis analysis.
Determination of TSA
TSA concentration in serum was measured on the Microplate Fluorescence Reader FL600 (Bio-Tek, USA), according to an enzymatic method (EnzyChrom Sialic Acid Assay Kit, BioAssay System, Hayward, USA) using a colorimetric procedure. This assay uses a single working reagent, which combines N-acetyl neuraminic acid aldolase, pyruvate oxidase and hydrogen peroxide. The samples were pretreated by a hydrolysis procedure using a preprepared reagent included in the kit and then incubating the samples for 1 h at 80°C. The colour intensity of the reaction product at 570 nm is directly proportional to the SA concentration in the sample. The TSA concentration was estimated from standard curve (0, 0.3, 0.6 and 1.0 mmol/L stock solution).
Determination of other tests
The PLT count and MCV value were determined on the Sysmex XS-800i (Sysmex Corporation, Singapore). The prothrombin time was measured on the STA Compact Max analyser (Diagnostica Stago, Gennevilliers, France) by the viscometric method. All biochemical tests were determined on the Architect c8000 (Abbott Laboratories, Abbott Park, IL, USA) using kits from Abbott (Wiesbaden, Germany). The AST, ALT and GGT were analysed according to the spectrophotometric method and total bilirubin was analysed by the colorimetric method.
Statistical analysis
To check the normality of distribution, the Shapiro-Wilk test was used. All the tests presented non-normal distribution (P < 0.001 for all). Because of these, the non-parametric tests were applied in the analyses. Results were expressed as median and range. The differences between tested and control group and differences between hepatitis B and hepatitis C were evaluated by Mann-Whitney U-test. The ANOVA rank Kruskal-Wallis test was performed to analyse the effect of grading and staging of chronic viral hepatitis. We considered P values < 0.05 as statistically significant.
Results
The baseline laboratory characteristics of the analysed patients with chronic hepatitis B and C and healthy subjects are provided in Table 1. The mean values of AST, ALT and GGT were found to be significantly different between hepatitis B and C. Additionally, in patients with hepatitis B, the mean values of PLT, INR and ALT were significantly different in comparison to the healthy group, while in patients with hepatitis C, we have seen the differences in the mean values of PLT, INR, AST and ALT (Table 1).
Baseline laboratory characteristics of patients with hepatitis and healthy group.
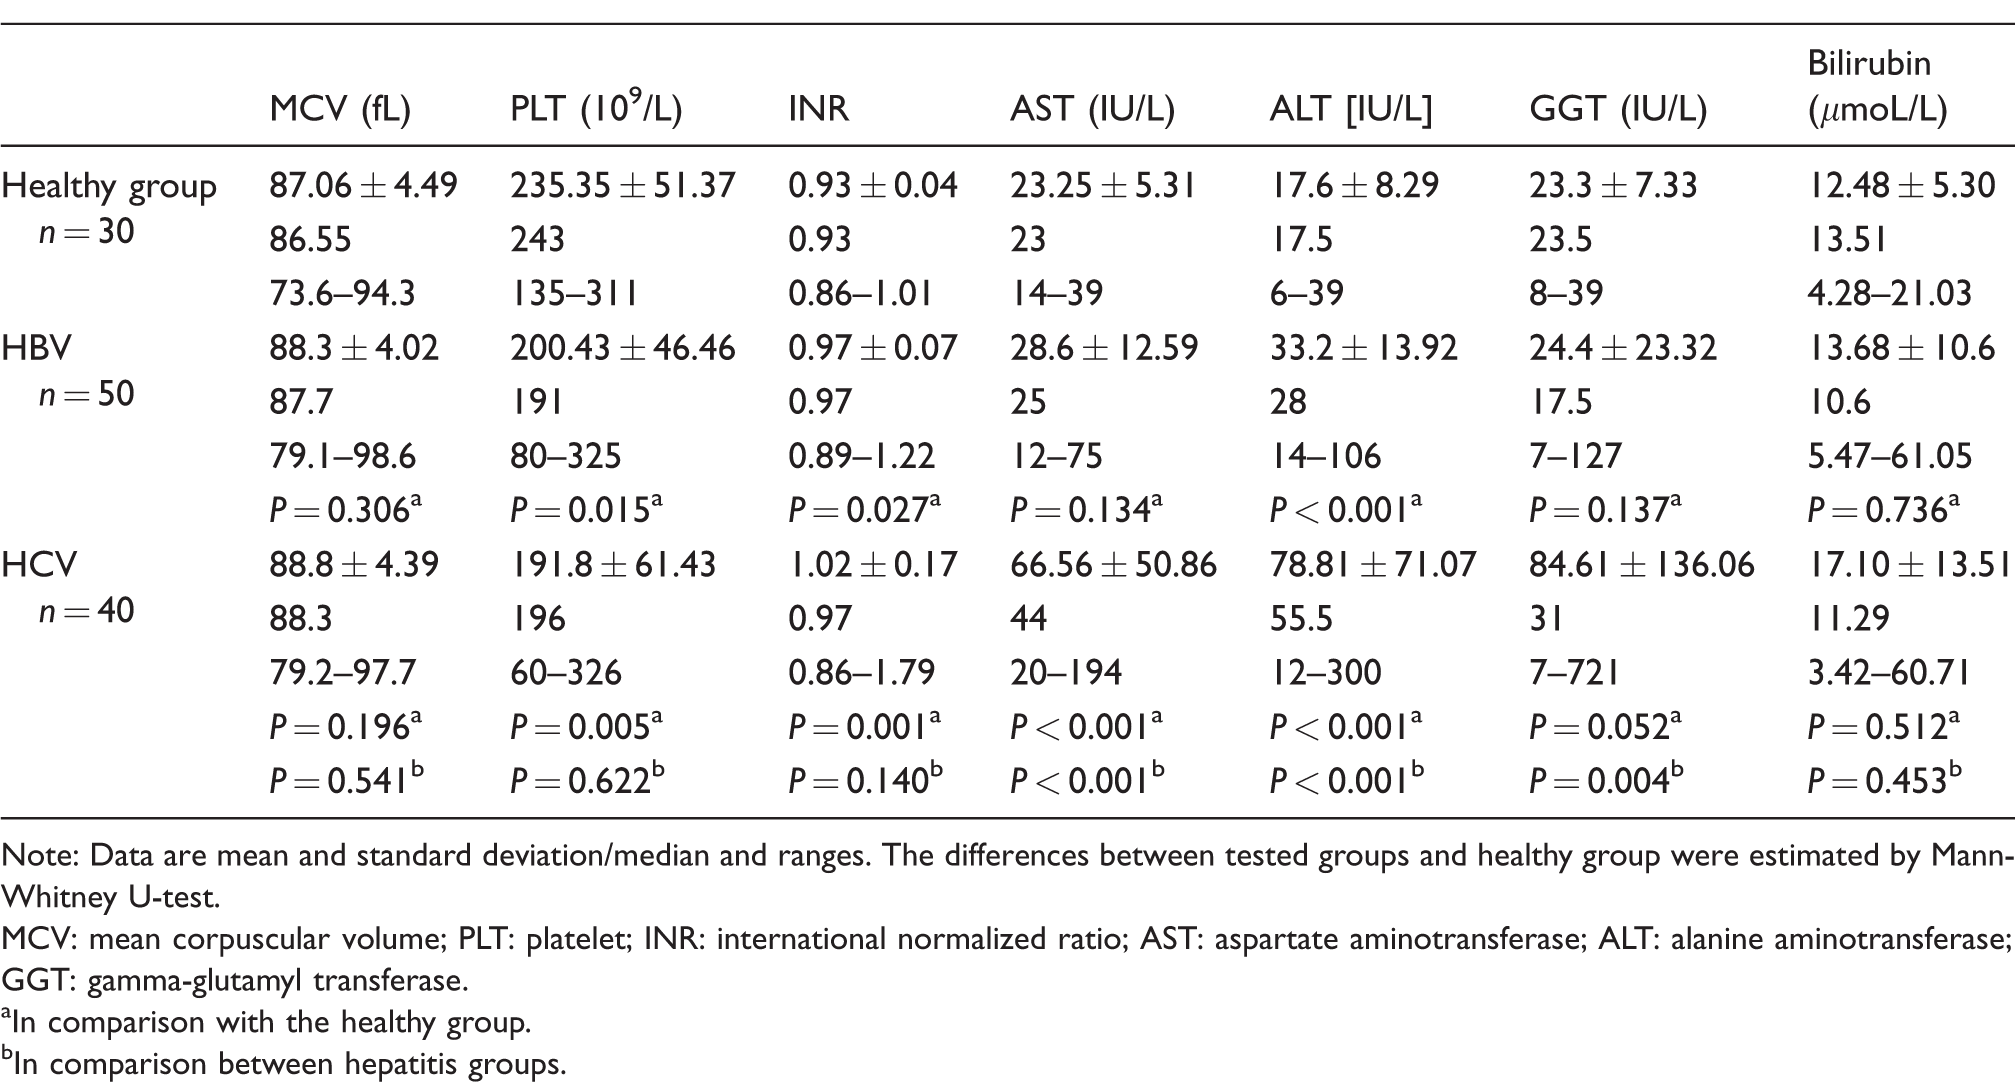
Note: Data are mean and standard deviation/median and ranges. The differences between tested groups and healthy group were estimated by Mann-Whitney U-test.
MCV: mean corpuscular volume; PLT: platelet; INR: international normalized ratio; AST: aspartate aminotransferase; ALT: alanine aminotransferase; GGT: gamma-glutamyl transferase.
aIn comparison with the healthy group.
bIn comparison between hepatitis groups.
The mean TSA concentration in the serum samples of patients with hepatitis B (median: 1.32 mmoL/L, range: 0.06–1.84; n = 50) was significantly lower than that in healthy subject (median: 1.43 mmoL/L, range: 0.96–2.16; n = 20) (Mann-Whitney U-test: Z=–1.98; P = 0.047) (Figure 1). In patients with hepatitis C (median: 1.67 mmoL/L, range: 1.18–2.96; n = 40), it was significantly higher than the mean concentration in the controls (Mann-Whitney U-test: Z = 2.235; P = 0.025). There were significant differences in the total serum SA concentrations between chronic viral hepatitis B and C (Figure 1). The mean TSA concentration was significantly higher in patients with hepatitis C than that in patients with hepatitis B (Mann-Whitney U-test: Z = 2.777; P = 0.005).
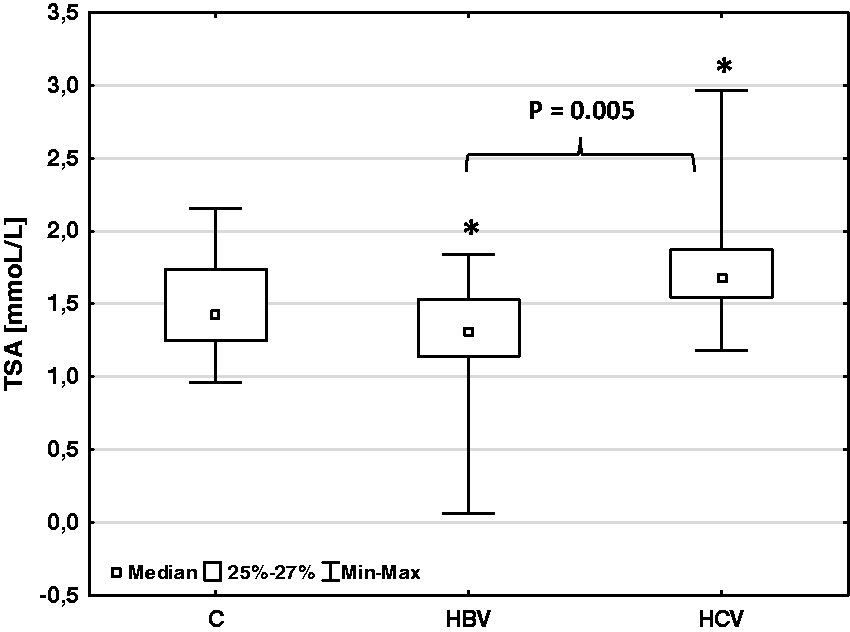
Total sialic acid concentration in patients with chronic viral hepatitis (HBV and HCV) and healthy group (C).
Statistical analysis revealed that there were no significant differences in TSA concentrations according to the grade of portal/periportal activity, the grade of lobular activity and the stage of fibrosis in patients with chronic viral hepatitis (both hepatitis B and C), (ANOVA rank Kruskal-Wallis test: P > 0.05 for all comparisons) (Figure 2).
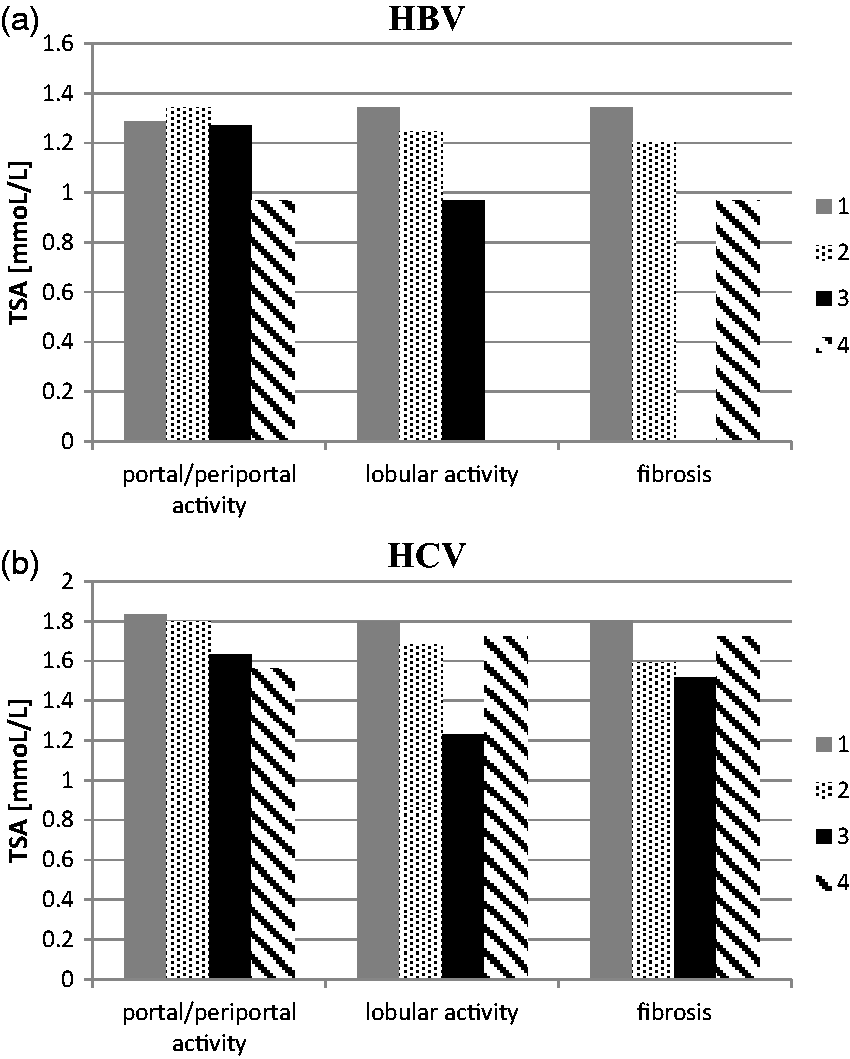
Total sialic acid concentration according to the grade of portal/periportal activity, the grade of lobular activity and the stage of fibrosis in patients with chronic hepatitis B (HBV) (a) and chronic hepatitis C (HCV) (b).
Discussion
Our present study tried to identify the changes in TSA concentration in the serum of patients with chronic viral hepatitis B and C. We denoted an increase in serum TSA concentration in patients with chronic hepatitis C and its decrease in patients with chronic hepatitis B. When analysing our results, it should be taken into account that TSA is a sum of protein-bound sialic acid (PBSA), lipid-bound sialic acid (LSA), and free sialic acid (FSA). Therefore, the differences in the concentration of each of these components may affect the total concentration of SA. In our previous study, we showed that LSA concentrations differed between liver diseases, 9 what could be a result of many differences in lipid values between hepatitis B and C with cirrhosis. 10 On the other hand, we denoted also the changes in the concentration of FSA in liver diseases; however, we did not differentiate chronic hepatitis B and C. 11 The increased concentration of serum TSA in patients with chronic hepatitis C may be caused by the imbalances in the biosynthesis and post-translational glycosylation of the acute-phase glycoproteins in the liver and/or of intensified cell metabolism and increased serum sialyltransferase activity during the liver damage. 12 We should also take into account an inflammatory response because SA is an acute-phase reactant.
The explanation for the decreased TSA concentration in chronic hepatitis B may be related to the changes in the sialyltransferase activity during both acute and chronic stress. 13 There are evidence that chronic stress can decrease the activity of these enzymes in the liver. 10 Also, Stefenelli et al. showed that TSA concentration in chronic liver diseases was lower than that in the healthy subjects and differed from other diseases, e.g. pneumonia, rheumatoid arthritis and other inflammatory diseases, but they did not recognize the pathogenesis of tested diseases. 14
As the staging of the chronic liver disease, especially liver fibrosis, is essential to define prognosis and management of disease, we have taken into consideration the grade of portal/periportal activity, the grade of lobular activity and the stage of fibrosis. However, we did not find differences in TSA concentration, depending on the grade and stage of liver fibrosis. In our previously study concerning liver diseases, we did not denote the changes in TSA concentration in non-alcoholic liver cirrhosis according to the severity of disease evaluate by Child-Pugh scores.11,15 It could indicate that the changes in the serum concentration of glycoproteins and glycolipids are not parallel with the serum changes in TSA concentration. It can be explained by the presence of positive and negative acute-phase proteins, e.g. transferrin is negative acute-phase protein. TSA which we measured in this study is a result of the alterations of these acute-phase proteins. Additionally, it should be considered that the differences between the clinical features of hepatitis B and C consequent on different mechanisms involved in the infection process of hepatitis B and C.
In conclusion, our findings show that the TSA concentration in chronic viral hepatitis differs from healthy subjects and between chronic hepatitis B and C. The changes in serum TSA concentration during chronic hepatitis can be the result of the alterations in glycosylation (sialylation) of glycoproteins and glycolipids, and acute-phase reaction. We concluded that the concentration of TSA may be a useful marker to differentiate chronic hepatitis B from hepatitis C, but it is not useful for evaluation of the progression of chronic hepatitis.
Footnotes
Declaration of conflicting interests
The authors declared no potential conflicts of interest with respect to the research, authorship, and/or publication of this article.
Funding
The authors received no financial support for the research, authorship, and/or publication of this article.
Ethical approval
The Bioethical Committee at the Medical University of Bialystok approved this study (number: R-I-002/359/2017).
Guarantor
EG and LC.
Contributorship
EG – research concept and design, performance of the test, statistical analysis, data analysis and interpretation, writing the article. BC – data analysis and interpretation. MG – performance of the test. AP – sample collection, data gathering. RF – supervision on sample collection as a head of department. LC – final approval and editing of the article.