
Abstract
Background
MicroRNAs are present not only in exosomes but also in high-density lipoprotein (HDL) and have the potential as biomarkers for various diseases. Various purification methods have been developed to quantify HDL-miRNAs; however, they are unsuitable for clinical applications. Therefore, we aimed to establish a simpler analytical method to quantify HDL-miRNAs for clinical applications.
Methods
We purified HDL fraction from pooled plasma using a three-step protocol consisting of ultracentrifugation, phosphotungstic acid/MgCl2 precipitation and desalting/buffer exchange followed by the quantification of HDL-miRNAs by quantitative real-time PCR. In order to establish a method to quantify HDL-miRNAs by quantitative real-time PCR, we prepared standard curves for miR-223 and miR-92. The HDL-miRNAs of 10 volunteers were assessed.
Results
Exosomes and LDL were not detected in the purified HDL fraction. Furthermore, we confirmed that only HDL was purified and that the HDL recovery rate of our method was at least approximately 50%. The threshold cycle values of miR-223, miR-92, miR-146a and miR-150 in the same subject were 32.11 ± 0.58, 32.50 ± 0.35, 34.30 ± 0.70 and 34.91 ± 0.77, respectively (n = 10). The coefficient of variation values for these miRNAs were 1.08–2.21%. In addition, the standard curve for the quantitative analysis of miRNAs showed high linearity (30–30,000 copies/μL) with a correlation coefficient of >0.99. The concentrations of HDL-miR-223 and HDL-miR-92 in the plasma of 10 subjects were 1.98 ± 0.32 and 0.90 ± 0.14 copies/mL (×104).
Conclusions
We established a simple method for quantifying HDL-miRNAs and improved the sample processing capacity compared with conventional methods.
Introduction
MicroRNAs (miRNAs) are small, non-coding RNAs that regulate gene expression by target messenger RNA cleavage or translational repression. 1 The functions of miRNAs are diverse and include cell development, proliferation, differentiation and apoptosis that are regulated by gene expression at the translational or transcriptional level. 2 Furthermore, miRNAs are being studied as new biomarkers for various diseases such as cancer, myocardial infarction, non-alcoholic fatty liver, Graves' disease and diabetes.3–12
Recently, several studies have shown that miRNAs are present not only in exosomes and microvesicles (MVs) but also in low-density lipoprotein (LDL) and high-density lipoprotein (HDL). These circulating miRNAs are stable in the bloodstream.13–18 Interestingly, Vickers et al. showed that miRNA profiles in HDL are different from those exosomes and that the HDL-microRNA (HDL-miRNA) profile of normal subjects is significantly different from those with familial hypercholesterolaemia. 17 Moreover, Wagner et al. reported that the concentrations of several miRNAs in HDL isolated from patients with acute coronary syndrome are significantly different from that of healthy subjects. 18 Analysing the changes in HDL-miRNA expression profile may lead to new discoveries in miRNA research and disease. Previous studies have mainly analysed miRNAs in whole blood and exosomes.3–12,19,20 Since the amount of HDL-miRNAs is less than 10% of the amount of total miRNAs in the blood, 18 changes in HDL-miRNAs concentrations may be masked by exosome-miRNAs. Therefore, establishing a method for purifying HDL fraction is important for HDL-miRNA analysis.
We have already established a method to purify HDL fraction for quantifying HDL-miRNAs and showed that HDL-miRNAs are relatively stable in various storage conditions. 21 However, this HDL purification method is complex and has low sample throughput because we use a fast-protein liquid chromatography (FPLC) system. Other researchers have also analysed HDL-miRNAs using their own HDL isolation methods. For example, the sequential ultracentrifugation method using solid potassium bromide by Havel et al. requires a long period of time to separate HDL 22 and, as a result, is not useful for clinical applications. In this study, we established a simple analytical method to quantify HDL-miRNAs for clinical applications.
Materials and methods
Sample collection
In each experiment, blood from healthy non-fasting male volunteers was collected in test tubes containing sodium heparin (Terumo Co., Ltd, Tokyo, Japan). Immediately after collection, the plasma was separated by centrifugation at 1700 × g for 10 min at 4°C. Written informed consent was obtained from the volunteers. The study protocol was approved by the Ethics Committee of Fujita Health University (No. 11-101).
HDL purification
Pooled plasma was prepared from the plasma of volunteers. The HDL fraction was purified from the pooled plasma using a three-step protocol consisting of ultracentrifugation, phosphotungstic acid/MgCl2 precipitation and desalting/buffer exchange (Figure 1). First, 250 μL of specific gravity solution (ρ = 1.478 g/mL) prepared with sodium bromide was overlaid on 500 μL of plasma. Following the removal of exosomes, MVs and miRNA-binding proteins from the mixture by ultracentrifugation (657,000 × g, 6 h, 4°C) using an Optima MAX-X (Beckman Coulter, Inc., Brea, CA, USA), 250 μL of the supernatant containing lipoproteins was collected. To remove chylomicron, very low density lipoprotein (VLDL) and LDL, an equal amount of precipitation reagent (phosphotungstic acid/MgCl2 solution) from an HDL-cholesterol E-test Wako kit (Wako Pure Chemical, Osaka, Japan) was added to 250 μL of the supernatant. Next, since excess salt affects quantitative real-time PCR (qRT-PCR), it was removed using Amicon Ultra-0.5 Centrifugal Filter Devices (Merck Millipore, Darmstadt, Germany), and the HDL fraction was replaced with PBS buffer treated with diethylpyrocarbonate (DEPC).
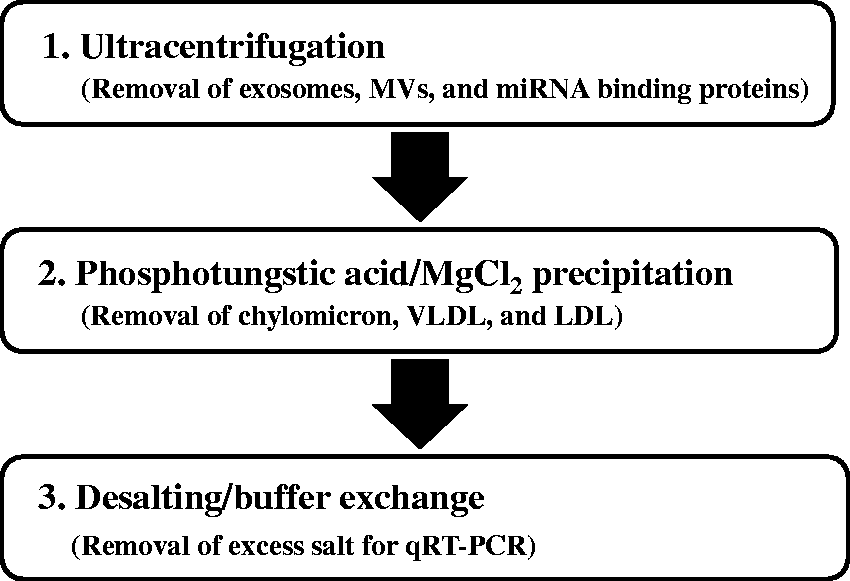
Flowchart for the purification of the HDL fraction.
Measuring the concentrations of HDL-cholesterol, apolipoprotein A-I and apolipoprotein B
The HDL fraction purification step was performed eight times using pooled plasma. The concentrations of HDL-cholesterol (HDL-C) and apolipoprotein A-I (apoA-I) in each step were measured using an HDL-C E-test Wako kit and Apo A-I Auto・N ‘DAIICHI’ (Sekisui medical, Tokyo, Japan). The recovery rate of HDL from plasma was calculated using the HDL-C and apoA-I concentrations from all purification steps. Furthermore, to confirm the presence of chylomicron, VLDL and LDL, the concentration of apolipoprotein B (apoB) (a marker protein for these lipoproteins) was measured using an Apo B Auto N ‘DAIICHI’ (Sekisui medical, Tokyo, Japan). These samples were analysed using an automatic analyser Biolis 24-Prestige 24i (Tokyo Boeki, Tokyo, Japan).
Western blot assay
The protein concentration at each step was measured using a Protein Assay Rapid Kit prior to carrying out sodium dodecyl sulphate-polyacrylamide gel electrophoresis (SDS-PAGE). To detect apoA-I, a marker protein of HDL, the samples from all purification steps were diluted with 2× Laemmli buffer (0.125 M tris-HCl, 4% SDS, 20% glycerol, 10% 2-mercaptoethanol, 0.004% bromophenol blue, pH 6.8) in order to obtain a protein concentration of 1 mg/dL. After boiling for 5 min at 100°C, the samples were left on ice for 5 min. To detect CD63, an exosome marker protein, phenylmethylsulfonyl fluoride (11.5 mM, Wako Pure Chemical, Osaka, Japan) and leupeptin (2.3 mM, PEPTIDE INSTITUTE, INC., Osaka, Japan) were added to 2× Laemmli buffer. The samples from all purification steps and the CD63-positive control were diluted with this buffer, which was similar to the treatment of apoA-I, and boiled for 10 min at 60°C. Next, the treated samples were electrophoresed in a 10% polyacrylamide gel using an AE-7350/W CompactPAGE (Atto Corporation, Tokyo, Japan), and the marker proteins were transferred to a PVDF membrane using an AE-7500 CompactBlot (Atto Corporation, Tokyo, Japan). The membrane was divided into two using scissors, and the two membranes were blocked with Can Get Signal (Toyobo Co., Ltd, Osaka, Japan). All antibodies were purchased from Abcam (Cambridge, UK). Western blotting was performed using an apoA-I antibody (ad17278) or a CD63 antibody (ab118307) diluted at 1 μg/mL and incubated overnight at 4°C followed by 1 h incubation with horseradish peroxidase-conjugated secondary antibody (ab99603 or ab97085) diluted at 1:2000. The two membranes were combined, and the protein bands were detected using a SuperSignal West Pico Chemiluminescent Substrate (Thermo Scientific, Rockford, IL, USA) and visualized using an ImageQuant LAS 4000mini imager (GE Healthcare, Amersham, UK).
miRNA extraction
We used TRIzol reagents (Life Technologies, Carlsbad, CA, USA) to isolate miRNAs in the HDL fraction following the manufacturer’s instructions. The protein from a 300 μL HDL fraction sample was denatured in 900 μL of TRIzol reagent, vortexed immediately for 15 s and then incubated at room temperature for 5 min. Aqueous and organic phases were separated by adding 240 μL of molecular-grade chloroform, vortexing at the maximum setting for 5 s followed by centrifugation at 13,200 × g for 15 min at 4°C. The aqueous phase was rapidly transferred to a new tube. To precipitate the RNA, 20 μg of RNase-free glycogen (Roche, San Francisco, CA, USA) and 600 μL of 100% isopropanol were added to the aqueous phase. The mixture was then incubated at room temperature for 10 min followed by centrifugation at 13,200 × g for 10 min at 4°C. The supernatant was removed, and the remaining RNA pellet was washed. Finally, the total RNA was dissolved in 10 μL of DEPC-treated water and stored at −80°C until further use.
miRNA qRT-PCR analysis
Four miRNAs (miR-223, miR-92, miR-146a and miR-150) that were reported to be present in HDL were quantified by qRT-PCR. The primers were purchased from Qiagen (Hilden, Germany), and their catalogue numbers provided by the manufacturer were MS0000387, MS00006594, MS00003535 and MS00003577 for miR-223, miR-92, miR-146a and miR-150, respectively. miRNA analysis was conducted using a miScript PCR System (Qiagen, Hilden, Germany) that included specific primers for miRNAs and was performed following the manufacturer’s instructions. 23 The reverse transcription (RT) reaction system contained 1 μL of miScript Reverse Transcriptase Mix, 2 μL of 5× miScript HiFlex buffer and 1 μL of 10× Nucleic Mix; the samples were allowed to react for 60 min at 37°C and 5 min at 95°C in a 2720 Thermal Cycler (Applied Biosystem, Foster City, CA, USA) and then diluted with 10 μL of RNase-free Tris-EDTA buffer (pH 7.4). The qRT-PCR reaction system contained 5 μL of SYBR Green PCR Master Mix (Qiagen, Hilden, Germany), 1 μL of miScript universal primer, 1 μL of specific primer, 2 μL of cDNA and 1 μL of RNase-free water. The PCR cycles were performed using the following settings: 95°C for 15 min, 40 cycles at 94°C for 15 s, 55°C for 30 s and 70°C for 30 s. qRT-PCR was performed using an ABI PRISM 7900HT Sequence Detection System (Applied Biosystems, Foster City, CA, USA).
Reproducibility of the HDL-miRNA analysis method
We further investigated the reproducibility of this method. The HDL fraction was purified 10 times using plasma samples obtained from the same subject, and four miRNAs (miR-223, miR-92, miR-146a and miR-150) in HDL were measured in duplicate.
Preparation of a standard curve for the quantification of HDL-miRNAs
In order to establish a method to quantify HDL-miRNAs by qRT-PCR, we prepared standard curves of miR-223 and miR-92, which are abundant in the HDL fraction of healthy subjects. The HDL-miRNAs of 10 subjects were measured. The qRT-PCR products of miR-223 and miR-92 were extracted using an Agarose Gel Extraction kit (Jena Bioscience, Jena, Germany) and were ligated using LigaFast™ Rapid DNA Ligation Systems and T4 DNA Ligase (Promega Corporation, Fitchburg, WI, USA) to a vector (pGEM-T Easy Vector System I; Promega Corporation, Fitchburg, WI, USA). Competent E. coli JM109 (Takara Bio, Shiga, Japan) cells were used in plasmid transformation. After overnight culture, the recombinant plasmids were isolated using a QIAprep Spin Miniprep Kit (Qiagen, Hilden, Germany). The purified plasmid DNA was sequenced using an ABI PRISM 3100 Avant (Applied Biosystems, Foster City, CA, USA). The obtained sequences were compared with known miRNA sequences to confirm that the target sequences were incorporated. The plasmid DNA was quantified using a NanoDrop, 1000 (Thermo Scientific, Rockford, IL, USA), and the copy number was calculated by the concentration and molecular weight of the transcript. The absolute copy number of HDL-miR-223 and HDL-miR-92 was determined by constructing a standard curve from the prepared standards that were diluted with TE buffer (Wako Pure Chemical, Osaka, Japan) to 30–30,000 copies/μL. The quantitative values of miRNAs were expressed in copy number per 1 mL of plasma.
Results
Purification of the HDL fraction
The presence of ApoA-I and CD63 at each step of the HDL purification process was assessed using Western blotting. The band for apoA-I, a main protein in HDL, was detected at approximately 20 kDa at all purification steps (Figure 2); however, the exosomal protein marker CD63 at approximately 35–50 kDa was not. Therefore, the purified sample was regarded as the HDL fraction.
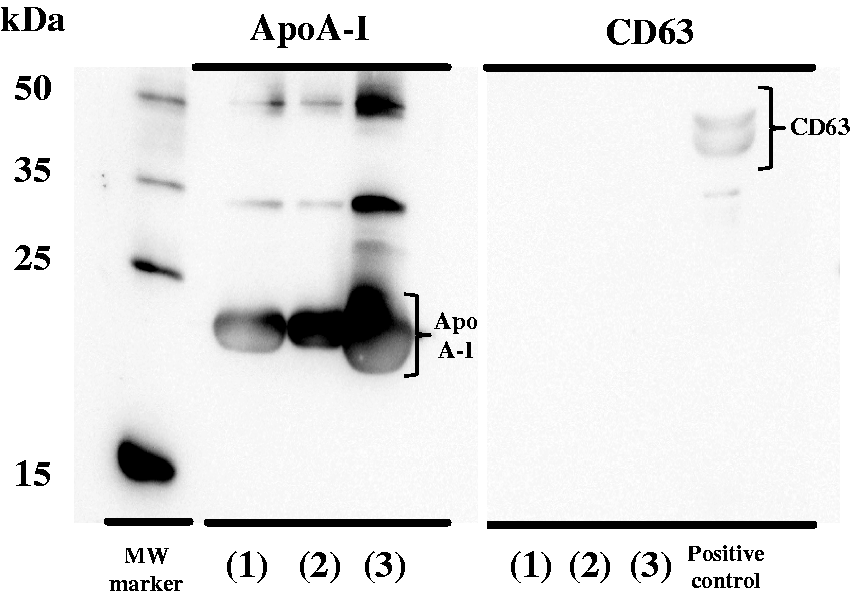
Detection of apoA-I and CD63 by Western blotting. Each HDL purification step: (1) Supernatant of ultracentrifugation, (2) Supernatant after precipitation treatment, (3) HDL fraction.
Concentrations of HDL-C, apoA-I and apoB
The HDL recovery rates were estimated based on the concentrations of HDL-C and apoA-I in each purification step. The recovery rates of HDL-C and apoA-I in the HDL fraction were 51.2 ± 2.4% and 46.7 ± 4.4% (mean ± SD, n = 8), respectively (Table 1). Therefore, the recovery rate of HDL was estimated at approximately 50%. Since the concentration of apoB was below the detection sensitivity in the precipitation step and the HDL fraction, it indicated that most lipoproteins, except for HDL, were eliminated through phosphotungstic acid/MgCl2 precipitation.
Recovery rate from each step in the HDL purification.
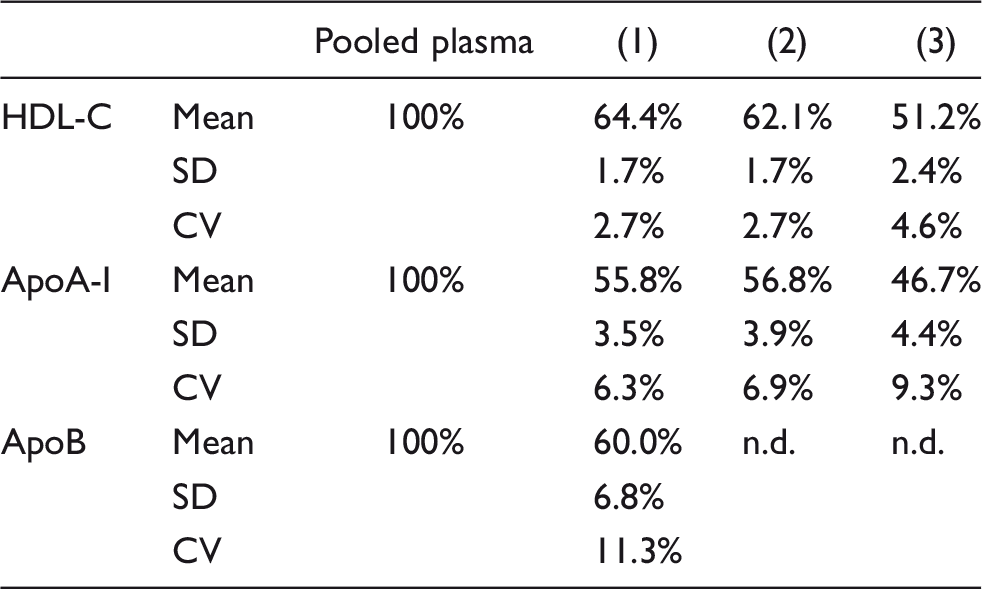
Note: Data are represented as mean, standard deviation (SD), and coefficient of variation (CV). n.d.: not detected.
HDL-C: high-density lipoprotein-cholesterol; ApoB: apolipoprotein B; ApoA-I: apolipoprotein A-I.
aThe purification step of HDL fraction was performed eight times from the pooled plasma (n = 8).
bThe concentrations of pooled plasma HDL-C (HDL-cholesterol), apoA-1, apoB were 69.7, 149.8 and 90.6 mg/dL, respectively.
cEach purification step of the HDL: (1) Supernatant of ultracentrifugation, (2) Supernatant after precipitation, treatment, (3) HDL fraction.
Detection of HDL-miRNAs
We investigated whether HDL-miRNAs could be detected using the newly established HDL purification method. After extracting miRNAs from the HDL fraction, we measured four miRNAs in the HDL fraction by qRT-PCR. The resulting miRNA concentrations are reported in raw threshold cycle (Ct) values and presented as the mean ± SD for four independent experiments. The Ct values for miR-223, miR-92, miR-146a and miR-150 were 32.95 ± 0.71, 32.85 ± 0.62, 35.33 ± 0.68 and 34.54 ± 0.71 (mean ± SD, n = 4), respectively (Figure 3). These results confirmed that miRNAs are retained in the purified HDL fraction and that the values of miR-146a and miR-150 are lower than those of miR-223 and miR-92 in HDL.
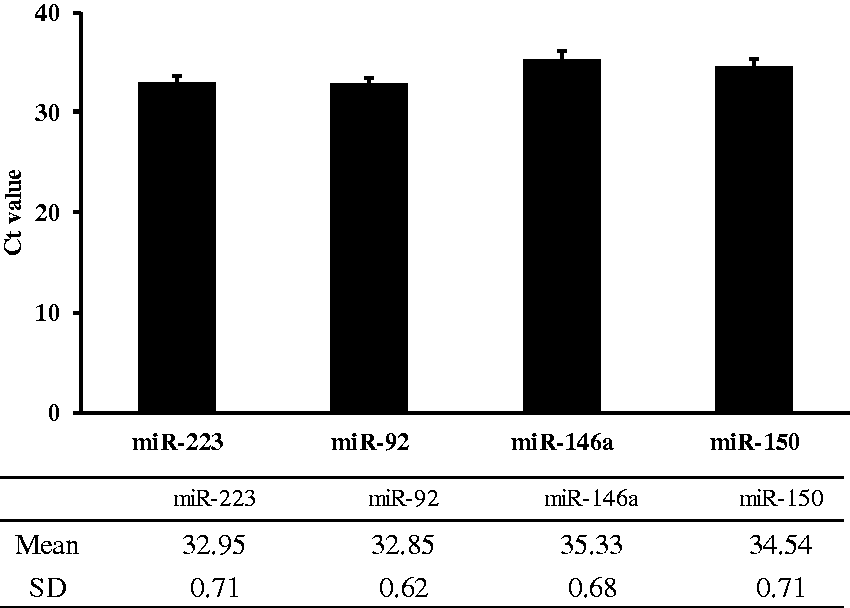
Detection of miRNAs in the purified HDL fraction. Results are represented as raw Ct values. Error bars represent the standard deviation (SD). HDL fractions were purified four times from the pooled plasma (n = 4).
Reproducibility of the HDL-miRNA analysis method
In order to confirm the reproducibility of the HDL-miRNA analysis method, the HDL fraction was purified 10 times using samples from the same subject, and four miRNAs were measured in duplicate. The Ct values of miR-223, miR-92, miR-146a and miR-150 were 32.11 ± 0.58, 32.50 ± 0.35, 34.30 ± 0.70 and 34.91 ± 0.77 (mean ± SD, n = 10), respectively (Table 2). The coefficient of variation (CV) values of each HDL-miRNA were 1.81%, 1.08%, 2.04% and 2.21%, respectively.
Reproducibility of HDL-miRNA analysis method.
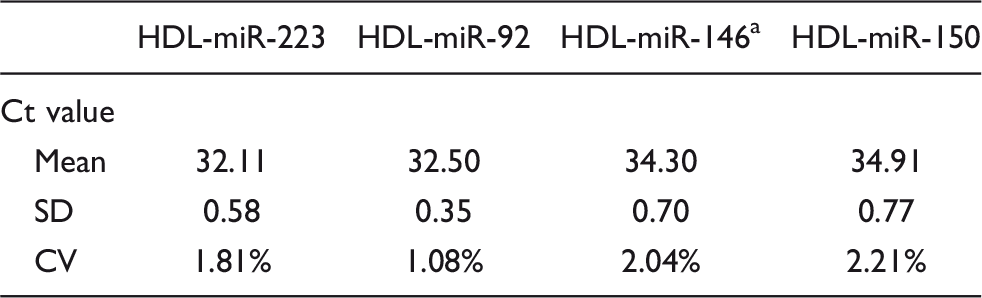
Note: Data are represented as mean, standard deviation (SD) and coefficient of variation (CV).
HDL: high-density lipoprotein.
aThe purification of HDL fraction was performed 10 times from the same subject (n = 10).
Establishing a quantitative method for HDL-miRNAs
As shown in Figure 4(a) and (b), the standard curve exhibited a high linearity between the concentrations of 30 and 30,000 copies/μL for miR-223 and miR-92 (each concentration in duplicate), respectively. The correlation coefficient was > 0.99. In addition, the concentrations of HDL-miR-223 and HDL-miR-92 in 10 subjects were 1.98 ± 0.32 and 0.90 ± 0.14 copies/mL (×104), respectively (Table 3).
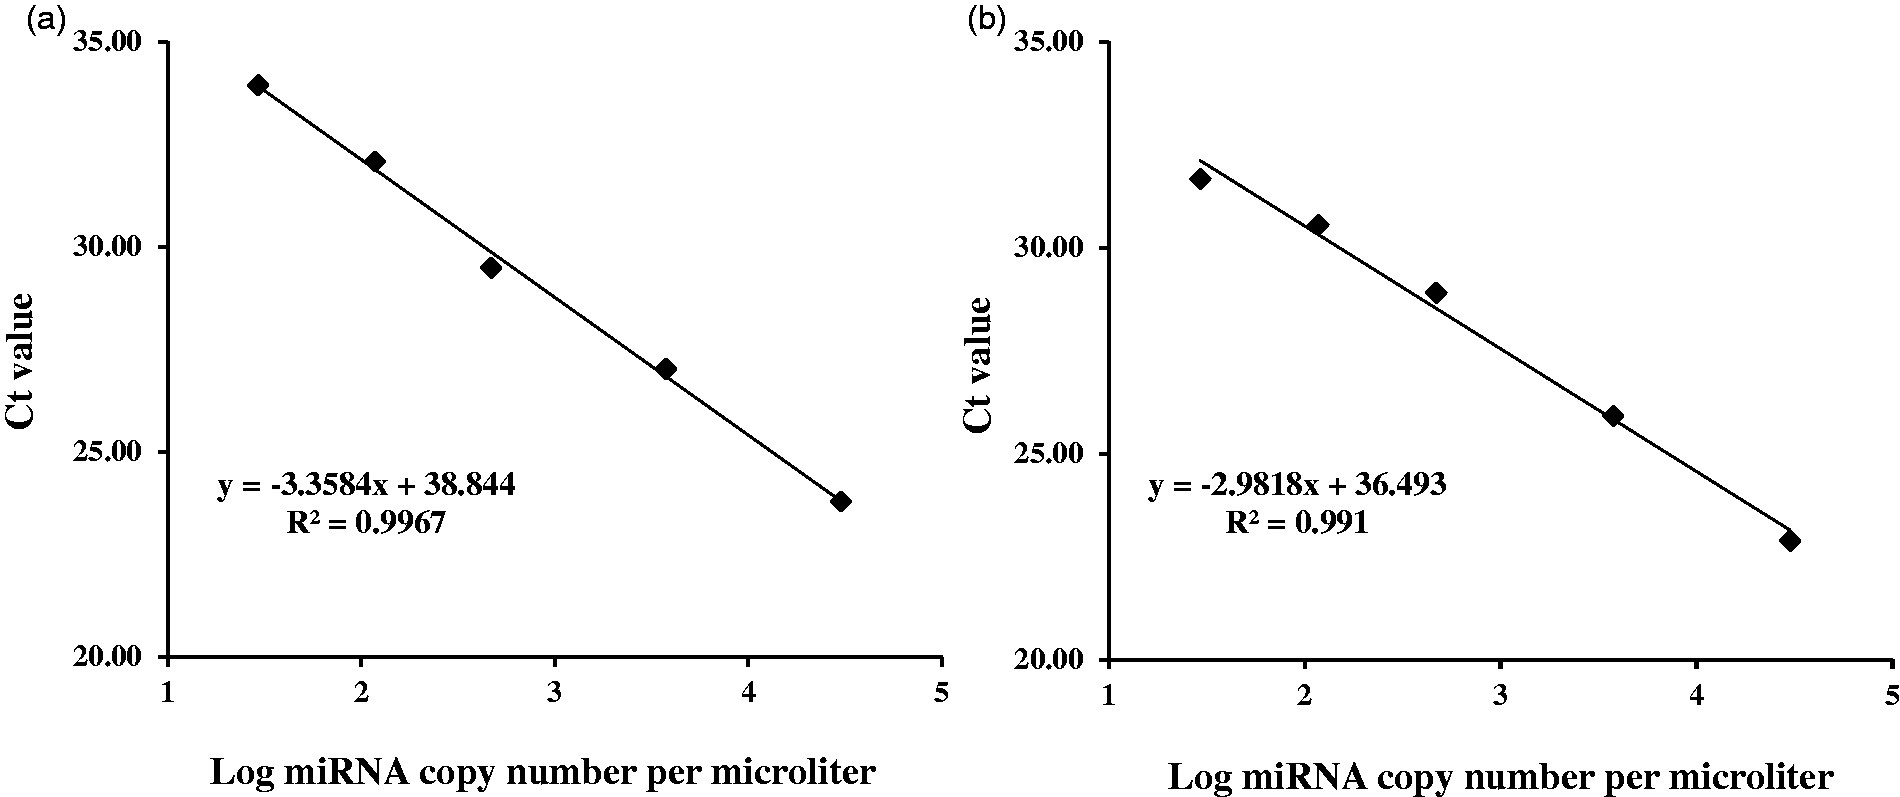
Determination of miRNA copy number. The representative standard curves were constructed for miR-223 (a) and miR-92 (b) using the real-time PCR assay parameters as described in the miRNA qRT-PCR analysis. Each assay was performed in duplicate. Mean values are shown.
HDL-miR-223 and HDL-miR-92 concentrations of 10 subjects.
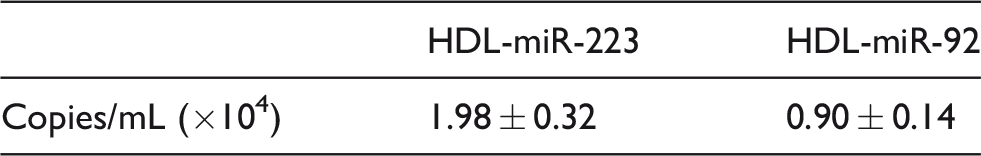
Note: Data are represented as mean ± standard deviation (SD).
HDL: high-density lipoprotein.
aHDL-miR-223 and HDL-miR-92 in 10 subjects were measured (n = 10).
Discussion
miRNA expression patterns may serve as biomarkers for various diseases.3–12 Therefore, measuring miRNAs in carrier molecules, such as exosomes and lipoproteins, may further clarify the relationship between miRNAs and various diseases.17–20 However, since other blood cells contain some miRNAs that are enriched in HDL, the miRNAs need to be quantified prior to the clinical application of HDL-miRNA post-HDL purification. Otherwise, changes in HDL-miRNA concentrations may be difficult to detect.
Previously, we investigated the storage stability of miRNAs in HDL; however, this method requires gel filtration chromatography that limits the sample processing capacity. 21 In addition, various methods for measuring HDL-miRNAs have been reported, but most require density-gradient ultracentrifugation (DGUC).17,18,22 For example, while it is possible to separate chylomicron, VLDL, LDL and HDL by specific gravity, it requires a long ultracentrifugation step. The method reported by Vickers et al. may be complex and time-consuming since it consists of DGUC, dialysis, gel filtration chromatography and immunoprecipitation. 17 In particular, the gel filtration chromatography used in this method cannot process multiple samples simultaneously.
Therefore, we established a novel and simple measurement method for HDL-miRNAs. Since our method does not use gel filtration chromatography, it is possible to measure multiple samples simultaneously. In our method, HDL and other lipoprotein fractions were separated using phosphotungstic acid/MgCl2 precipitation after obtaining all lipoprotein fractions from plasma by ultracentrifugation. Since excess salt in the precipitation reagent affects miRNA measurements during qRT-PCR, desalination and buffer exchange were performed using a centrifugal filter unit; however, the ultracentrifugation step takes 6 h. If a rotor with a smaller K factor is used, the centrifugation time can be shortened.
The amounts of HDL-miRNAs are reported to be less than 10% of total miRNAs. 18 Therefore, if the recovery rate is low, a small amount of miRNAs in HDL will be difficult to measure. The recovery rate of HDL in our method (approximately 50%) was higher compared with the recovery rate of HDL using sequential ultracentrifugation (35.71 ± 2.79%) that was reported by Desgagné et al. 24 Since we were able to measure miR-146a and miR-150 that were reported in trace amounts by Wagner et al., 18 our method may be useful for the analysis of miRNAs. The CV values of HDL-miRNAs calculated from these results were 1.08–2.21%, which suggests that the concentrations of HDL-miRNAs could be reproducibly analysed. Furthermore, miR-223 and miR-92 in HDL could be quantified by preparing standard curves for these miRNAs. However, the limitations of this study include the absence of golden standard assay and standard materials for measuring HDL-miRNAs. Currently, there is no established method for quantifying HDL-miRNAs. Therefore, in the future, both standard assays and materials should be developed for the study of HDL-miRNAs.
In conclusion, we established a simple purification method for quantifying miRNAs in the HDL fraction. The purification time was shorter compared with that of our conventional method, and the processing capacity was improved. By using this method, it may be possible to clarify the relationship between HDL-miRNAs and various diseases.
Footnotes
Declaration of conflicting interests
The authors declared no potential conflicts of interest with respect to the research, authorship, and/or publication of this article.
Funding
The authors disclosed receipt of the following financial support for the research, authorship, and/or publication of this article: This research was funded by Fujita Health University and the Grant-in-Aid for Scientific Research, 2017–2019, No. 17K08996.
Ethical approval
The ethics Committee of Fujita Health University approved the protocol of this study (No. 11–101).
Guarantor
HI.
Contributorship
HI researched literature and wrote the first draft of the manuscript. HI, HY and KO gained ethical approval and conceived this study. RT and TO took the blood sample and prepared the pooled plasma. KK, GM, and MY purified HDL from plasma, extracted the miRNA and measured it. KS measured HDL-cholesterol, apolipoprotein A-I (apoA-I) and apolipoprotein B (apoB). EM and YA performed Western blot analysis. All authors reviewed and edited the manuscript and approved the final version of the manuscript.