
Abstract
Background
Many clinical decisions are based on comparison of patient results with reference intervals. Therefore, an estimation of the analytical performance specifications for the quality that would be required to allow sharing common reference intervals is needed. The International Federation of Clinical Chemistry (IFCC) recommended a minimum of 120 reference individuals to establish reference intervals. This number implies a certain level of quality, which could then be used for defining analytical performance specifications as the maximum combination of analytical bias and imprecision required for sharing common reference intervals, the aim of this investigation.
Methods
Two methods were investigated for defining the maximum combination of analytical bias and imprecision that would give the same quality of common reference intervals as the IFCC recommendation. Method 1 is based on a formula for the combination of analytical bias and imprecision and Method 2 is based on the Microsoft Excel formula NORMINV including the fractional probability of reference individuals outside each limit and the Gaussian variables of mean and standard deviation. The combinations of normalized bias and imprecision are illustrated for both methods. The formulae are identical for Gaussian and log-Gaussian distributions.
Results
Method 2 gives the correct results with a constant percentage of 4.4% for all combinations of bias and imprecision.
Conclusion
The Microsoft Excel formula NORMINV is useful for the estimation of analytical performance specifications for both Gaussian and log-Gaussian distributions of reference intervals.
Keywords
Introduction
Analytical performance specifications (APS) for the maximum allowable analytical bias and imprecision, and combinations of these, that were appropriate for use of common reference intervals across laboratories were proposed by Gowans et al. 1 This model was based on the recommendation for the establishment of population-based reference intervals of the International Federation of Clinical Chemistry (IFCC). 2 The aim of the proposal was to define the APS for the analytical quality that would be required to allow sharing common reference intervals among homogeneous populations. The concept was that a single high-quality laboratory should establish the reference interval from a large population of apparently healthy reference individuals, where the term ‘reference interval’ is considered as the combined within- and between-subject biological variation, sB, excluding the analytical imprecision.
This interval could then be used by other laboratories with similar populations, if they could attain or surpass these APS. This would ensure that all laboratories could use a reference interval which was within the IFCC-recommended 90% confidence interval (CI) for the upper and lower reference limits, which is based on 120 individuals.
The derivation of the 90% CI for both the upper and lower reference limits according to the IFCC recommendation was based on the formula, CI = ± (2.81·sB)/N½, where sB is the standard deviation of a reference interval with a Gaussian distribution and N is the number of reference individuals (minimum 120). 2 This is equal to 0.25·sB, which was determined as the maximum allowable numerical bias when imprecision was negligible. 1 Thus, the limits for the 95% reference interval are ±1.96·sB ± 0.25·sB (± 1.71·sB to ±2.21·sB), yielding a maximum of 4.4% of the reference individuals outside both of the reference limits. The basic concept was to determine the combination of analytical bias and imprecision that would keep the maximum percentage of reference individuals outside each reference limit to no more than that obtained when the IFCC recommendation was applied. The purpose of this investigation was to find a method for the combination of analytical bias and imprecision according to the IFCC recommendation for parametric reference intervals based on the minimum useful number of reference individuals that would keep the maximum percentage of reference individuals outside each reference limit to the theoretically correct 4.4% for both reference distributions: ‘Original scale’ (Gaussian distribution) and ‘Logarithmic scale’ (ln-Gaussian distribution).
Methods
Two methods were examined for the combination of analytical bias and imprecision that would keep the maximum percentage of reference individuals outside each reference limit to 4.4%. All calculations were performed using Microsoft Excel 2013.
Method 1
A formula suggested for the maximum combination of analytical bias and imprecision (sA), which was assumed to give a constant maximum of false-positive of 4.4% was presented in 2001
3

Method 2
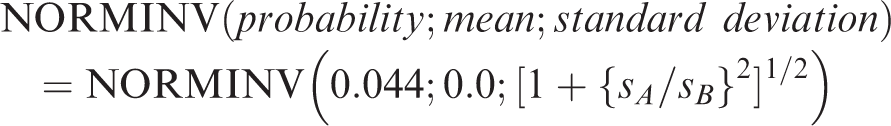
A formula for the probability, P, that the percentage of combined |bias| and sA that would keep the maximum percentage of reference individuals outside each reference limit to 0.044 (4.4%). This function can be calculated using Microsoft Excel 2013 with the function for Gaussian distributions with normalized values
Results
The functions of the two methods for combined bias and imprecision are shown in Figure 1 with normalized imprecision as function of normalized bias.
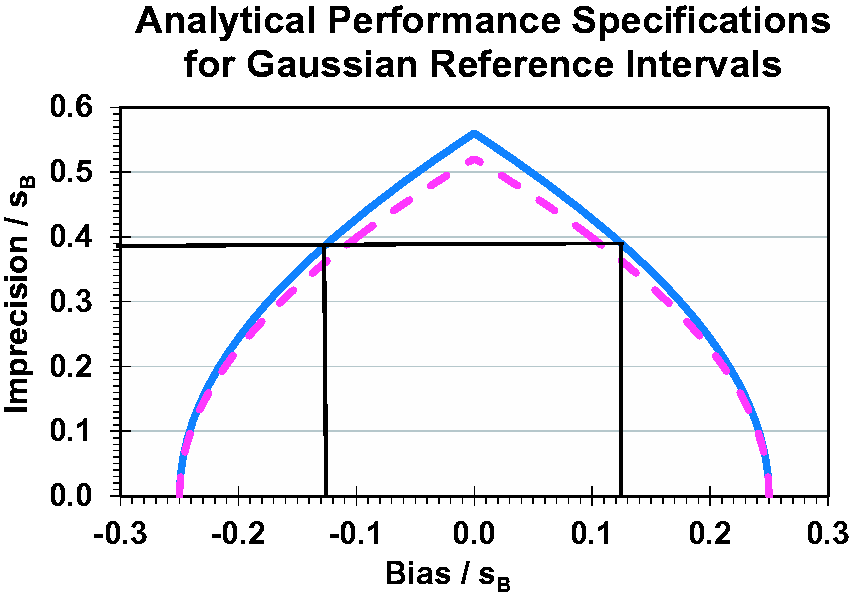
Analytical performance specifications for reference intervals with constant 4.4% of apparently healthy reference individuals outside both reference limits for each combination of bias and imprecision (method 2, blue graph). Relationships between analytical bias (abscissa) and imprecision (ordinate) are shown normalized, that is, both are divided by the biological standard deviation of the Gaussian reference interval, sB (excluding the analytical imprecision). For Gaussian distributions, bias and imprecision are measured in concentration units and for ln-Gaussian distributions in the corresponding natural logarithmic units. The black lines illustrates the example with serum magnesium treated as ln-Gaussian with σB = 0.070, and the analytical imprecision, CVA = 0.027 (2.7%), then σA = {ln[(0.027)2 + 1]}½ = 0.027 and σA/σB = 0.027/0.0700 = 0.386 (ordinate) and the corresponding bias, bias/σB is ±0.127 (abscissa) equal to 0.127·0.0700 = 0.00889 which transforms to fractional bias by exp(0.00889)−1 = 0.00893 or 0.89%. The dotted purple graph (method 1) represents the function according to the formula. 3
Method 1
The dotted purple graph in Figure 1 represents the function according to the formula. 3 The maximum sA/sB is 0.52 for bias equal to zero and with the percentage outside the reference limit 4.1%.
Method 2
The solid blue graph in Figure 1 represents the function according to the Gaussian distributions: NORMINV(probability;mean;standard deviation). The maximum sA/sB is 0.56 for bias equal to zero and with the percentage outside the reference limit 4.4%, and therefore this is the correct method.
Discussion
The shapes of the curves are rather close, but Method 2, with the formula NORMINV(probability;mean;standard deviation), is correct with the result of 4.4%, and thus the blue graph in Figure 1 is correct, fulfilling the original purpose of keeping the maximum percentage of healthy individuals outside the reference limits constant. 1
However, importantly, most population-based reference intervals are skew and calculations should more correctly be done after transformation to logarithms, often described as natural logarithmic (ln-Gaussian) distributions. This means that the logarithmic data can also be described as in Figure 1, and the logarithmic standard deviation (σ) can be related to the coefficient of variation by the formula CV = (exp{σ 2 }−1)½ from Fokkema et al. 4 and the transformed formula σ = {ln[(CV) 2 + 1]}½ from Lund et al. 5 This is demonstrated in the following example.
Example
One example of this new valid approach can be constructed from data generated in the Nordic Reference Interval Project 2000 6 for serum magnesium with reference interval 0.71–0.94 mmol/L and ln-Gaussian interval –0.342 to –0.061. This project on the derivation of common reference intervals was based on 3000 apparently healthy individuals; however, the analytical imprecision was not documented, so a CVA of 0.015 (1.5%) has been assumed for this example; in consequence, the standard deviation, including imprecision, is 0.281/3.92 = 0.0716, and with subtraction of imprecision is 0.0700, which gives the maximum |bias| = 0.0700· 0.25 = 0.0175 and exp(0.0175)−1 ∼ 1.77%, and maximum imprecision σA = 0.0700· 0.56 = 0.0392 and CVA = (exp(0.03922)−1)½ ∼ 3.92% (the difference is negligible for small values, i.e. when CVA < 10%). If the CVA of a laboratory is 0.027 (2.7%), then σA = {ln[(0.027)2 + 1]}½ = 0.027 and σA/σB = 0.027/0.0700 = 0.386. Then, the allowable ln-bias is ± 0.127 calculated or read from Figure 1 and, when multiplied with σB, equal to 0.127· 0.0700 = 0.00889 which transforms to fractional bias by exp(0.00889)−1 = 0.00893 or 0.89%.
Footnotes
Declaration of conflicting interests
The author(s) declared no potential conflicts of interest with respect to the research, authorship, and/or publication of this article.
Funding
The author(s) received no financial support for the research, authorship, and/or publication of this article.
Ethical approval
Not applicable.
Guarantor
PHP.
Contributorship
PHP wrote the first draft of the manuscript. All authors contributed to the generation of the manuscript.
Appendix
References
Supplementary Material
Please find the following supplemental material available below.
For Open Access articles published under a Creative Commons License, all supplemental material carries the same license as the article it is associated with.
For non-Open Access articles published, all supplemental material carries a non-exclusive license, and permission requests for re-use of supplemental material or any part of supplemental material shall be sent directly to the copyright owner as specified in the copyright notice associated with the article.