
Abstract
Background
Some iodinated radio-contrast media absorb ultraviolet light and can therefore be detected by capillary zone electrophoresis. If seen, these peaks are typically small with ‘quantifications’ of below 5 g/L. Here, we describe the detection of a large peak on capillary zone electrophoresis that was due to the radio-contrast agent, Omnipaque™.
Methods
Serum from a patient was analysed by capillary zone electrophoresis, and the IgG, IgA, IgM and total protein concentrations were measured. The serum sample was further analysed by gel electrophoresis and immunofixation.
Results
Capillary zone electrophoresis results for the serum sample showed a large peak with a concentration high enough to warrant urgent investigation. However, careful interpretation alongside the serum immunoglobulin concentrations and total protein concentration showed that the abnormal peak was a pseudoparaprotein rather than a monoclonal immunoglobulin. This was confirmed by analysis with gel electrophoresis and also serum immunofixation. The patient had had a CT angiogram with the radio-contrast agent Omnipaque™; addition of Omnipaque™ to a normal serum sample gave a peak with comparable mobility to the pseudoparaprotein in the patient’s serum.
Conclusions
Pseudoparaproteins can appear as a large band on capillary zone electrophoresis. This case highlights the importance of a laboratory process that detects significant electrophoretic abnormalities promptly and interprets them in the context of the immunoglobulin concentrations. This should avoid incorrect reporting of pseudoparaproteins which could result in the patient having unnecessary investigations.
Introduction
Serum protein electrophoresis plays a key role in the investigation of suspected B-cell malignancy. The presence of a serum paraprotein is one of the diagnostic criteria for multiple myeloma and is often the first abnormal laboratory finding specific to a B-cell dyscrasia. 1 The presence of a paraprotein in a patient with clinical findings consistent with myeloma warrants referral to Clinical Haematology via the Suspected Cancer Pathway. 2 Further investigations may include additional blood and urine tests, magnetic resonance imaging or computer tomography (CT) scans and invasive procedures, e.g. bone marrow aspirate and trephine biopsy. Early diagnosis of multiple myeloma is associated with better outcomes. 3 This is facilitated by sound laboratory practices and good communication between the laboratory and requesting clinician.
Serum protein electrophoresis involves the separation of proteins by charge, either on an agarose gel with detection by dye binding, or by capillary zone electrophoresis (CZE). CZE involves applying a high voltage to the sample as it passes through a thin silica capillary in alkaline buffer. Protein concentration is quantified over time by measuring ultraviolet (200 nm) absorbance at the cathodic end of the capillary, as peptide bonds absorb at this wavelength. Any other substances in the sample that also absorb at this wavelength may be detected as an abnormal peak if present at concentrations above 0.5 g/L. 4
Iodinated radio-contrast media, e.g. iohexol, iopamidol and some antibiotics, e.g. piperacillin-tazobactam, can give abnormal peaks (often <5 g/L) and appear anywhere from the alpha-1 region to the gamma region.5,6 Here, we report the presence of an abnormal peak that was large enough to prompt urgent further investigation of the sample, but was a pseudoparaprotein.
Materials and methods
IgG, IgA and IgM concentrations were measured by rate nephelometry on an Immage analyser (Beckman Coulter (UK) Ltd, High Wycombe, UK). Serum protein electrophoresis was run on Capillarys 2 CZE (Sebia, Camberley, UK) and also on agarose gel (Hydragel 15HR, Sebia) using the Hydrasys system (Sebia). Serum total protein was measured by Biuret method on a Cobas MIRA (Roche Diagnostics Ltd, Burgess Hill, UK). Serum immunofixation was run on the Hydrasys system (Hydragel 2IF/BJ(HR) gels; antibodies to IgG, IgA, IgM, kappa and lambda; Sebia).
Omnipaque™ (300 mg iodine/mL; GE Healthcare, Chalfont St Giles, UK) was added to normal patient serum before analysis.
Results
A sample from a patient was sent to the laboratory for immunoglobulin measurement and serum protein electrophoresis. The CZE results (Figure 1(a)) showed a large peak of 28 g/L in the alpha-2 region. Our standard protocol for the finding of new large paraproteins is to quantify the band, identify the likely heavy chain type based on immunoglobulin concentrations and issue a preliminary report to the requesting clinician and haematologist. Immunofixation of the sample is prioritized. The paraprotein band of 28 g/L was inconsistent with a serum total protein concentration of 61 g/L and normal immunoglobulin concentrations. Therefore, all analyses were repeated to exclude a sample loading error or random analytical error; identical results were obtained.
Serum samples were analysed by capillary zone electrophoresis. Relevant immunoglobulin and total protein concentrations are shown below the corresponding electropherogram. (a) A sample was collected on the same day as CT angiogram and shows a large abnormal peak (black), with migration co-ordinates x = 170 (albumin peak x = 84). (b) A normal serum sample was spiked with Omnipaque™ to give a final dilution of 1/50 and shows an abnormal peak in the alpha-2 region (black arrow) with migration co-ordinates x = 176 (albumin peak x = 87). (c) A sample was collected five days after CT angiogram and shows no abnormality.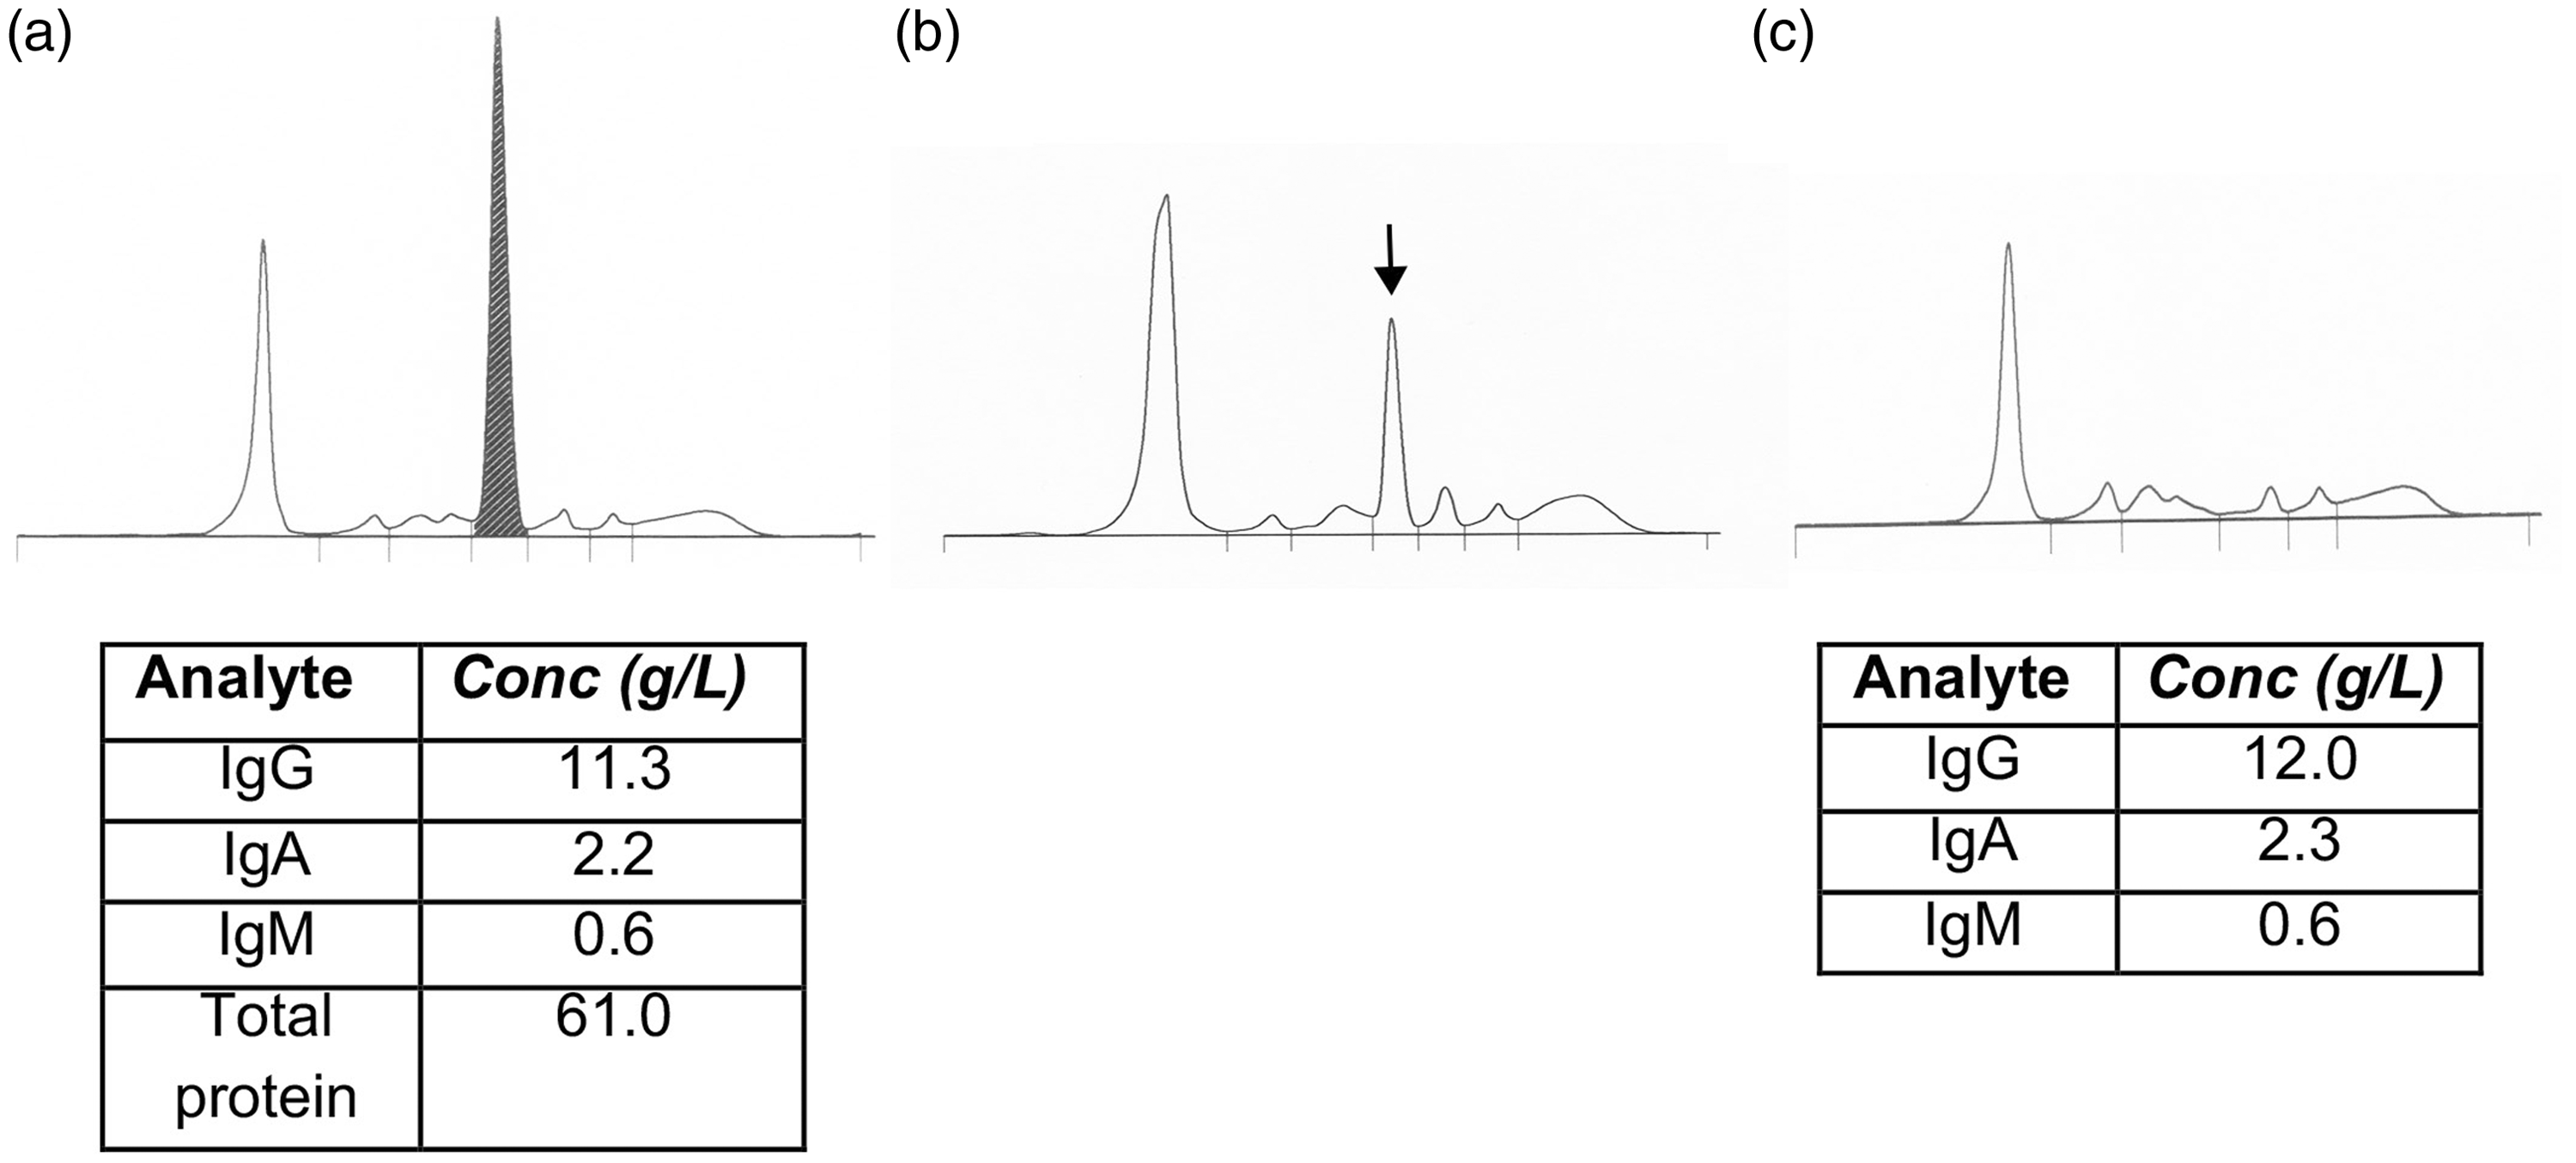
At this point, it was suspected that the large paraprotein was an artefact. The sample was analysed by gel electrophoresis and this showed a normal pattern (Figure 2). Consistent with this, serum immunofixation showed no paraprotein (results not shown).
Serum samples were analysed by agarose gel protein electrophoresis. A normal serum sample quality control (lane 1) and the patient’s original sample (lane 2) are shown.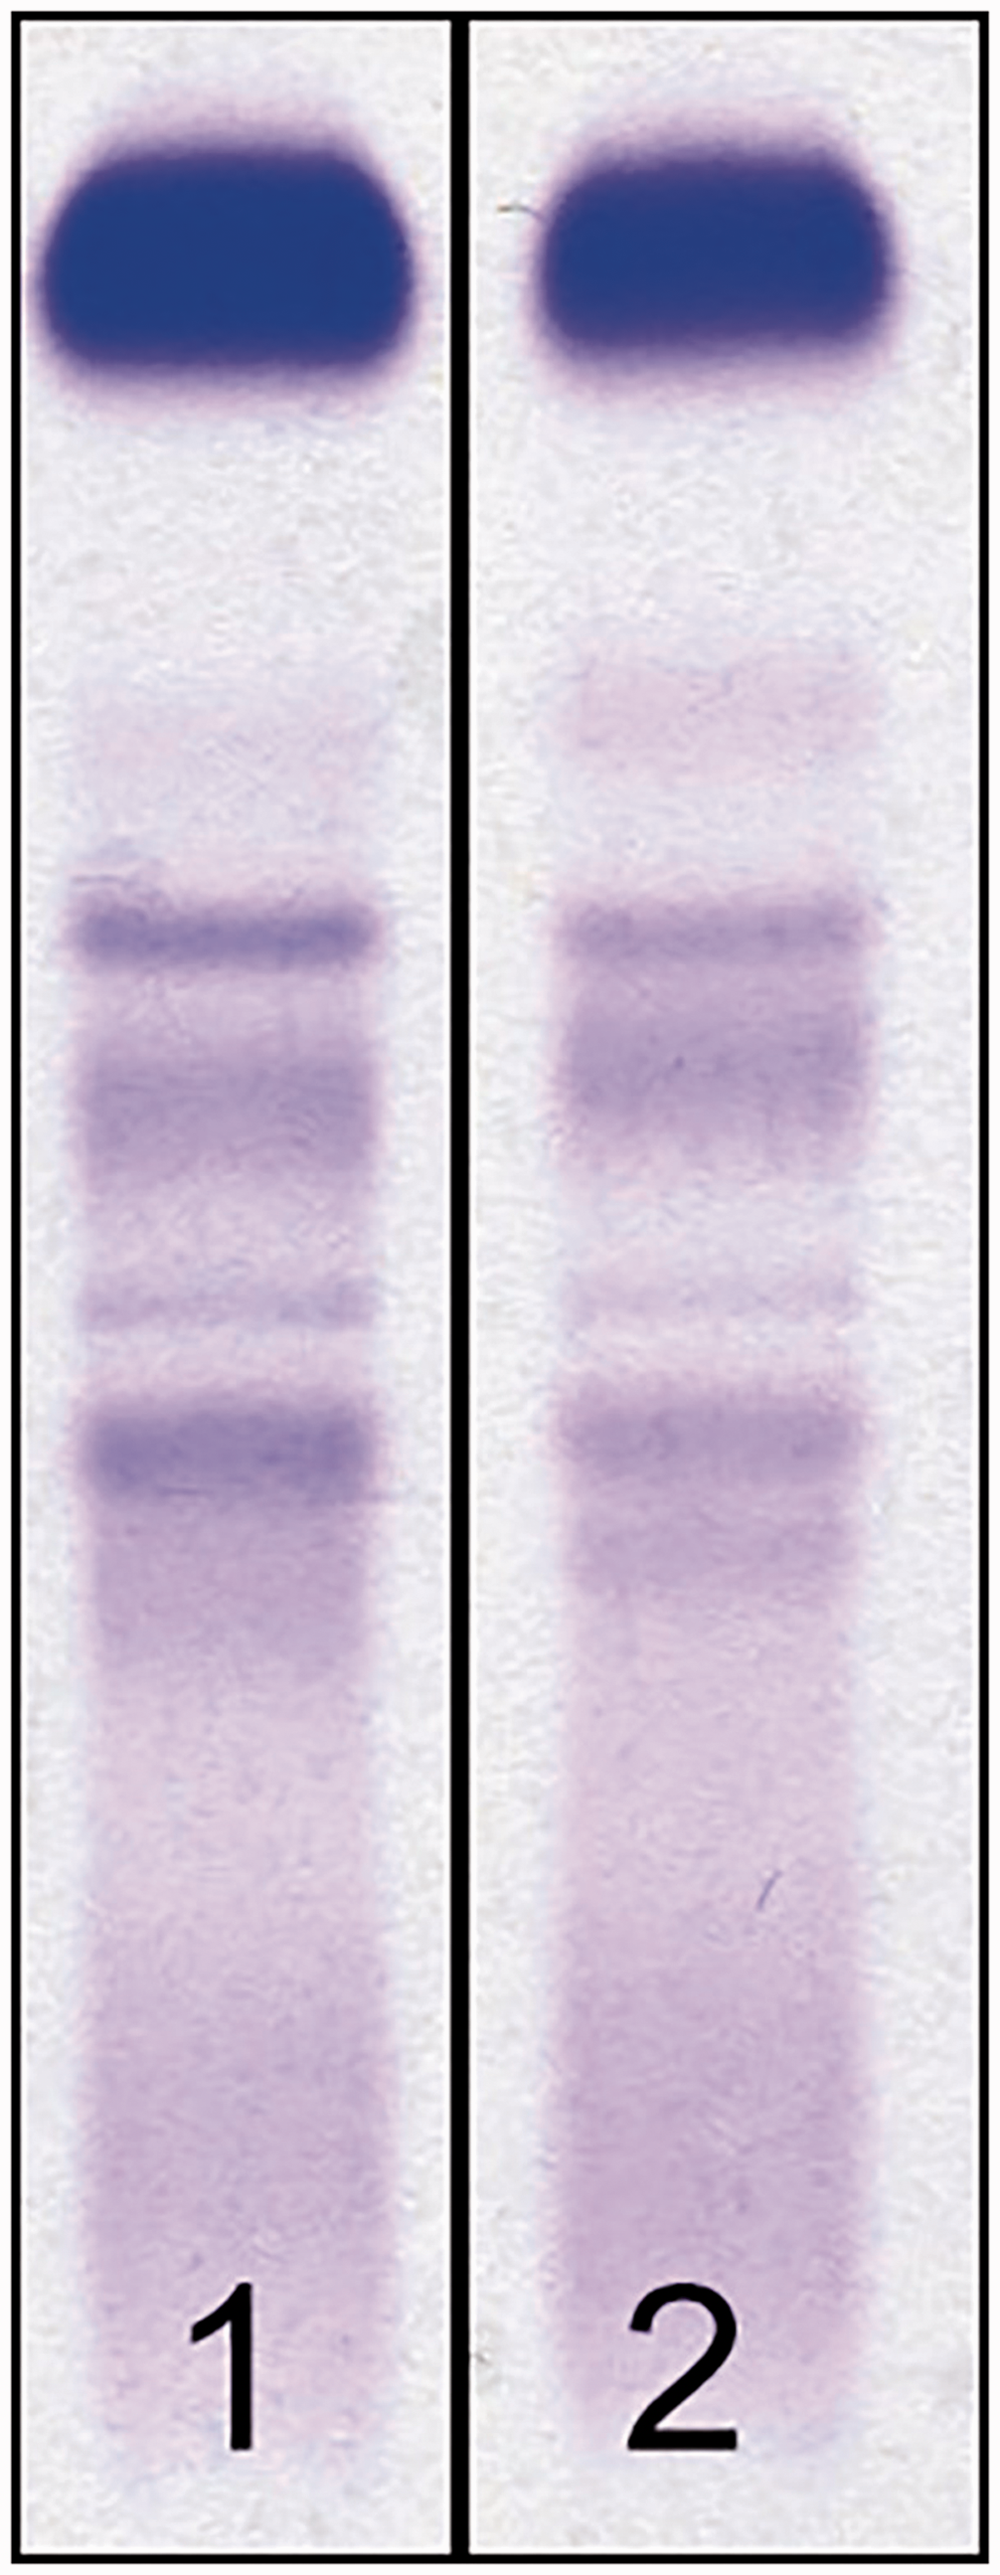
We reviewed the patient's notes. On the date of the sample, the patient had a CT angiogram with 100 mL Omnipaque™ (containing Iohexol) contrast given intravenously. To demonstrate that the abnormal peak could have been due to Omnipaque™, we spiked a normal serum sample with Omnipaque™ to give a final dilution of 1/50, comparable to the dose given to the patient. This resulted in an abnormal peak in the alpha-2 region with the same electrophoretic migration as the abnormal peak seen in the patient’s sample (Figure 1(b)).
The patient had normal renal function, and as Omnipaque™ has an in vivo half-life of 121 min, the contrast agent would be expected to reach undetectable levels on CZE after approximately 8–12 h. A further sample from the patient was tested five days later. This gave a normal electrophoretic pattern and similar immunoglobulin concentrations to the first sample (Figure 1(c)).
Discussion
Certain substances, including radio-contrast media and antibiotics, are known to cause small artefactual peaks on CZE because they absorb at the detection wavelength (200 nm). Here, we show that Omnipaque™ can be detected as a large peak of apparently 28 g/L. The peak was in the alpha-2 region, which is consistent with previous findings. 5 It is worth noting that in almost 20 years of running serum protein electrophoresis by CZE, this is the largest ‘artefactual’ paraprotein we have ever seen, although we do frequently see small bands most likely related to antibiotics.
This report highlights a number of important factors for the diagnostic laboratory. Firstly, protein electrophoresis results must be interpreted in the context of immunoglobulin and total protein concentrations. If results are obtained that are apparently inconsistent, laboratories must consider all possible causes including laboratory error and substances that can appear as pseudoparaproteins on CZE. 6
Secondly, it is vital that a suspected pseudoparaprotein is confirmed by gel electrophoresis and serum immunofixation; the peak will be absent by both methods if it is not a protein, or will be present on gel electrophoresis but absent on serum immunofixation if it is a non-immunoglobulin protein, e.g. fibrinogen.
It has been recommended that samples for protein electrophoresis are not taken until more than 24 h after iodinated contrast agent is given, as even with normal renal function, abnormal results can be seen up to 24 h later. 7 In this case, the sample was taken on the same day as the CT angiogram and although the time of sample collection was not recorded, the size of the peak in comparison with the spiked sample suggests that it was taken immediately after the CT angiogram. There are methods for removing interference, e.g. desalting samples, charcoal pre-treatment, analysis at two different wavelengths, but they are not routinely available and should not be necessary with good laboratory practice.5,8,9
This case highlights the importance of laboratories having robust processes in place to interpret serum protein electrophoresis patterns and to sense check results before communicating significant abnormalities. Otherwise, erroneous reporting of the presence of a paraprotein could lead to patients having unnecessary and invasive investigations.
Footnotes
Declaration of competing interests
The author(s) declared no potential conflicts of interest with respect to the research, authorship, and/or publication of this article.
Funding
The author(s) received no financial support for the research, authorship, and/or publication of this article.
Ethical approval
Not applicable.
Guarantor
JS.
Contributorship
RDW and JS identified the case and analysed the samples. LZ provided clinical information and contrast agent. RDW wrote the first draft of the manuscript. All authors reviewed and edited the manuscript and approved the final version of the manuscript.