
Abstract
Background
Non-invasive methods for assessing liver fibrosis are increasingly used as an alternative to liver biopsy. Recently, a score-based biochemical blood test (Coopscore©) was developed in a cohort of patients chronically infected with hepatitis C virus, showing higher diagnostic performances than Fibrometer®, Fibrotest®, Hepascore® and Fibroscan™. Here, we assess its performance in patients co-infected with the human immunodeficiency virus and hepatitis B virus.
Methods
Ninety-seven human immunodeficiency virus/hepatitis B virus co-infected patients with liver biopsies were included from a previously described cohort. Histological fibrosis staging using METAVIR criteria was used as the reference. Coopscore©, Fibrotest®, Fibrometer®, Hepascore® and Zeng score were computed and compared with the Coopscore© using the Obuchowski index and area under the receiving operator characteristic curves.
Results
The distribution of liver fibrosis levels was as follows: F0–F1 (n = 42), F2 (n = 25), F3 (n = 15) and F4 (n = 15). The Obuchowski index was higher for Coopscore© (0.774) than Fibrometer® (0.668), Hepascore® (0.690) and Zeng scores (0.704) (P < 0.05), reflecting a better ability to discriminate between fibrosis stages. Similarly, when predicting significant fibrosis (≥F2), the AUROC was significantly greater for the Coopscore© (0.836) than the Hepascore® (0.727) and Zeng scores (0.746), but not for the Fibrotest® (0.778, P = 0.14) or Fibrometer® (0.790, P = 0.19). The Coopscore© did not show a higher capacity than other scores to predict advanced fibrosis (≥F3) or cirrhosis (F4).
Conclusions
This study supports the diagnostic value of the Coospcore© in fibrosis staging among human immunodeficiency virus/hepatitis B virus co-infected patients, especially to predict significant fibrosis.
Introduction
Approximately 5–10% of HIV-infected persons are also chronically infected with hepatitis B virus (HBV). 1 HIV infection worsens the prognosis of chronic HBV infection by accelerating the progression of fibrosis to cirrhosis and increasing the incidence of hepatocellular carcinoma. 2 Emerging epidemiological evidence in HBV mono-infected patients has demonstrated a decreased risk of hepatocellular carcinoma (HCC) during treatment with highly potent anti-HBV agents. In addition, early therapy with dual anti-HIV and anti-HBV activity, such as tenofovir (TDF), considerably decreases the incidence of liver cirrhosis. 3 Consequently, the European AIDS Clinical Society has recommended that potent anti-HBV treatment should be given to all HIV/HBV co-infected patients. Nevertheless, liver fibrosis remains stable for the majority of patients during long-term TDF-containing antiretroviral therapy 4 and HCC can still occur while undergoing this treatment regimen,5,6 supporting the need to routinely assess liver fibrosis as part of clinical management.
Liver biopsy is currently the reference for assessing liver fibrosis. It has, however, many disadvantages, such as poor compliance from patients, need for hospitalization and increased risk of complications. In addition, substantial intra and inter-observer variability and sampling error is known to occur. 7 Non-invasive approaches have been increasingly used for fibrosis assessment, including transient elastography (TE) and biochemical blood tests (i.e. Fibrotest®, Fibrometer® and Hepascore®).8–11 These tests were developed and validated in patients with chronic hepatitis C virus (HCV) infection,8–12 but less studied for other liver diseases. Some evidence has pointed to reduced diagnostic accuracy in HIV–HCV co-infected versus HCV mono-infected patients, stressing the need to validate these scores in co-infected populations.13–15 In HIV/HBV co-infected patients, diagnostic performances of non-invasive markers have been evaluated and generally showed that Fibrometer®, Fibrotest®, Hepascore® and Zeng score were the most accurate blood tests for assessing liver fibrosis. 16
Recently, a novel score-based blood test, Coopscore©, was developed in a cohort of patients with chronic HCV and included five parameters: alpha-2-macroglobulin, apolipoprotein-A1, aspartate aminotransferase (AST), collagen IV and osteoprotegerin, a bone mass regulating protein altered during liver diseases.17–19 In this cohort, the Coopscore© provided a more accurate diagnosis in overall staging of liver fibrosis and significant fibrosis when compared with other validated biochemical scores (Fibrotest®, Fibrometer® and Hepascore®). 20 Therefore, we aimed to assess the diagnostic performance of Coopscore© among HIV–HBV co-infected patients participating in a multicentre prospective study. 21 The Coopscore© was compared with other biochemical scores demonstrating high predictive capacity in this context (i.e. Fibrotest®, Fibrometer®, Hepascore® and Zeng’s score). 16
Material and methods
Patients and study design
Patients included in the present study were taking part in a previously described prospective cohort. 21 The study was approved by the Institutional Review Board at Pitié-Salpêtrière Hospital (Paris, France) in compliance with the Helsinki Declaration. Signed written informed consent was obtained from each patient.
Briefly, 308 HIV/HBV co-infected patients from seven French outpatient clinics were enrolled between May 2002 and May 2003. Patients were included if they had two consecutive HIV serological tests (confirmed by Western blot) and chronic hepatitis B (CHB) infection (defined as two consecutive hepatitis B surface antigen positive results at least six months apart). Data collection continued until 2011–2012. In the present study, we included patients with available liver biopsy staging. Patients were not included if they did not have available stored serum samples and/or had positive anti-HCV serology.
Pathological examination of liver biopsy
Patients were offered liver biopsy at inclusion or during follow-up based on concomitant recommendations from the European Association for the Study of the Liver. 22 Liver biopsy specimens were embedded in paraffin, stained with haematoxylin–phloxin–saffron and picrosirius red and analysed independently by two pathologists blinded to all clinical and biological data except for the diagnosis of chronic HBV infection. Liver fibrosis was assessed according to the METAVIR scoring system: F0 = no fibrosis; F1 = portal fibrosis without septa; F2 = portal fibrosis and few septa; F3 = numerous septa without cirrhosis; F4 = cirrhosis. 23 In case of discrepancy, digital images from glass slides were re-examined by two pathologists and a consensus was reached. The presence of significant fibrosis, advanced fibrosis, and cirrhosis were defined as METAVIR levels ≥F2, ≥F3 and at F4, respectively.
Blood samples
Fasting blood samples were collected by venipuncture during regular study visits in the French HIV–HBV cohort. Samples were immediately separated and aliquoted after blood draw. Routine serum biochemical concentrations were measured using standard procedures at study site laboratories within one week of sample collection. All samples were frozen within 24 h and stored at −80℃.
Of the parameters evaluated, only collagen IV and osteoprotegerin (OPG) were assayed on stored serum samples (not previously thawed). Assays were performed at a single laboratory (Saint-Antoine Hospital, Paris, France) from 2011 to 2012.
All biological tests were undertaken blind to clinical and histological data. For this study, only stored samples collected within six months from liver biopsy were considered.
Test procedures
Serum collagen IV was measured using an immunoenzymatic assay with precoated plates (Serum Collagen IV EIA, Argutus Medical, Dublin, Ireland; intra-assay coefficient of variation: 6.2%, inter-assay coefficient of variation: 9.6%, measuring range: 15.6–1000 µg/L). Serum OPG was measured using an ELISA assay (Human OPG/TNFRSF11B, RD systems, Minneapolis, USA; intra-assay coefficient of variation: 5.1%, inter-assay coefficient of variation: 11.1%, measuring range: 0.0625–4 µg/L). Hyaluronic acid (HA) was measured by an enzyme linked protein binding assay (HA Test Kit, Corgenix, Westminster, USA).
Specific proteins (α2-macroglobulin [A2M], haptoglobin, apolipoprotein A1) were measured by immunonephelemetric methods using a BN2 analyzer (Siemens Healthcare Diagnostics, Deerfield, USA). Gamma-glutamyl transpeptidase (GGT), alanine aminotransferase (ALT), AST (IFCC methods at 37℃ with pyridoxal phosphate for ALT and AST) and total bilirubin were measured using an Olympus AU400 analyzer (Beckman Coulter, Brea, USA) with reagents from the manufacturer and calibration by CFAS (Calibrator for Automated Systems, Roche Diagnostics).
Fibrosis scores
We used several scores selected a priori that have high diagnostic capacity in HIV–HBV co-infected patients. A summary of the biochemical parameters included in these scores, as well as their already validated cut-offs at various levels of fibrosis, is provided in Supplementary Table 1.
Coopscore©
The Coopscore© was directly computed from obtained results using the previously published model 20 : CS = 1/(1 + exp (−(−1.856 + 1.216 × lnA2M (g/L) + 0.007 × C-IV (µg/L)−1.047 × ApoA1 (g/L) + 0.451 × ln OPG (µg/L) + 0.005 × AST (IU/L) + 0.005 × Age + 0.231 × Sex(M = 1, F = 0))))
Fibrotest®
Serum parameters of Fibrotest® were measured in accordance with technical recommendations of the authors. 8 Score calculations were purchased from Biopredictive (Paris, France).
Fibrometer®
Blood parameters were measured in accordance with the technical recommendations of the authors. 9 Serum A2M, AST, urea and HA were measured as described above. Platelet count and prothrombin time were measured immediately following venipuncture. Score calculations were kindly provided by Prof. Paul Calès (Angers, France).
Hepascore®
Serum HA and Α2M concentrations were measured as above. The Hepascore® was computed using the model previously published by Adams et al. 10 :
Hepascore® = y/(1 + y) with y = exp [−4.185818−(0.0249 × age (years)) + (0.7464 × sex (M = 1, F = 0) + (1.0039 × A2M (g/L)) + (0.0302 × HA (µg/L)) + (0.0691 × bilirubin (µmol/L)) − (0.0012 × GGT (IU/L))].
Zeng’s score®
Serum GGT, A2M and HA were measured as described above. Zeng’s score was calculated according to the original publication 24 :
Zeng = −13.995 + 3.22 × (ln(A2M)) + 3.096 × (ln(age)) + 2.254 × (ln(GGT)) + 2.437 × (ln(HA)).
Statistical analysis
Statistical analysis was performed using Medcalc® (Medcalc Software, Ostend, Belgium) and Stata version 12.1 (StataCorp, College Station, TX, USA). Continuous variables were expressed as medians (interquartile ranges). A P value < 0.05 was considered statistically significant.
First, Spearman rank correlations were used to assess the relationship between individual scores and histological degree of fibrosis. We then examined the predictive capacity of each biochemical score to evaluate overall fibrosis levels by means of the Obuchowski measure. This measure can be used as an estimator for test accuracy when the gold standard is not binary, but rather graded on an ordinal scale. It also limits spectrum bias typically found in other measures by incorporating a combined weight including the relative proportion of fibrosis stages in the study sample compared with a reference population and a penalty that proportionally increases with larger distances between fibrosis stages. 25 The Obuchowski measures were calculated online (http://forge.info.univ-angers.fr/∼gh/wstat/obu_f.php, courtesy of Dr G. Hunault, Angers University, Angers, France). Second, we constructed receiver-operator characteristic (ROC) curves in which biochemical scores were used to predict specific levels of liver fibrosis (≥F2, ≥F3 and =F4) as determined by liver biopsy. Area under the ROC (AUROC) curves were then calculated and compared between tests using the method by DeLong et al. 26 Finally, we determined the optimal cut-off values for the Coopscore© by maximizing the sum of sensitivity (Se) and specificity (Sp) at ≥F2, ≥F3 and =F4 fibrosis levels. Positive predictive value (PPV) and negative predictive value (NPV) were also calculated after using these cut-offs.
In an exploratory analysis, differences in OPG and collagen IV concentrations were also examined between various HIV-related and metabolic determinants using linear regression models. Since these factors are known to play a role in fibrogenesis and could confound their association with biomarker concentrations, differences were adjusted for fibrosis levels.
Results
Characteristics of patients
Participant flow based on the initial cohort of 308 HIV-HBV co-infected patients is summarized in Figure 1. In total, 97 patients were included in analysis. Patient demographic, HIV-related and HBV-related characteristics are provided in Table 1. A total of 58 (61.1%) patients had detectable HBV–DNA (median = 5.06 log10 IU/mL, IQR = 3.26–6.88) and 68 (73.1%) had positive hepatitis B ‘e’ antigen. Fibrosis stages were distributed as follows: F0, n = 8 (8.2%); F1, n = 34 (35.1%); F2, n = 25 (25.8%); F3, n = 15 (15.5%); and F4, n = 15 (15.5%). Ten (10.3%) patients were treated with the antiretroviral agent atazanavir.
Flow chart from the source cohort. Characteristics of the study population (n = 97). Categorical variables are expressed as n (%) and quantitative variables are expressed as median (IQR). AST: aspartate aminotransferase; BMI: body mass index; HIV: human immunodeficiency virus; NRTI: nucleoside/nucleotide reverse transcriptase inhibitor; NNRTI: non-nucleoside reverse transcriptase inhibitor; PI: protease inhibitor. Patients were considered diabetic if they were treated with insulin, insulin-analogues, or a blood glucose-lowering agent or were diagnosed by their treating physician with diabetes. Patients were considered to have cardiovascular disease (CVD) if they were treated with an agent indicated for CVD (cardiac therapy, antihypertensives, diuretics, peripheral vasodilators, beta-blockers, calcium channel blockers, ACE inhibitors, angiotensin antagonists, or lipid-modifying agents) or were diagnosed by their treating physician with any hypertensive, ischaemic or other forms of heart disease.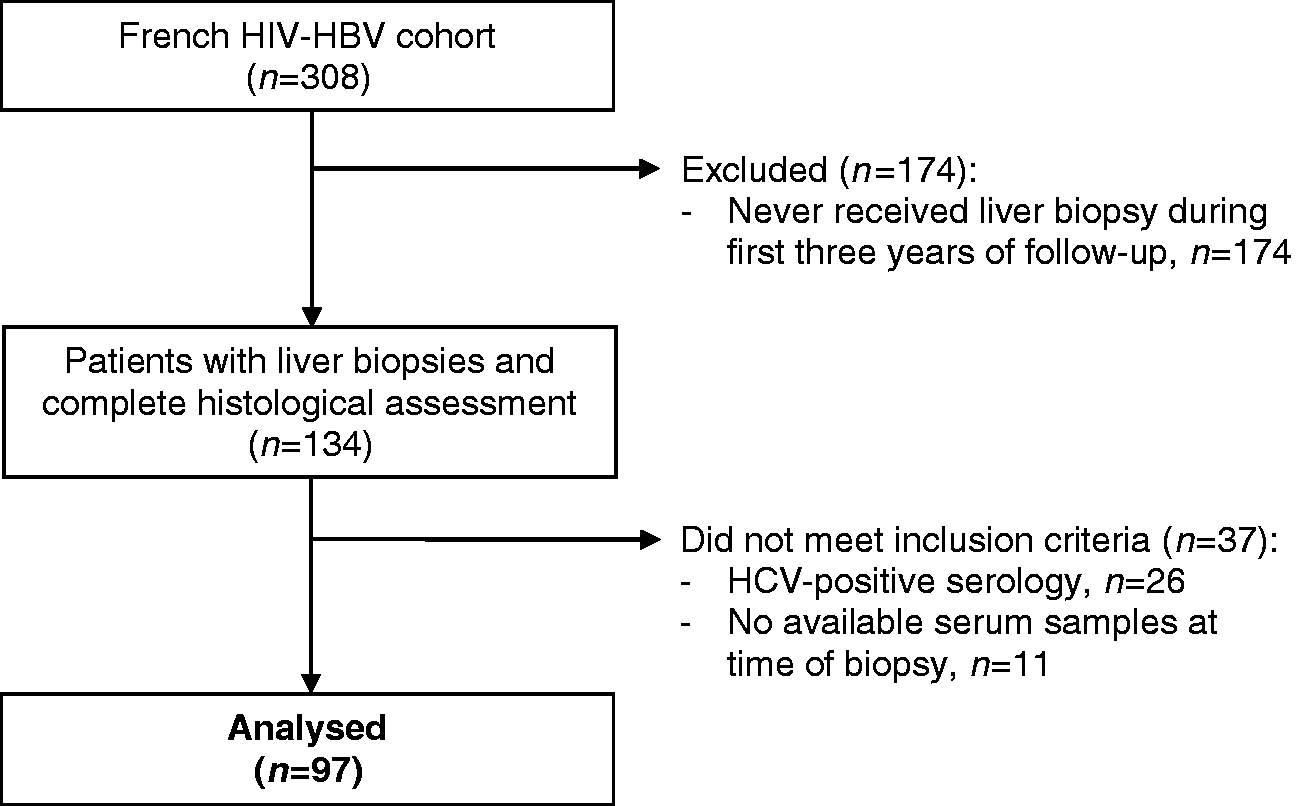
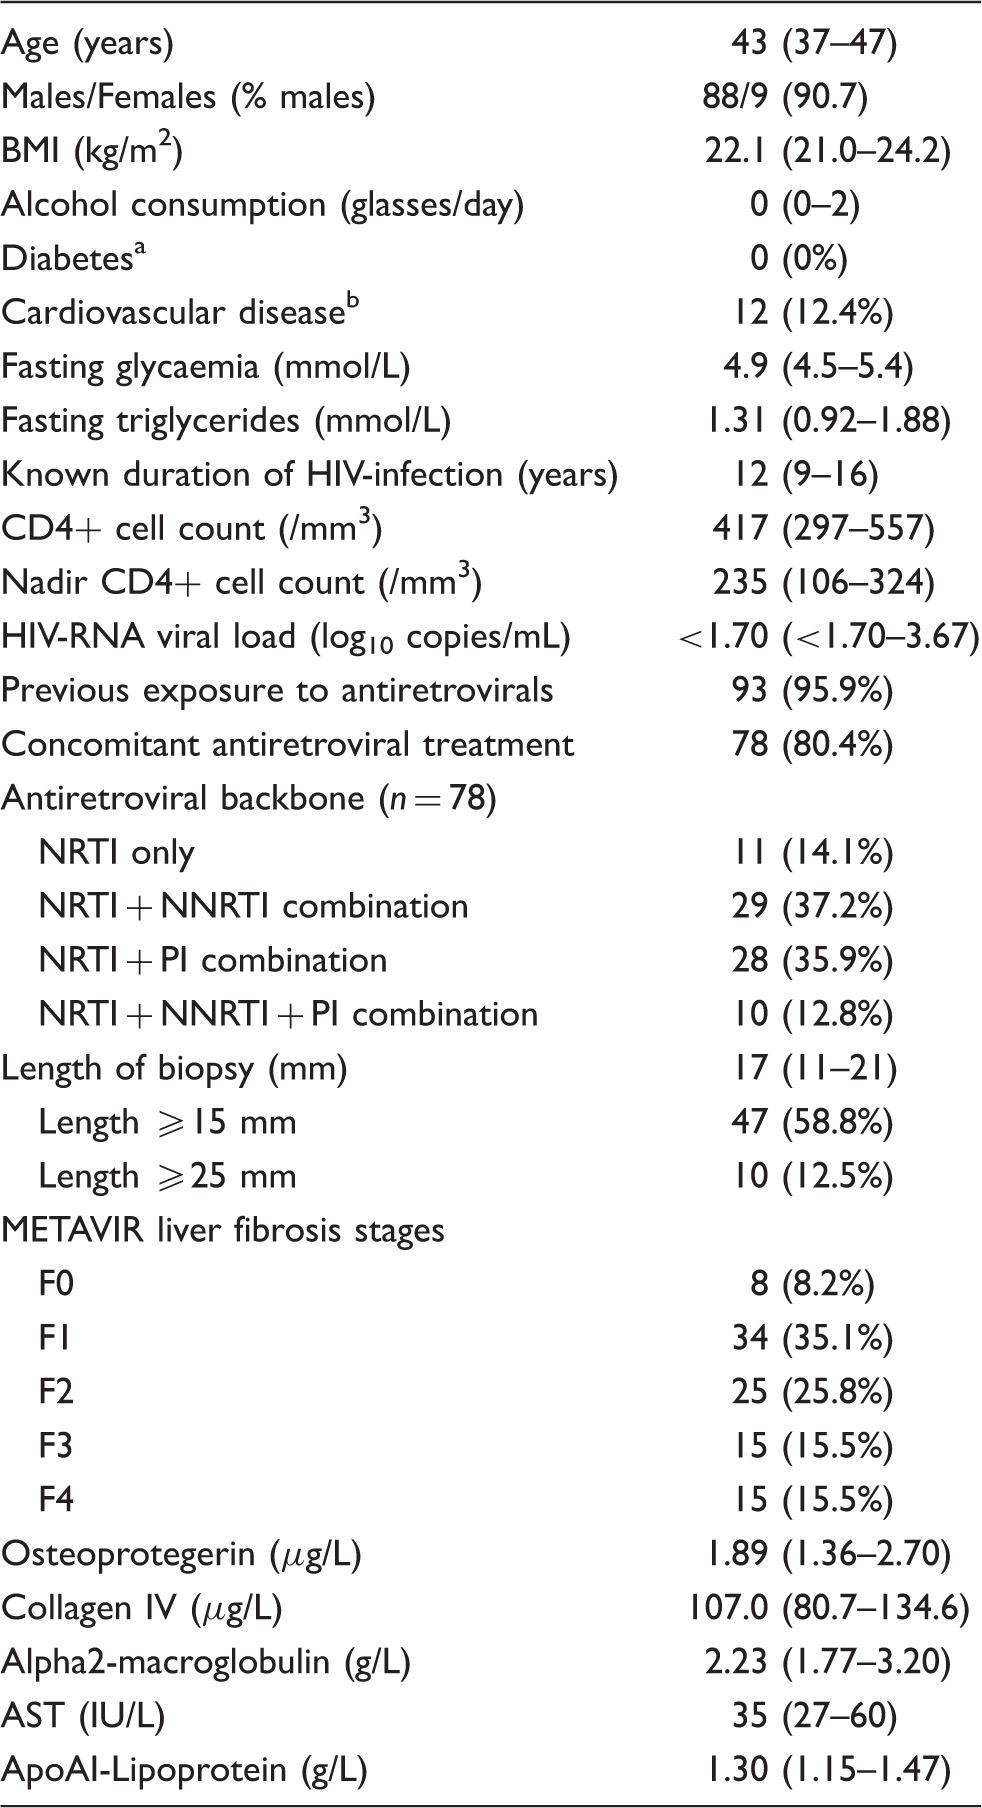
Biochemical data used to calculate the Coopscore© are also summarized in Table 1. Healthy reference value l concentrations for usual biochemical parameters are given for comparison in Supplementary Table 2. Median osteoprotegerin concentrations were 1.89 µg/L and median collagen IV concentrations were 107.0 µg/L. Of note, there were no HIV-related or metabolic factors that were associated with differences in OPG or collagen IV concentrations after adjusting for fibrosis levels (Supplementary Table 3). However, OPG concentrations were significantly higher in patients with previous exposure to ritonavir-boosted saquinavir (+1.24, 95%CI = 0.37, 2.11) and collagen IV significantly higher in patients with previous exposure to stavudine (+26.2 µg/L, 95%CI = 4.9, 47.6), didanosine (+24.6 µg/L, 95%CI = 4.3, 44.8), or ritonavir-boosted indinavir (+29.8 µg/L, 95%CI = 9.7, 49.8).
Diagnostic accuracy of the Coopscore©
Figure 2 shows osteoprotegerin and collagen IV concentrations, as well as Coopscore© values according to histological stage of fibrosis. Median concentrations of both osteoprotegerin and collagen IV significantly increased with METAVIR fibrosis stage (ρ = 0.415, P < 0.0001 and ρ = 0.445, P < 0.0001, respectively). As expected, median Coopscore© values increased with METAVIR fibrosis stages (0.18, IQR = 0.12–0.29 at F0; 0.27, IQR = 0.16–0.39 at F1; 0.42, IQR = 0.34–0.53 at F2; 0.45, IQR = 0.33–0.66 at F3; 0.59, IQR = 0.54–0.77 at F4) and correlated well with histological staging (ρ = 0.651, P < 0.0001).
Box plots values of osteoprotegerin (a), collagen IV (b), and Coopscore© (c) according to METAVIR stages of liver fibrosis. Horizontal lines within boxes indicate median and boxes indicate interquartile range.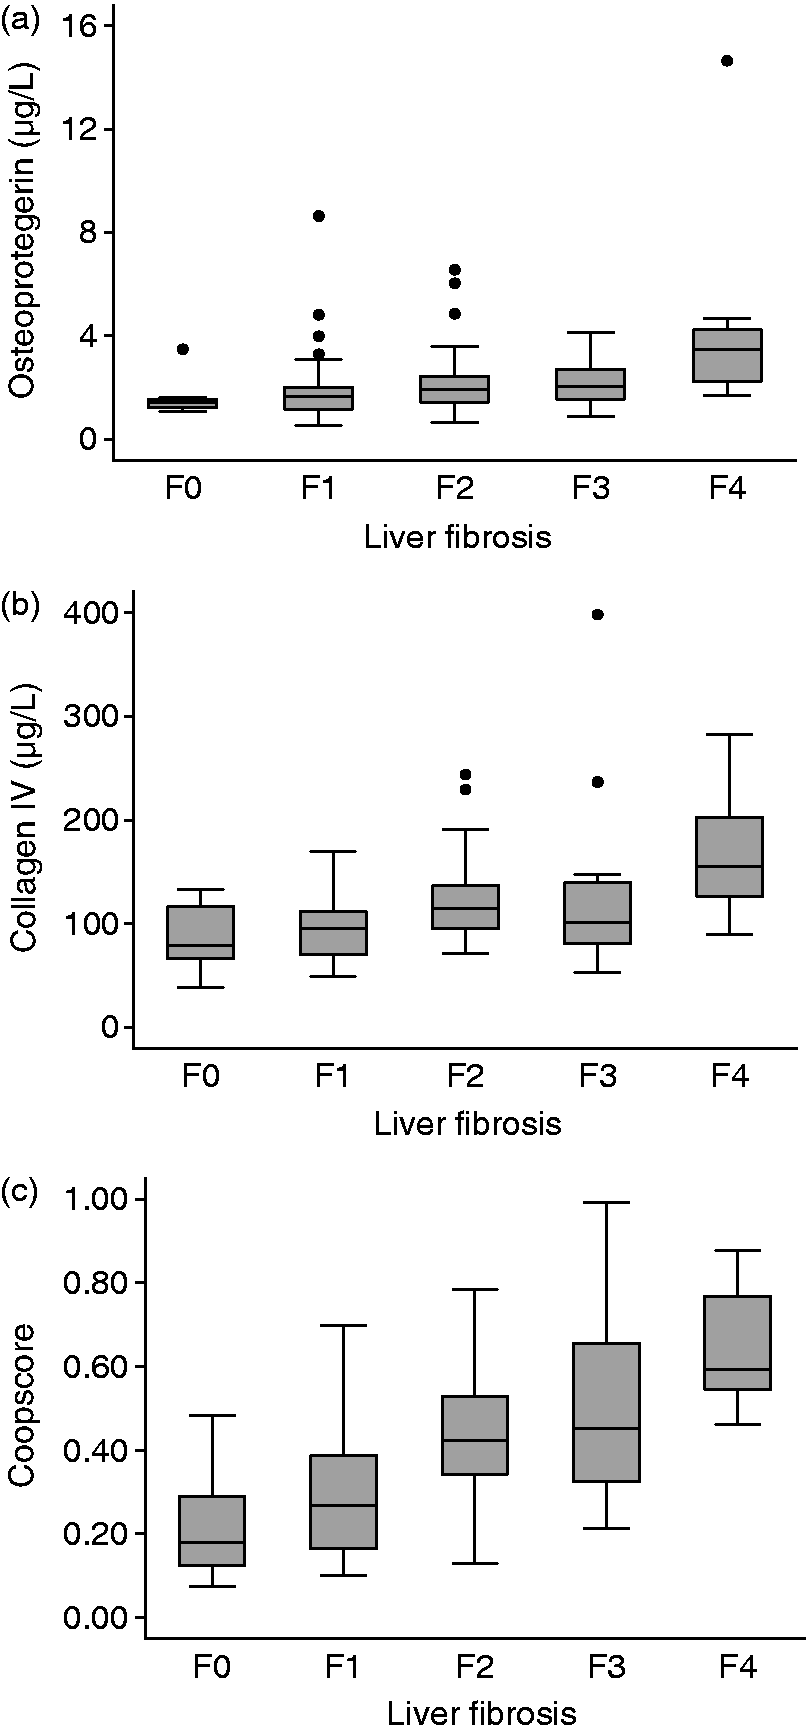
Adjusted AUROCs (Obuchowski) and observed AUROCs of blood tests.
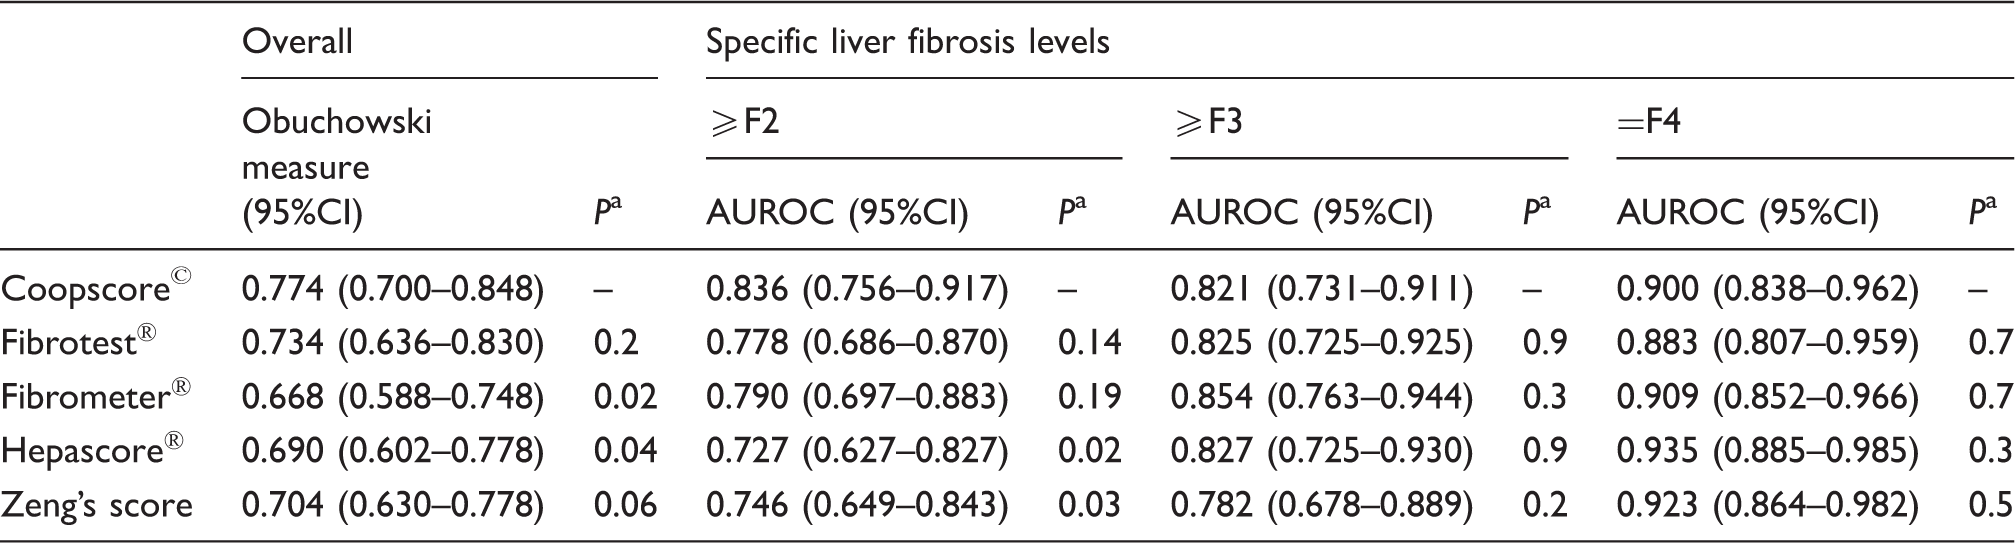
AUROC: area under the receiving operator characteristic
Comparing the performance of each test with that of the Coopscore©.
Determining the optimal cut-off for the Coopscore©
Diagnostic accuracy of Coopscore© for significant fibrosis, advanced fibrosis and cirrhosis.
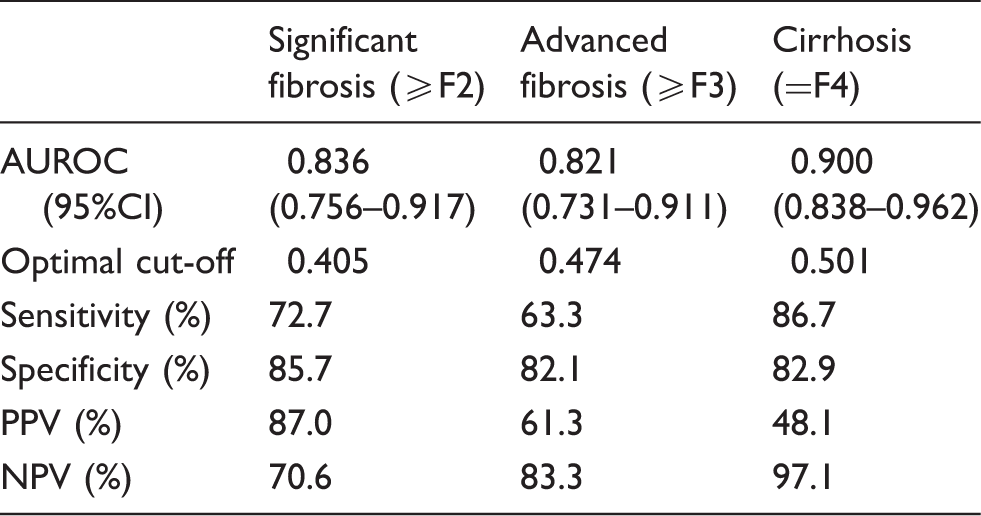
Se: sentitivity; Sp: specificity; PPV: positive predictive value; NPV: negative predictive value; AUROC: area under the receiving operator characteristic.
Discussion
Due to the more rapid progression of HBV-related liver damage in co-infected individuals when compared with chronic HBV alone,2,27 there is great interest to assess liver fibrosis in the HIV/HBV co-infected population. Non-invasive methods for liver fibrosis evaluation have been proven useful and are promising alternatives to liver biopsy in particularly HBV mono-infected patients without co-morbidities28,29 and in HIV/HBV co-infected patients. 16
The Coopscore© was initially developed in a cohort of patients with chronic hepatitis C (CHC) using routine laboratory tests and two less commonly used biochemical parameters: collagen IV and osteoprotegerin. 20 In the present study, the Coopscore© was evaluated in individuals with HIV/HBV co-infection, thus representing a different aetiology of chronic liver disease. In CHB patients, the diagnostic value of serum collagen IV in the assessment of liver fibrosis has already been reported, 30 and collagen IV has been included as part of a four-parameter biochemical score for assessing fibrosis in patients with CHB. 31 Concerning osteoprotegerin, this parameter has gained clinical relevance as a cardiovascular biomarker prompting analytical validation by immunoenzymatic assays, 32 but only recently has been included in non-invasive tests evaluating liver fibrosis.
In terms of diagnostic accuracy, the Coopscore© outperformed most of the biochemical scores evaluated in our study for overall fibrosis staging (using the Obuchowski measure). AUROC comparisons also showed that the Coopscore© had statistically better performance in predicting significant fibrosis than half of the validated biochemical scores evaluated herein. The Fibrotest® and Fibrometer® were the only scores not demonstrating statistically superior AUROCs when predicting ≥F2 fibrosis. These results were indeed consistent with our validation study among CHC patients, 20 yet all measures of predictive capacity in the previous evaluation were statistically in favour of the Coopscore©. In addition, the Coopscore© provided no significant advantage in predicting advanced fibrosis or cirrhosis and performed, in fact, less well at these fibrosis levels compared with CHC patients (data not shown).
Certain peculiarities of the study population could account for alterations in some parameters found in the Coopscore©. For example, increases in osteoprotegerin have been reported during HIV-infection in association with atherosclerosis and bone turnover, which could affect the overall result of the test.33,34 On the other hand, metabolic disorders often observed in HIV-infection and/or treatment, such as hypertriglyceridaemia, are known to interfere with osteoprogerin quantification in a positive concentration-dependent manner. 32 In our study, the only real factors accounting for modifications in collagen IV or osteoprotegerin were previous exposure to specific antiretroviral agents, namely d-drugs and select protease inhibitors.
In order to account for the influence of atazanavir-induced hyperbilirubinaemia when interpreting test results, Bottero et al. showed that the performances of bilirubin-based blood tests were similar between treated and non-treated patients at inclusion in 108 included patients of the same cohort. 16
Since other studies have underestimated fibrosis levels when applying HCV-derived cut-offs to HBV-infected 28 or HIV–HBV co-infected populations, 16 we decided to define optimized cut-offs in our study population. Using these cut-offs, we observed that 78.4%, 76.3% and 83.5% of patients were correctly identified as having significant fibrosis, advanced fibrosis and cirrhosis, respectively. It should also be stressed that by using a threshold of 0.501, liver cirrhosis was ruled out in 97.1% of patients without cirrhosis. Interestingly, the optimal threshold for predicting significant fibrosis in HIV/HBV patients, at 0.405, was lower than the previously published threshold in CHC patients, at 0.484, 19 thereby supporting aetiology-based adjustment of Coopscore© thresholds.
This study has some limitations. First, small sample sizes may have induced lack of statistical power to establish significant differences between tests and underestimation of test diagnostic accuracy. Second, patients from the source cohort with liver biopsies had significantly higher transaminase levels and higher HBV–DNA viral loads, suggesting more severe liver disease. These selected patients likely had a higher proportion of patients with significant fibrosis (56.7%) compared with the prevalence normally observed among HIV/HBV-infected individuals, and thus could have resulted in spectrum bias and overestimation of test performance in predicting significant fibrosis. Third, as osteoprotegerin and collagen IV measurements were performed on frozen samples, we did not consider their potential change after long storage periods. Previous studies have established high stability during multiple freeze–thaw cycles for osteoprotegerin, 32 yet variation due to long-term storage for up to a decade has not been determined for either parameter. Fourth, these assays were not standardized and certain caution should be given to interpreting interlaboratory reproducibility. Fifth, since liver stiffness measurements from TE have provided good diagnostic values at higher fibrosis stages,35,36 a strategy based on combining the Coopscore© with TE could have provided greater diagnostic accuracy, as previously done among CHC patients. 20 Unfortunately, TE measurements were not available in the present cohort. Finally, the results from our study need external validation in not only other co-infected patients populations, but also those with HBV mono-infection.
In conclusion, our assessment of the Coopscore© commends its use as a relevant non-invasive blood test for the prediction of significant fibrosis in HIV–HBV co-infection, demonstrating potential diagnostic interest for this particular setting. However, the reproducibility and validity of the Coopscore© must be further investigated in other studies in which larger groups of patients are included, while possibly establishing the utility of algorithms combining information from TE.
Footnotes
Acknowledgements
We are grateful to the patients and clinical teams for their commitment to the French HIV-HBV Cohort Study. We acknowledge H. Rougier, M. Sébire-Le Cam, L. Roguet for managing the logistics of the French HIV-HBV Cohort; G. Pannetier and F. Carrat for their help in data management. We would like to thank Pr J.-F. Flejou and E. Roux of the Tumorothèque HUEP at Saint-Antoine Hospital for storing samples and Dr Gilles Hunault, University of Angers, France, for their assistance with the Internet-available software used to calculate the Obuchowski measure.
Declaration of conflicting interests
The author(s) declared no potential conflicts of interest with respect to the research, authorship, and/or publication of this article.
Funding
This study was supported and funded by the French Agency for Research on AIDS and Viral Hepatitis (A.N.R.S.) and was supported by the French Clinical Biology Society (Société Française de Biologie Clinique) and the Association Française pour l'Etude du Foie (AFEF). AB was awarded a post-doctoral fellowship from SIDACTION.
Ethical approval
The study was approved by the Institutional Review Board at Pitié-Salpêtrière Hospital (Paris, France; reference number CCPPRB/132-01) in compliance with the Helsinki Declaration.
Guarantor
LT.
Contributorship
LT and NB performed biochemical assays, analysed data and drafted the manuscript. AB was responsible for data management of the French HIV-HBV cohort and provided critical revisions of the manuscript. JB and KL were involved in patient recruitment and provided critical revisions of the manuscript. EL was responsible for overseeing automated assay protocols. JG, BB and MV reviewed and critically edited the manuscript. All authors approved the final version of the manuscript.