
Abstract
Background
Biotin interference is a significant problem to which at-risk laboratories must now be attuned. We sought to systematically characterize the nature of this interference in Roche immunoassays.
Methods
Known concentrations of biotin were titrated into serum samples and the effects on competitive and sandwich immunoassays were analysed. The maximum and minimum concentrations examined reflect those likely to be achieved in individuals on 5 to 10 mg supplements at the lower end, and 100 to 300 mg biotin at the high end.
Results
A high variability in biotin tolerance was observed. Some assays, such as troponin T, TSH and antithyroid antibodies, were extremely sensitive to the lower concentrations of biotin (15.6 and 31.3 ng/mL), whereas the majority of assays were relatively resistant. At concentrations ≥500 ng/mL, all assays showed significant interference from biotin but, again, the magnitude of the interference was variable. The more sensitive assays showed profound analytical bias at biotin concentrations that occur with high-dose therapy.
Conclusion
Our data demonstrate high variability in biotin tolerance across Roche immunoassays. The shape of the dose–response curves provides more detailed information than the single manufacturer-quoted figure for biotin tolerance. Accordingly, these data may be used by laboratories for more accurate risk assessment in predicting the effects of biotin. Our data may also be extrapolated to guide timing of blood tests in patients on high-dose biotin therapy: it demonstrates the number of half-lives required to withhold biotin in order to decrease its concentration to below a given assay tolerance.
Introduction
The interaction between streptavidin and biotin constitutes one of the strongest examples of protein:ligand binding occurring in nature, a property that has found wide application in biotechnology. 1 Many automated immunoassays incorporate biotinylated antibodies and streptavidin-coated magnetic beads as a means of immobilizing antigen–antibody complexes to the solid phase; this approach offers many advantages, including signal amplification and increased sensitivity. 2 Such assay design, however, may be vulnerable to interference from high biotin concentrations within the sample: excess biotin competes with biotinylated antibody, thereby causing falsely low results in sandwich immunoassays and falsely high results in competitive immunoassays. 3
Despite the widespread use of streptavidin–biotin technology in routine pathology laboratories, reports of biotin interference had, until recently, been uncommon. The patients most vulnerable to interference were those with rare inborn errors of metabolism for which high-dose biotin therapy is an established treatment, 4 such as biotinidase deficiency, holocarboxylase synthetase deficiency and biotin-thiamine-responsive basal ganglia disease.3,5–8 In the last year, however, high-dose biotin therapy has been adopted as a promising new treatment for progressive multiple sclerosis (MS).9,10 With a worldwide prevalence that far exceeds the combined prevalence of the above-mentioned metabolic disorders, MS is not a rare disease: the global median prevalence is 33/100,000, but higher with increasing distance from the equator. 11 Unsurprisingly, the uptake of high-dose biotin therapy in MS has been accompanied by a succession of cases of biotin interference in this setting in the last year.12–18
Unexpected thyroid function test (TFT) derangement has proven a sensitive litmus test for biotin interference. On susceptible platforms, biotin interference mimics thyrotoxicosis, causing falsely low thyrotrophin (TSH) and falsely high free T4, free T3 and antithyroid antibodies. This has unfortunately led to erroneous thyrotoxicosis diagnoses and inappropriate treatment in some instances.7,14 Importantly, biotin interference is not confined to TFT, but affects all assays whose format incorporates a streptavidin-coated solid phase that dynamically binds biotinylated antibody or biotinylated tracer during the assay reaction.17,19–20 For such assays, the manufacturer’s method sheets generally alert us to the potential for biotin interference and recommend that patients treated with high-dose biotin (defined as >5 mg daily) wait at least 8 h postdose before the blood is collected for testing. 21 Some manufacturers also report a tolerance level for biotin; however, this remains an abstract concept for laboratories until the scope of interference is explicated, as has been the case for TFT. We now present a thorough characterization of biotin interference on the Roche platform. Our intention is to delineate the features of biotin interference across a range of competitive and sandwich Elecsys immunoassays. We hope that a clearer picture of the breadth and magnitude of interference will assist laboratories in risk assessment and perhaps, ultimately, facilitate precautionary approaches to limit the impact of the interference.
Materials and methods
Biotin reconstitution and spiking
Biotin (Astral Scientific, Cat. No. BIODB1001, Lot No. VH20150310CAS; purity: 99.5%) was reconstituted into a 1 ug/uL stock solution in 0.01 M NaOH and stored at 4℃ for one month or frozen at −20℃ for longer term storage. Biotin stock was diluted with distilled water into working solutions that were then spiked into serum samples to achieve the indicated final concentration of biotin (between 4 and 1000 ng/mL). Serum samples that would otherwise have been discarded were de-identified and used for spiking studies. The volume of spike was minimized to 5% of the final volume in all experiments. For controls, serum samples were spiked with an equal volume of distilled water to account for possible matrix effects. In experiments not shown, spiked NaOH (at concentrations equivalent to those of the biotin working solutions) had no effect on measured analyte compared with samples spiked with water.
Immunoassays
All immunoassay measurements were performed on the Roche Cobas 8000 e602. The following Elecsys assays (catalogue number in brackets) were evaluated for their biotin susceptibility.
Sandwich immunoassays
ACTH (03255751190), AFP (04491742190), CA125 II (11776223190), CA15-3 II (03045838122), CA19-9 (11776193122), CEA (04491777190), C-peptide (03184897190), FSH (11775863122), hCG+Beta (03271749190), insulin (12017547122), LH (11732234122), prolactin II (03203093190), total PSA (04491734190), free PSA (03289788190), pro-BNP II (04842464190), PTH intact (11972103122), SHBG (03052001190), troponin T hs (05092744190), TSH (11731459122).
Competitive immunoassays
anti-Tg (06368697190), anti-TPO (06368590190), anti-TSHR (04388780190), cortisol II (06687733190), DHEA-S (03000087122), digoxin (11820796190), FT3 (06437206190), FT4 (06437281190), oestradiol III (06656021190), progesterone III (07092539190), folate III (07559992190), testosterone II (05200067190), vitamin B12 (07212771190).
Statistical analysis
The paired Student’s t-test was applied to determine statistical significance, comparing biotin-spiked samples to water-spiked controls.
Results
Dose–response curves
We examined a range of concentrations reflecting plasma levels that may be achieved with high-dose biotin therapy at the upper end,
22
and 5 or 10 mg biotin supplements at the lower end. These titration curves are shown in Figure 1. As expected, increasing biotin concentrations caused progressive increase in analytes measured with competitive immunoassays (Figure 1(a)). Conversely, analytes measured using sandwich immunoassays were progressively reduced by increasing biotin concentrations (Figure 1(b) and (c)). There was marked variation in the susceptibility to biotin interference, however, both in terms of the concentration of biotin required to cause detectable interference, and the maximum observed effect.
(a) Dose response curves showing biotin interference in competitive immunoassays: biotin was spiked into control serum samples at the indicated concentrations. Biotin increased competitive immunoassay results in a dose-dependent manner; however, assays varied in their sensitivity to this effect. The results shown are representative of at least two separate experiments (* indicate results were above the upper limit of the measuring range). (b) Dose response curves showing biotin interference in sandwich immunoassays: biotin was spiked into control serum samples at the indicated concentrations. Biotin decreased sandwich immunoassay results in a dose-dependent manner, but assays varied in their sensitivity to this effect. The results shown are representative of at least two separate experiments. (c) Dose response curves showing biotin interference in tumour markers (sandwich immunoassays): biotin was spiked into control serum samples at the indicated concentrations. Biotin decreased tumour marker results in a dose-dependent manner, but assays varied in their sensitivity to this effect. The results shown are representative of at least two separate experiments (* indicate results above the upper limit of the measuring range).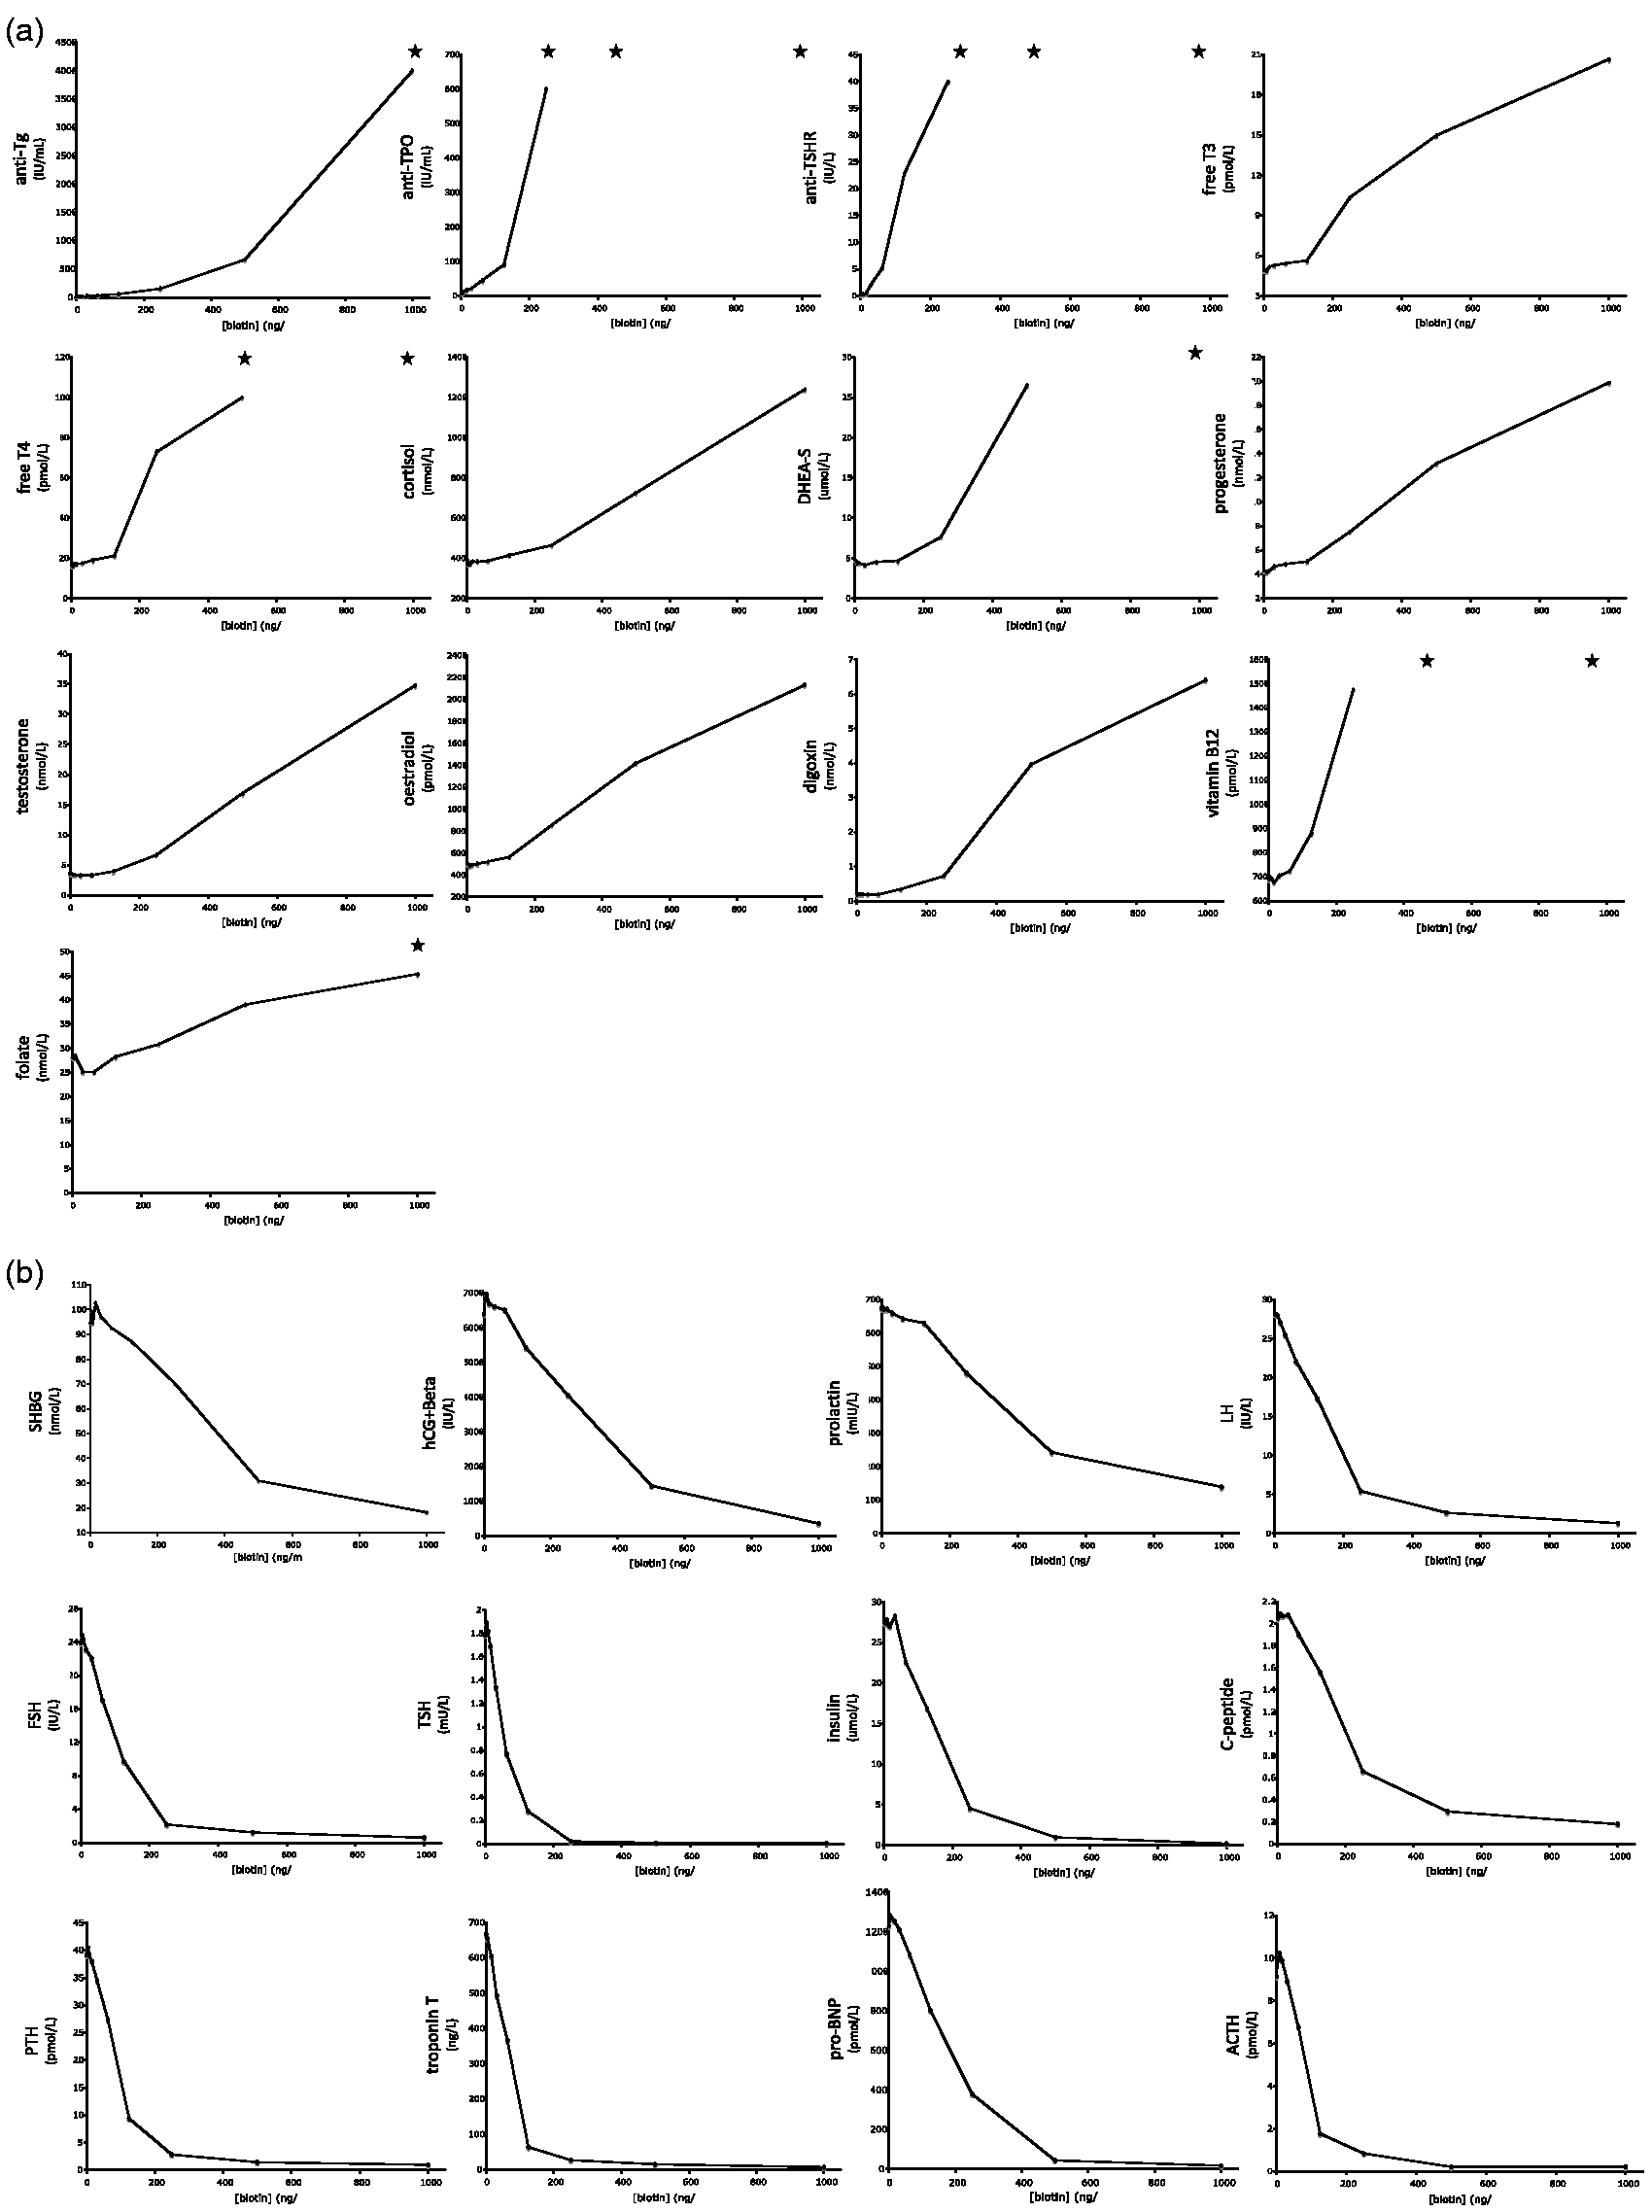
Simulation of 5–10 mg biotin intake: The effect of 15.6 ng/mL and 31.3 ng/mL biotin
The majority of the Roche immunoassays, both sandwich and competitive, were minimally affected with less than 5% analytical bias in the presence of 15.6 ng/mL biotin (Figures 2 and 3). The exceptions were TSH and troponin T, which demonstrated almost 10% negative bias at this concentration, and anti-Tg, anti-TPO and anti-TSHR, each of which showed greater than 10% positive bias. At 31.3 ng/mL biotin, the majority of the assays remained minimally affected, with less than 5% analytical bias evident. For the antithyroid antibodies listed above, however, bias at this concentration was already quite exaggerated, with greater than two-fold positive bias evident for anti-TPO and anti-TSHR, and 50% positive bias for anti-Tg. Of the remaining competitive assays, free T4 and free T3 demonstrated subtle (between 5 and 10%) positive bias, which was statistically significant (P = 0.008, P = 0.030, respectively). For the sandwich assays, TSH showed approximately 25% negative bias, troponin T a 20% negative bias, and luteinizing hormone (LH) and follicle-stimulating hormone (FSH) showed just under 10% negative bias, although this was statistically significant for LH only (P = 0.037, P = 0.303, respectively).
Simulation of 5–10 mg biotin supplementation: effect on competitive immunoassays. The effect of biotin at 15.6 ng/mL (a) and 31.3 ng/mL (b), expressed as % of control, unspiked serum samples. The results indicate average plus standard deviation of three separate experiments. For the majority of analytes, these biotin concentrations had minor effects on measured analyte; however, some assays, notably antithyroid antibodies, were very sensitive to biotin and demonstrated marked interference.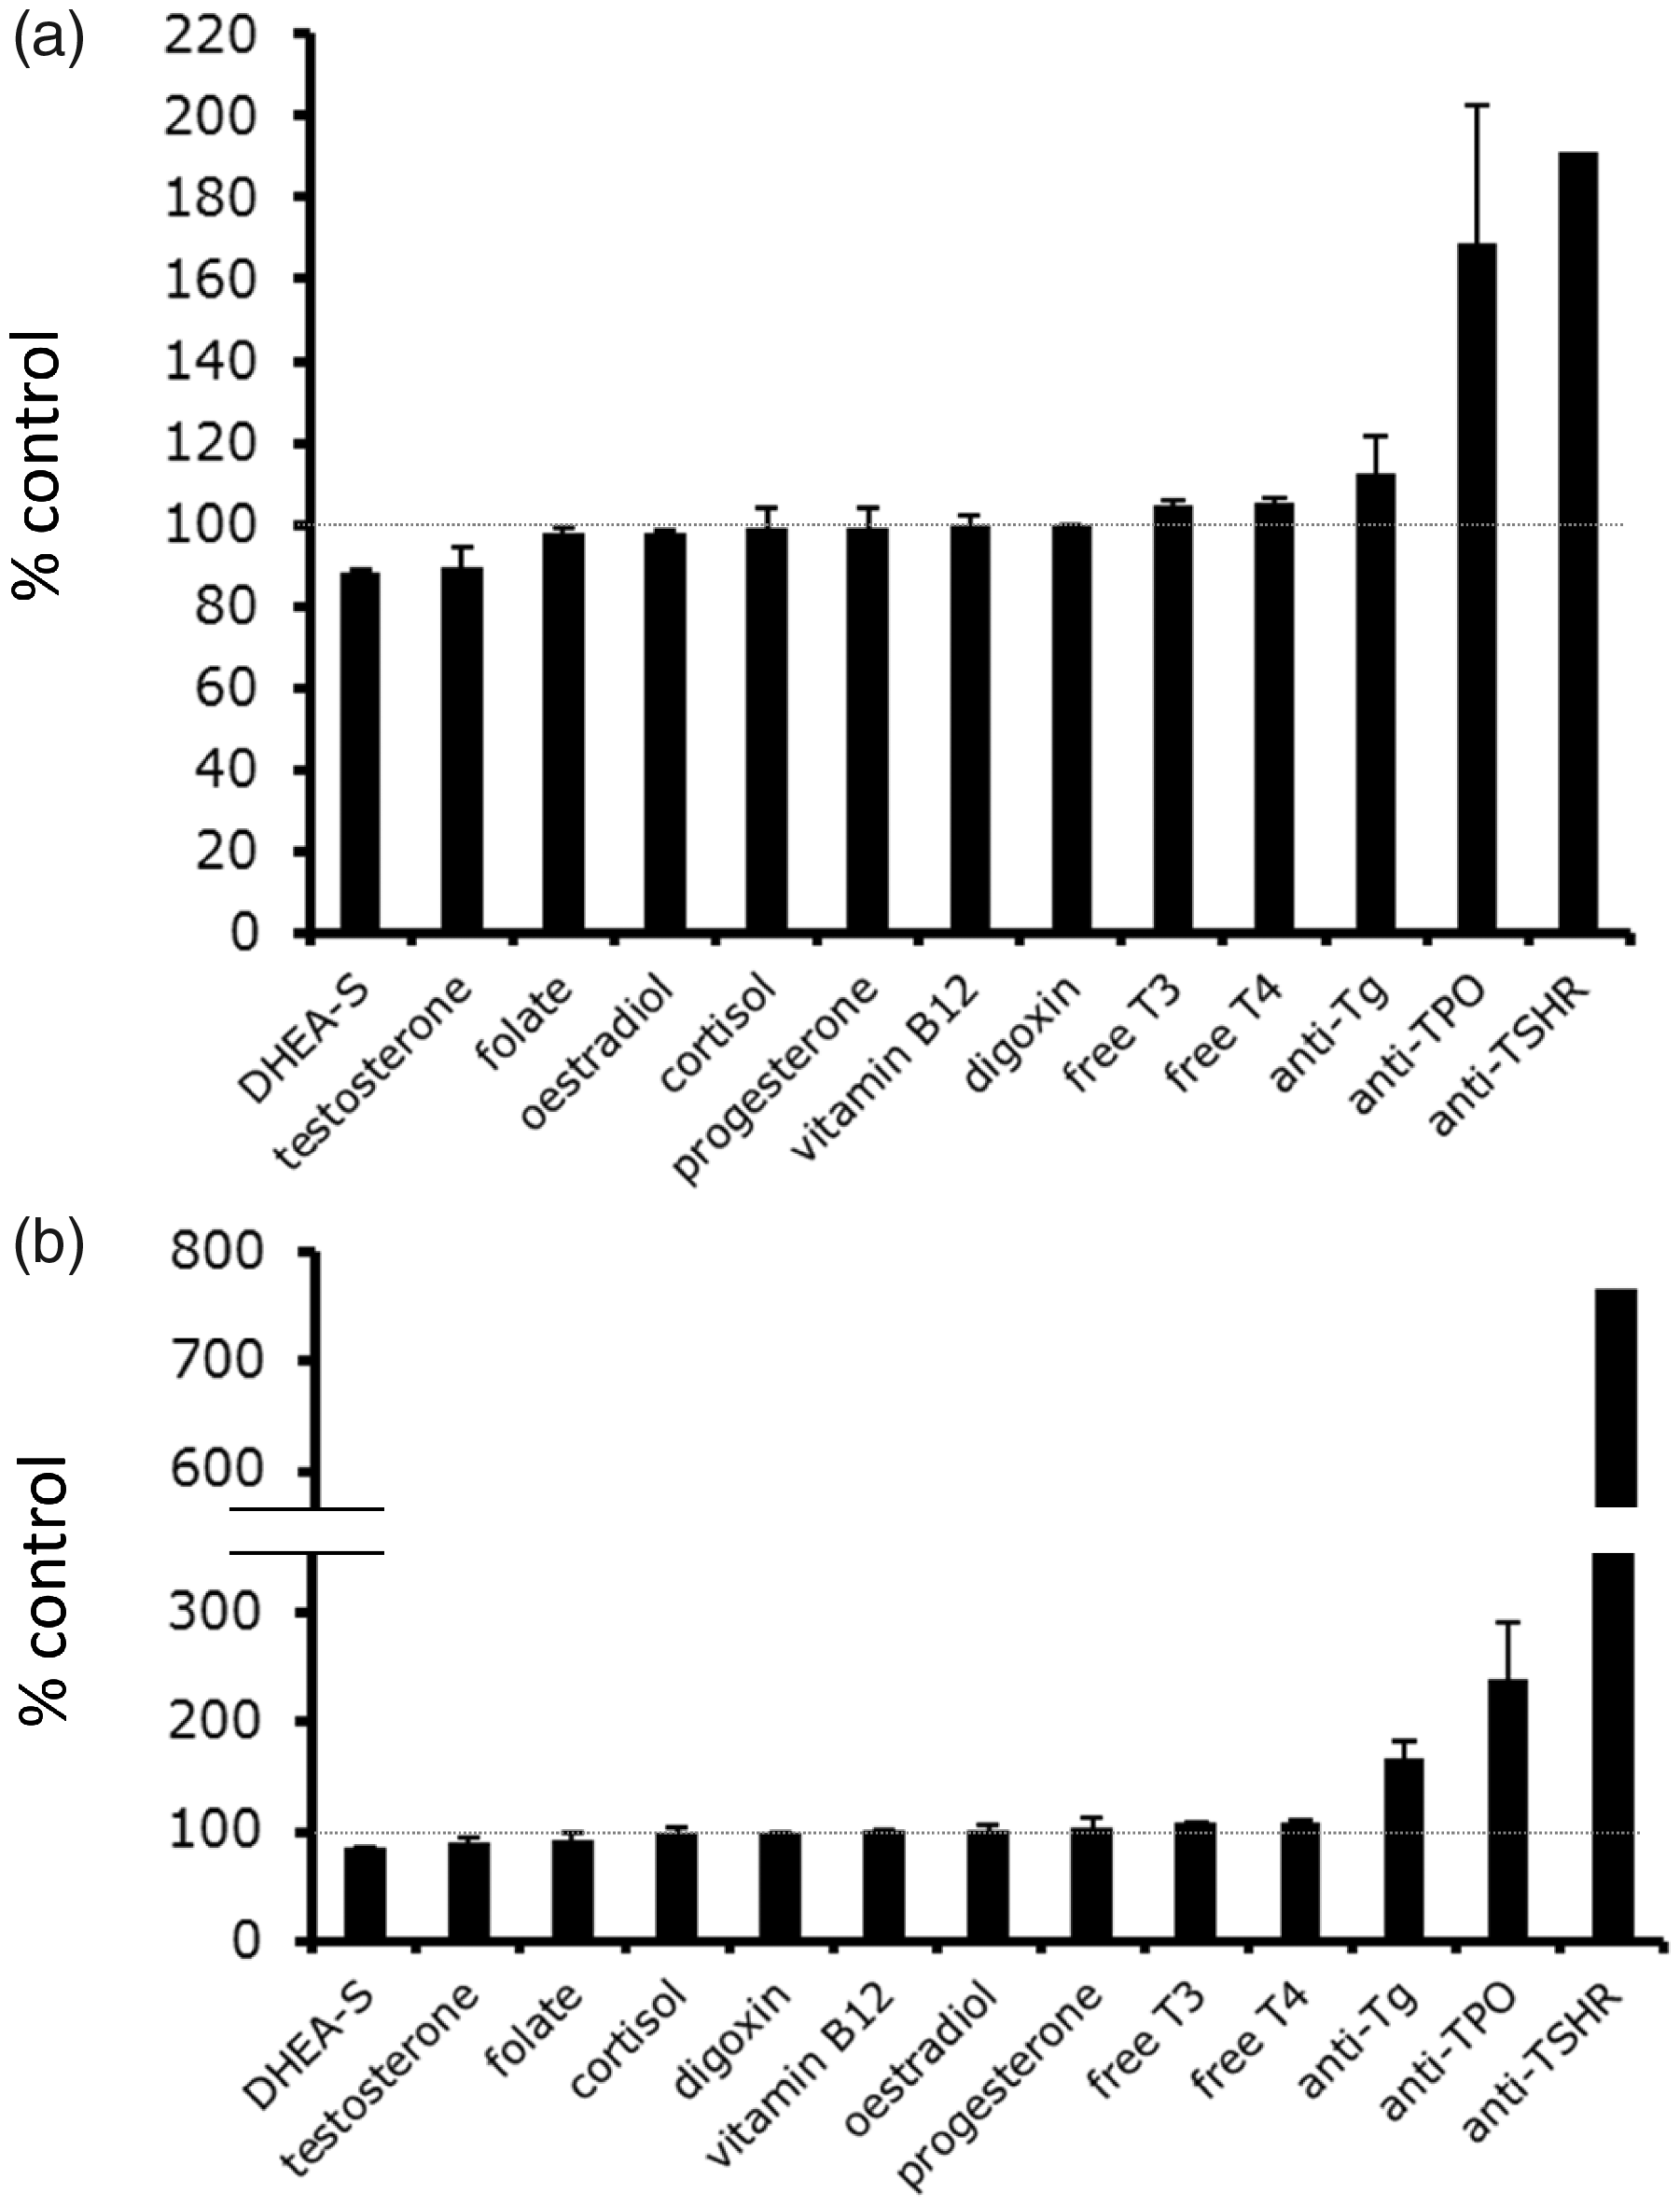
Interestingly, we noted for certain analytes a paradoxical inverse effect of biotin at these low concentrations. For example, folate, testosterone and dehydroepiandrosterone sulphate (DHEA-S) demonstrated a reproducible negative bias of approximately 10% in the presence of 31.3 ng/mL. This was statistically significant for folate (P = 0.011) but did not reach statistical significance for DHEA-S (P = 0.064) or testosterone (P = 0.133).
Simulation of 100–300 mg biotin therapy: The effect of 500 ng/mL biotin
Figure 4 shows the effect of biotin, at 500 ng/mL, on sandwich and competitive immunoassay results. This concentration slightly exceeds the average peak serum concentration occurring after a 100 mg dose; it is less than the peak achieved for a 300 mg dose.
22
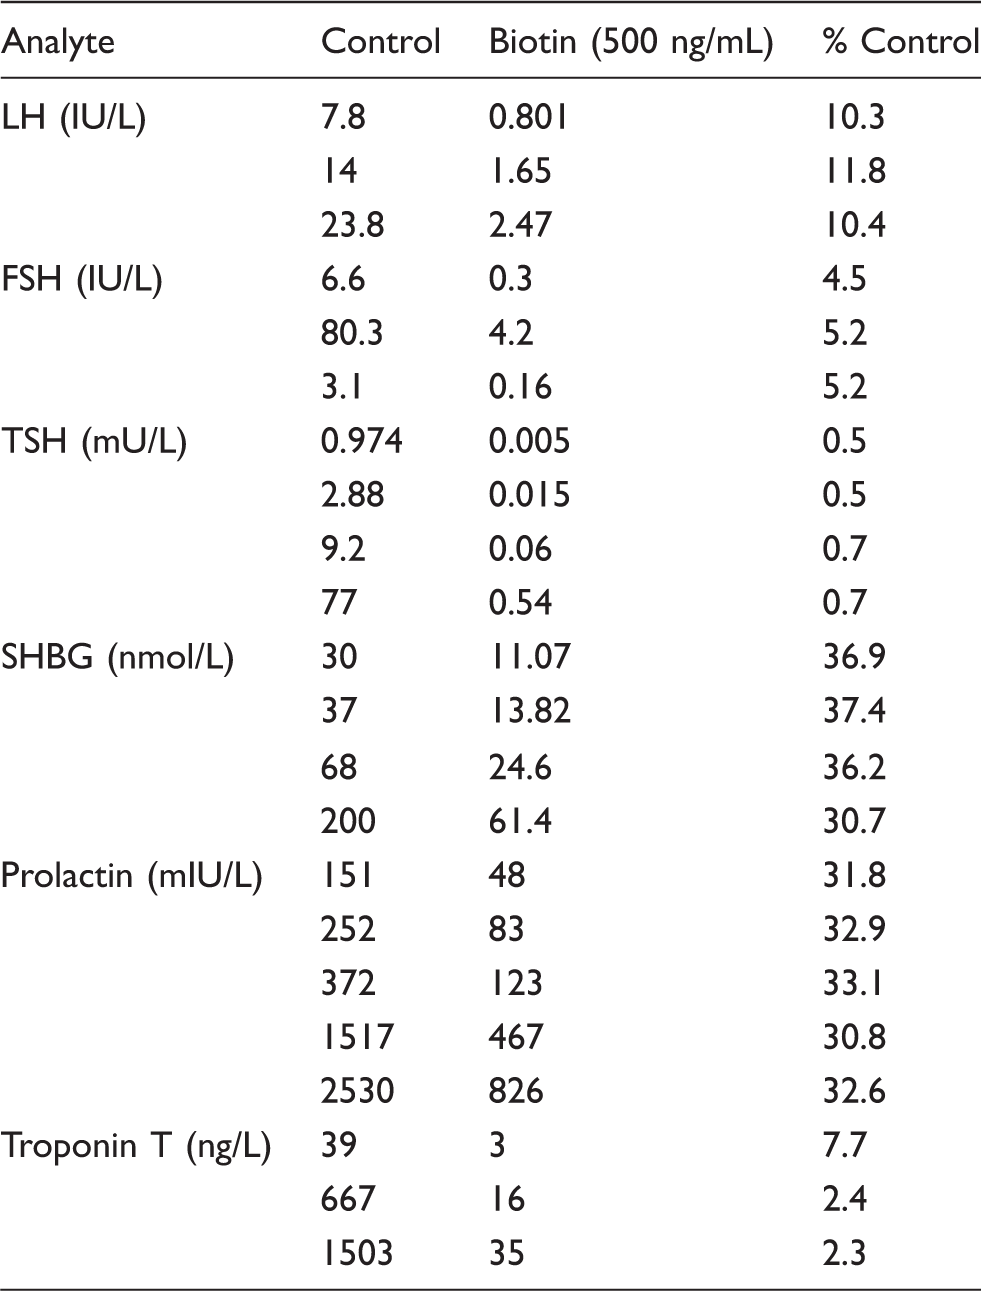
Of the sandwich immunoassays, TSH, insulin, pro-brain natriuretic peptide (pro-BNP), troponin T and free prostate-specific antigen (free PSA) were grossly affected, with a reduction in measured results of more than 95% in the presence of this concentration of biotin. FSH, PSA, parathyroid hormone (PTH) and adrenocorticotropic hormone (ACTH) were also severely affected, showing more than 90% reduction in measured results. In contrast, CA19-9 and CA15-3 proved the least affected of the sandwich immunoassays, demonstrating approximately 40% and 25% respective reductions in measured levels in the presence of 500 ng/mL biotin. For the competitive immunoassays, folate and cortisol each showed less than two-fold increase in measured results at 500 ng/mL biotin. For free T3, oestradiol and DHEA-S, between three- to four-fold increases were seen, and testosterone and free T4 demonstrated between five- and seven-fold increases. The following assays were extremely susceptible to gross analytical disturbance: digoxin (>15-fold increase), anti-TPO and anti-Tg (up to 50-fold increases), and anti-TSHR, which proved the most severely affected analyte. It should be noted, however, that each of these was assessed at fairly low analyte concentrations, which may have contributed to this profound analytical bias (see below).
Simulation of 5–10 mg biotin supplementation: effect on sandwich immunoassays. The effect of biotin at 15.6 ng/mL (a) and 31.3 ng/mL (b), expressed as % of control, unspiked serum samples. The results indicate average plus standard deviation of three separate experiments. For the majority of analytes, these biotin concentrations had minor effects on measured analyte; however, some assays, notably TSH and troponin T, demonstrated interference at these concentrations.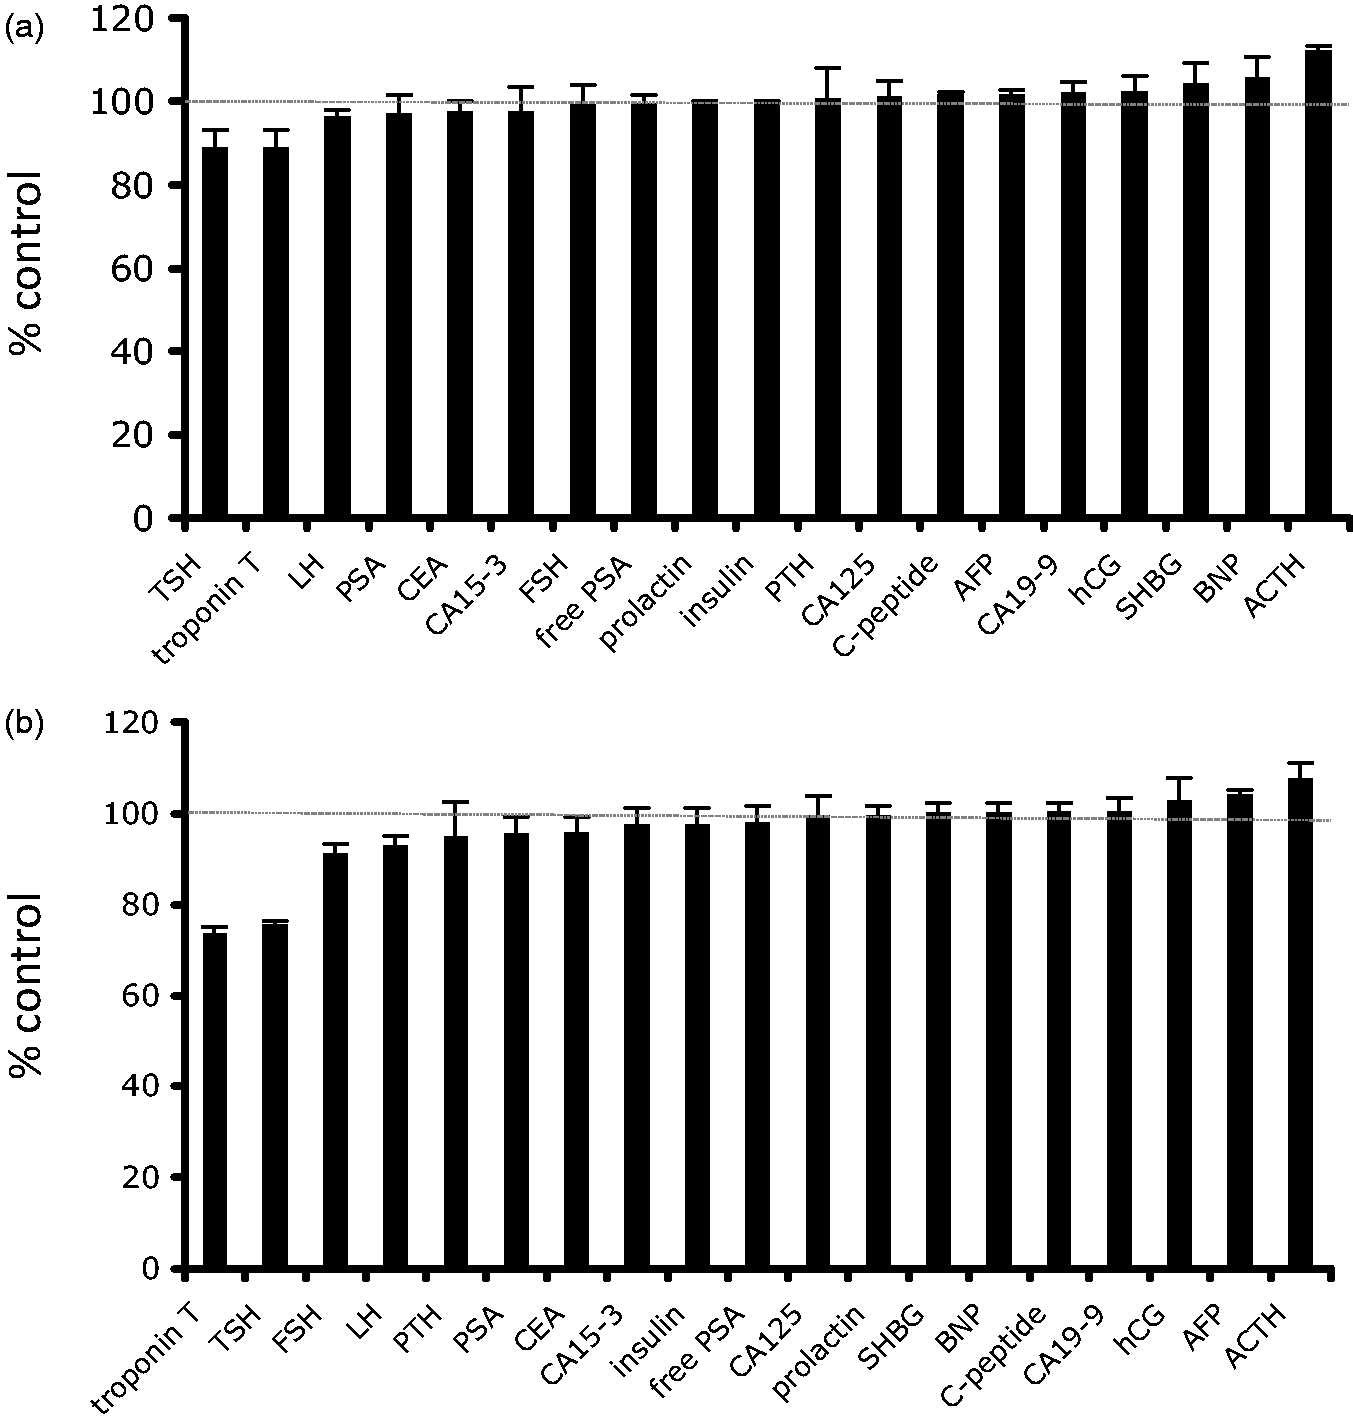
The effect of analyte concentration on biotin interference
Biotin interference and sandwich immunoassays: the effect of analyte concentration.
Note: 500 ng/mL biotin was spiked into samples of different analyte concentration. When expressed as a % of control, water-spiked sample, this concentration of biotin produced relatively consistent effects on measured analyte across the measuring range.
Biotin interference and competitive immunoassays: the effect of analyte concentration.
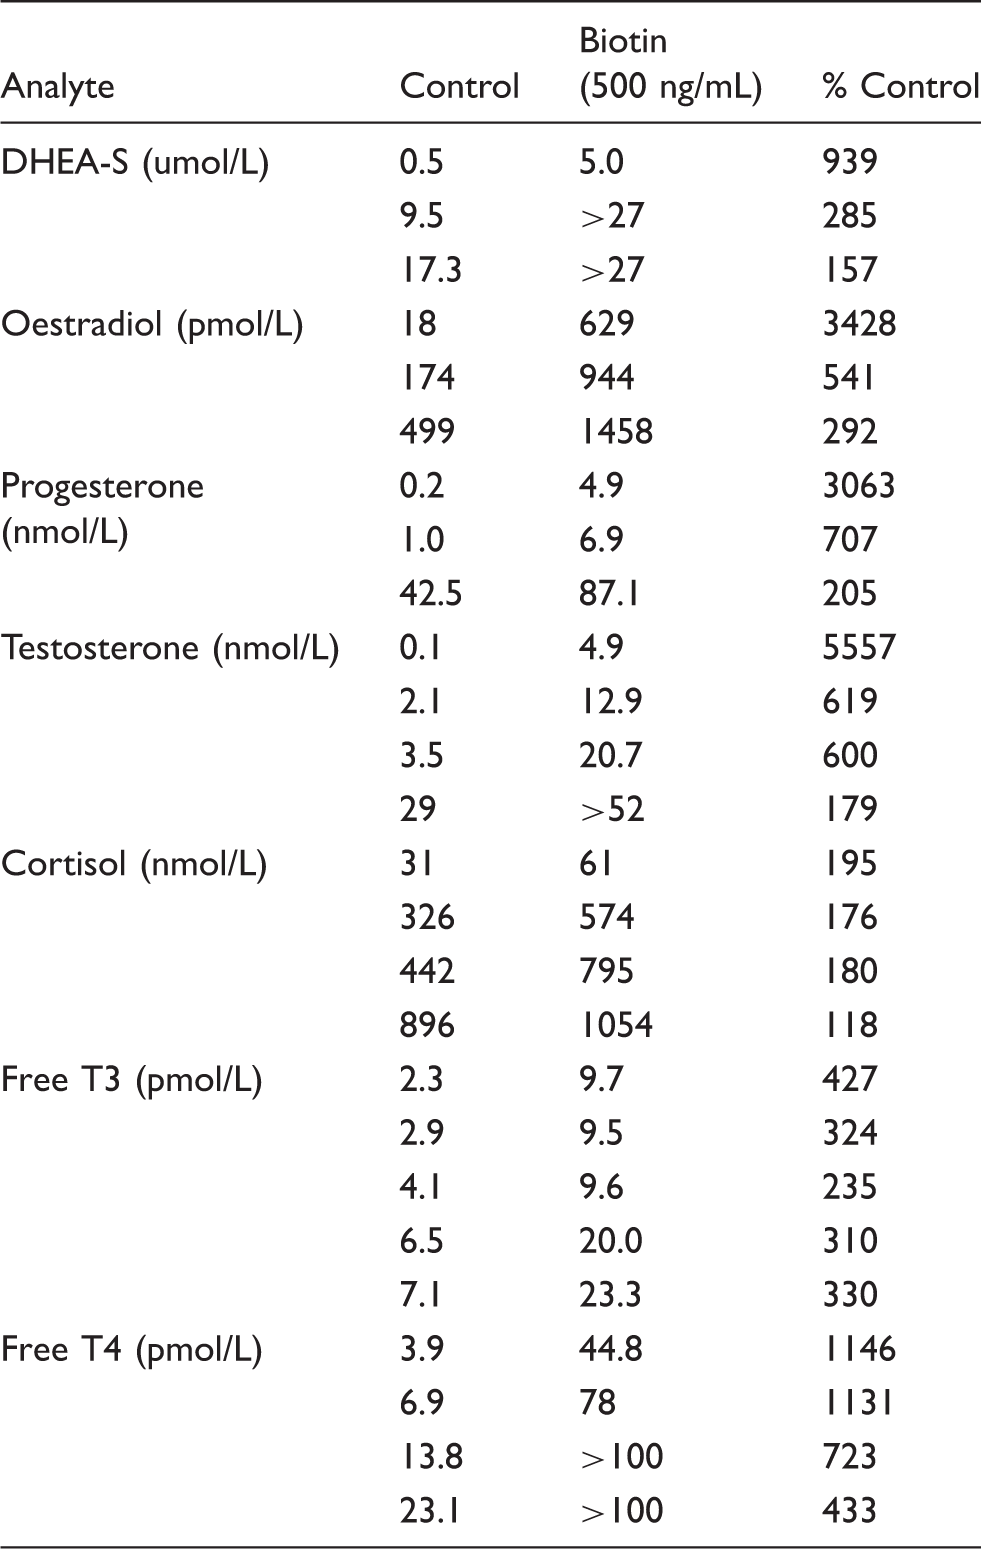
Note: 500 ng/mL biotin was spiked into samples of different analyte concentration. When expressed as a % of control, water-spiked sample, this concentration of biotin produced varying effects on measured analyte across the measuring range. Low analyte concentration was associated with marked increase in positive bias when expressed as a % of control.
Discussion
Biotin interference is a topical issue that presents particular challenges to laboratories employing streptavidin-biotin-based assays. The idiosyncrasies of this interference, however, have not been fully explicated across different assays. Through spiking exogenous biotin into serum samples, our study exposes high variability in biotin tolerance across Elecsys sandwich and competitive immunoassays. This is reflected as differences in both the lowest concentration of biotin required to produce interference and in the maximum interference observed at high biotin concentrations. The Roche antithyroid antibodies (anti-Tg, anti-TPO and anti-TSHR) are exquisitely sensitive to low biotin concentrations, whereas assays such as CA125, CA19-9, CA15-3, CEA and human chorionic gonadotropin (hCG) + Beta are relatively resistant to interference at low concentrations. At very high concentrations of biotin, mirroring those achievable with high-dose biotin therapy (300 mg daily), all assays are affected; however, again, the absolute magnitude of effect ranges from profound to more modest, depending on the analyte. It is important to note that, particularly for competitive immunoassays, the effect of biotin is dependent to some extent on the analyte concentration. Competitive immunoassays are subject to more marked interference (proportionally) when the concentration of analyte is very low. This should be borne in mind when interpreting the absolute magnitude of biotin interference shown herein. In contrast, sandwich immunoassays are more consistently affected by biotin (proportionally) across the measuring range, though we have not done extensive analysis at the extremes.
Our reasons for choosing spiking experiments to characterize biotin interference were manifold. For our laboratory, this was the most accessible means of systematically characterizing the interference at different biotin concentrations and across different assays. The concentrations we examined were based on available pharmacokinetic data, 22 and their clinical relevance was supported by reproducing the patterns of interference we had observed in patients on high-dose biotin therapy who had presented to our laboratory for testing over the last year. 19 While the analysis of such patients has been extremely valuable, reliance on opportunistic presentations does not permit the necessary scope of analysis. To document the effect of biotin on troponin T, for example, would require a patient on high-dose biotin therapy to present with an acute myocardial infarction or other pathological cause of elevated troponin. Furthermore, opportunistic analysis does not allow examination of a wide range of defined concentrations. Moreover, spiking allowed the most direct assessment of analytical bias, as we could compare spiked with non-spiked samples for each assay, whereas the analysis of patient samples requires either concurrent measurement on a non-biotin-affected platform, or repeat measurement after withholding biotin for several days. This introduces the added confounders of intermethod biases or biological variability, respectively, which might otherwise obscure the fine detail we have been able to resolve through spiking experiments. We are confident our characterization faithfully represents the patterns we have seen thus far in patients on high-dose biotin therapy and that the more tolerant and more sensitive assays are well captured. 19 Our inferences relating to biotin dose are based on what is currently known on biotin pharmacokinetics. 22 More extensive pharmacokinetic data on high-dose biotin therapy (including biological variability and the impact of renal impairment) would be a valuable complement to our data and interpretation.
The potential limitation of spiking is that our analysis defines interference from pure biotin, whereas serum samples from patients on high-dose biotin therapy will contain biotin as well as biotin metabolites. The major metabolic fates of biotin in vivo are β-oxidation and sulphur-oxidation, forming bisnorbiotin and biotin sulfoxide, respectively. 22 With administration of 0.5 mg, 2 mg and 20 mg biotin, the major species in plasma is native biotin, and more than 50% of the total biotin metabolites excreted in the urine are (unchanged) biotin. 23 In vivo metabolites that preserve the ureido ring of biotin still bind streptavidin, but with reduced affinity; thus, the major biotin metabolites in human plasma (bisnorbiotin and biotin-sulfoxide) will not cause as profound interference as native biotin. 24 Although we cannot be certain that the dose–response curves shown herein are identical to those seen with biotin ingestion, they model the primary interferent, biotin, and in that respect are valuable.
The differences in tolerance to exogenous biotin shown herein might offer insight into the likely analytical impact of 5 and 10 mg biotin supplements on various analytes when measured by Roche immunoassays. Marketed for skin and hair health, these supplements are available without prescription and introduce the risk of biotin interference into the general community. Their prevalence of use, however, is unknown, rendering this a difficult area for risk assessment. The average plasma concentration after 5 or 10 mg biotin has not been reported, but previous studies examining 1.2 mg biotin intake in 15 healthy volunteers showed average plasma concentrations of 3.7 ng/mL 3 h after an acute dose and 5.5 ng/mL after chronic intake for two weeks.
25
Extrapolating to 5 and 10 mg doses, respective peak biotin concentrations of around 15 to 30 ng/mL seem plausible. It is worth noting that for the majority of assays examined, 31.3 ng/mL biotin produces minimal analytical bias. However, for the most sensitive assays, the analytical bias is significant at this concentration of biotin. The sandwich immunoassays TSH and troponin T demonstrate more than 20% negative bias at this concentration, while for the competitive immunoassays anti-TPO, anti-Tg and anti-TSHR, more than two-fold positive bias is seen. The general community risk for biotin interference is therefore likely to be more prominent for these assays that are sensitive to lower biotin concentrations. For the majority of assays, however, the risk of 5 and 10 mg biotin supplements may be less than currently feared on the Roche platform. One setting in which this may not apply is in renal insufficiency. Biotin is almost exclusively cleared by the kidneys; hence in renal failure, significant accumulation of biotin and its metabolites is expected. Of note, marked PTH interference has been reported on the Roche platform in a patient with end-stage kidney disease who was taking 10 mg biotin, daily. From our data, we would expect less dramatic interference with the PTH assay from this dose of biotin; however, renal impairment is likely to have exacerbated the interference.
20
Simulation of the effect of high-dose biotin therapy on (a) competitive and (b) sandwich immunoassays. The effect of biotin at 15.6 ng/mL (a) and 31.3 ng/mL (b), expressed as % of control, unspiked serum samples. The results indicate average plus standard deviation three separate experiments. For all competitive (note broken axis) and sandwich immunoassays, this concentration of biotin had a pronounced effect on measured analyte concentration.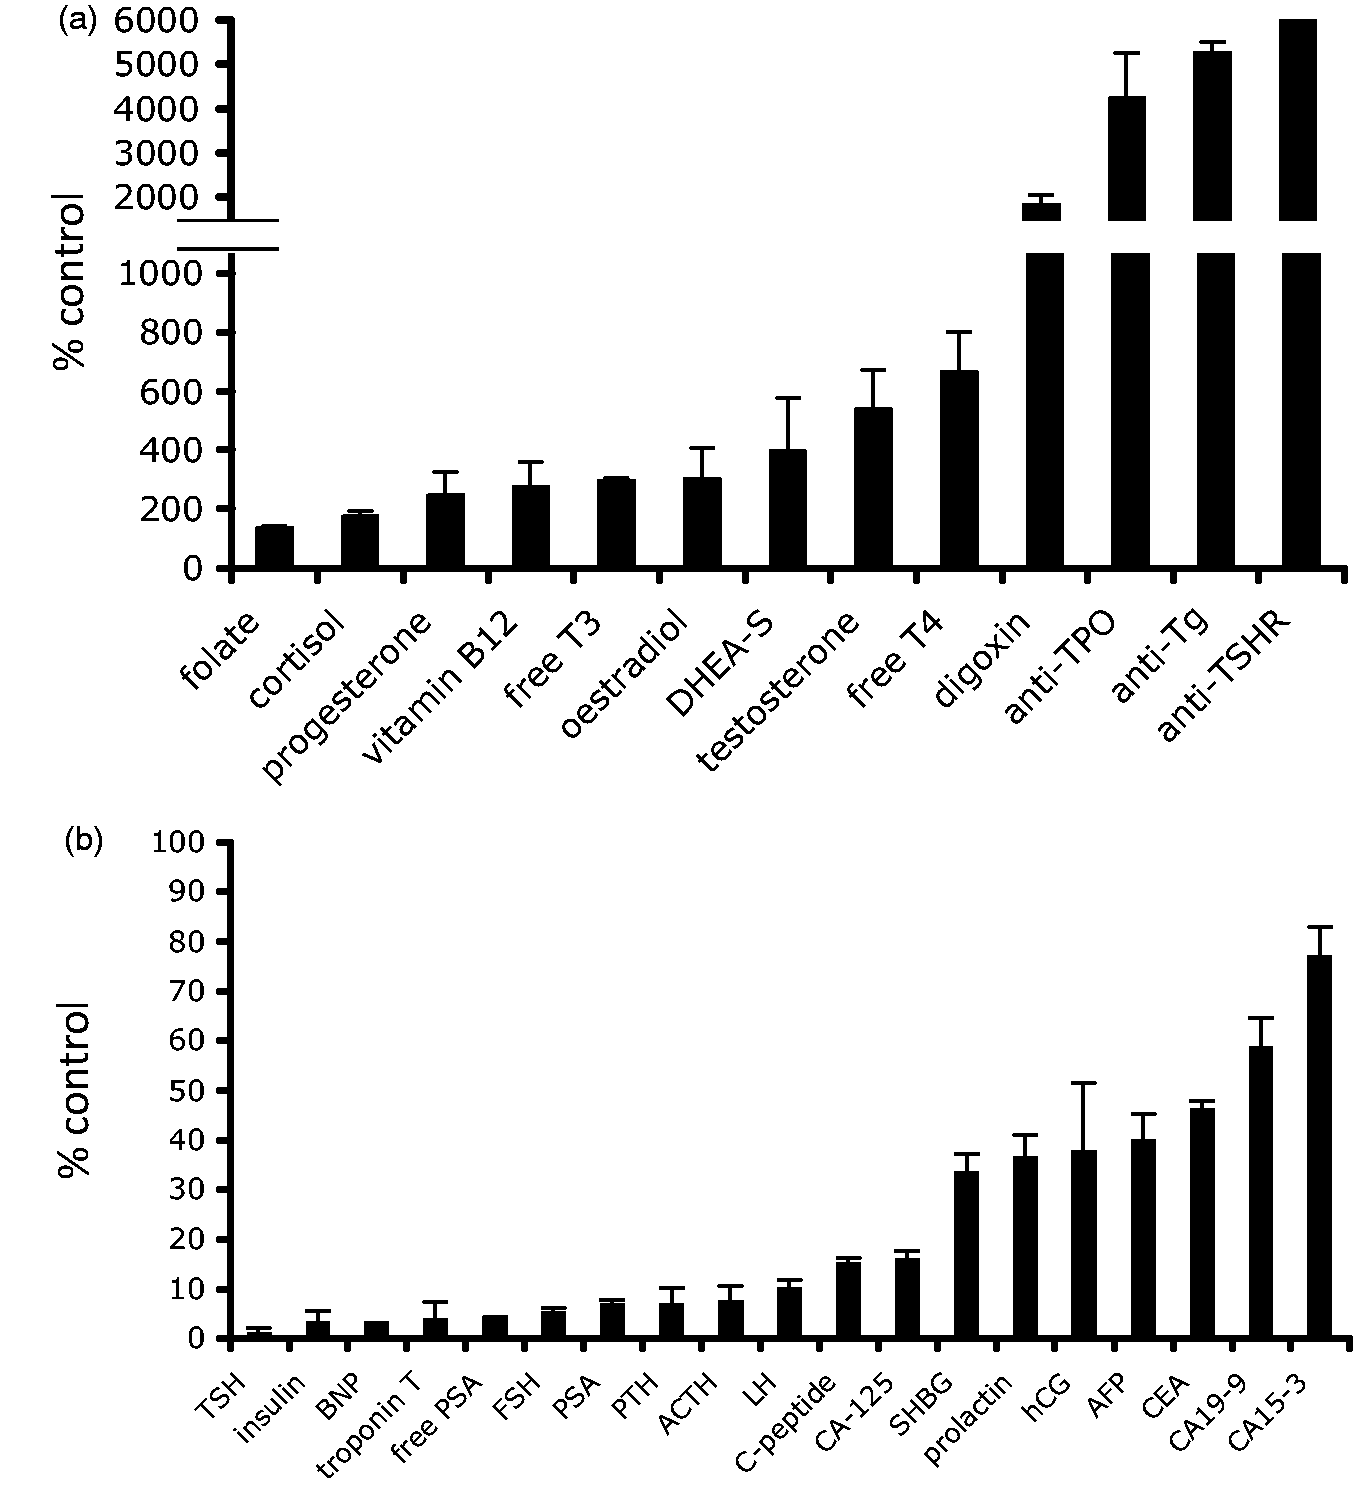
Our data may also be used to predict the magnitude of interference in different Roche immunoassays when biotin is taken at different times prior to blood collection, and the time required to withhold biotin prior to testing. There are currently several different estimates for biotin clearance. For microgram doses, the half-life has been calculated at approximately 1.8 h, 26 but more recent data on 100 to 300 mg biotin gave half-life estimates of between 7.8 and 18.8 h. 22 In high-dose biotin therapy, we would expect those less-sensitive assays mentioned above to require fewer half-lives to fall below the tolerance of the assay. In comparison, assays that are highly sensitive to biotin interference require longer to fall below the assay tolerance. The recent American Thyroid Association Guidelines on Hyperthyroidism recommend cessation of high-dose biotin therapy for at least two days prior to blood tests to assess thyroid function. 27 If we consider the longer biotin half-life estimate quoted above, two days represents about 2.5 half-lives. From our data, assuming a maximum peak biotin concentration of 1000 ng/mL post-300 mg dose, this would not be sufficient to reduce biotin to below the assay tolerance for Roche free T4, free T3, TSH or antithyroid antibodies, and marked analytical bias would still be expected to occur. Indeed, five half-lives would be required to reduce biotin to below the tolerance of the free T4 and free T3 assays, and TSH and antithyroid antibodies would require even longer periods of cessation. Clearly, further investigation is required to clarify biotin pharmacokinetics; however, our study does suggest that two days of biotin withdrawal may not be sufficient to remove analytical interference for TFTs and antithyroid antibodies on the Roche platform. In support of this, Kummer et al. 7 reported that withdrawal of biotin therapy for up to seven days was required to return anti-TSH receptor antibody positivity to normal ranges in some patients on high-dose biotin therapy. From our data, this assay is one of the most sensitive to interference from biotin at low concentrations.
Biotin concentrations of 500 ng/mL and above lead to gross analyte disturbance across all Roche assays although, again, some assays are more vulnerable than others. For high-dose biotin therapy, blood collected within one to two half-lives is expected to cause extensive analytical disturbance. At such elevated biotin concentrations, there are myriad potential scenarios whereby the interference might cause, at the least, clinical confusion and patient anxiety, the possibility of unnecessary testing or, more seriously, inappropriate management. Our most sobering example of biotin interference was a near-miss thyroidectomy scheduled because of apparently refractory hyperthyroidism (manuscript in preparation).
Endocrine tests are particularly vulnerable to biotin interference because the inverse pattern of interference for competitive and sandwich immunoassays can mimic pathological states of hormone excess and negative feedback to the pituitary. One would hope that the interpretation of deranged results in clinical context might protect from adverse events; however, the pattern of derangement may be very compelling, biochemically.
The high vulnerability of the troponin T assay to biotin interference is clinically concerning. Potentially, high-dose biotin therapy can lower troponin T results to below the 99th percentile cut-off, and in the early investigation of a possible acute myocardial infarction, this might conceivably lead to inappropriate discharge of a patient and potentially missed diagnosis. Again, while clinical correlation may protect from harm, a false-negative troponin in the context of atypical chest pain and non-specific ECG changes may have dire clinical consequences.
Elecsys tumour markers are in general less susceptible to interference from biotin. However, at high concentrations of biotin, significant reductions in measured values are possible even for the more resilient assays, which may cause change in patient classification. The clinical significance of this is harder to predict. In general, tumour markers should not be used for screening purposes but for follow-up only, and a ‘negative’ tumour marker screen cannot rule out cancer. In monitoring response to therapy, high-dose biotin could potentially make a poorer response appear more favourable, and in longer term follow-up, may mask relapse or recurrent disease. PSA is widely used for screening purposes and deserves special mention. Superimposed on the clinical nuances of PSA interpretation (relative to age-specific medians and the use of free:total ratios), even 5 mg biotin doses might be expected to change clinical categorization and risk stratification. Thyroglobulin also deserves special mention as a tumour marker. Our laboratory does not use the Roche platform for thyroglobulin measurement, and therefore it has not been assessed herein, but based on the manufacturer’s stated tolerance (30 ng/mL), it is equivalent to free PSA (tolerance also stated as 30 ng/mL). 21 Accordingly, from our data, biotin at 15–30 ng/mL might be expected to cause < 10% analytical bias for thyroglobulin measurement, whereas 500 ng/mL biotin may cause gross reduction in measured thyroglobulin concentrations. It is important for clinicians and laboratories to note this, particularly as another major routine platform for thyroglobulin, the Beckman Access, is also biotin-sensitive. 6 Whether the population of differentiated thyroid cancer patients is at high risk of biotin therapy or supplementation remains to be seen, but clinicians should be aware of the possibility of interference, as biotin could potentially mask residual or recurrent disease.
Pregnant women are a subgroup also requiring special mention. The prevalence of 5 to 10 mg biotin supplementation in pregnant women is not known, although might be expected to be low: many of these products include warnings against use in pregnancy and breastfeeding. In our experience, hCG + Beta was relatively robust to interference at biotin concentrations up to and exceeding 62.5 ng/mL; therefore, it seems less likely that 5 and 10 mg supplements would lead to biotin concentrations sufficient to mask a pregnancy. However, at concentrations of approximately 125 ng/mL and above, biotin begins to cause marked reduction in hCG concentrations and might conceivably lead to erroneous rule-out of early pregnancy, potentially exposing pregnant women to the risk of CT scan and other high-risk procedures.
We have focussed on Roche as it is the major platform in our laboratory, and all Roche Elecsys immunoassays are vulnerable to biotin interference. However, streptavidin-biotin technology is extensively used in routine immunoassays and multiple platforms are susceptible to interference. We would be remiss to neglect mentioning them. Like Roche, the Ortho Clinical Diagnostics Vitros platform is affected by biotin interference, with many of its electrochemiluminescence immunoassays incorporating streptavidin-coated wells and biotinylated antibodies. 28 For TFTs, however (unlike Roche), biotin interference on the Vitros platform causes falsely low TSH only, with unaffected free T4 and free T3, as the latter assays are not streptavidin based. The Beckman Coulter Access is also a vulnerable platform, with many electrochemiluminescent immunoassays affected. 29 With regard to Access TFTs, biotin interference causes elevations in free T4 and free T3, but has no effect on TSH. The Immunodiagnostic Systems iSYS platform incorporates streptavidin-coated beads and biotinylated antibodies for certain immunoassays and is therefore vulnerable to biotin interference. 30
Siemens immunoassays employ several distinct assay designs, some of which are based on streptavidin–biotin technology, but not necessarily susceptible to biotin interference. The majority of Siemens ADVIA Centaur immunoassays are not based on streptavidin–biotin technology and are therefore resistant to biotin interference. Those that do incorporate streptavidin–biotin generally use streptavidin-coated beads that are prebound to biotinylated antibody. This already complexed biotinylated antibody is not displaced by excess biotin in the sample during the assay reaction; hence, these assays are not affected by biotin interference. 31 This is also true for the majority of the Siemens Immulite immunoassays. 32 Some Siemens Centaur and Immulite assays, however, do incorporate vulnerable assay design, and these include the Centaur TnI Ultra assay, for which Siemens have recently issued a caution regarding biotin interference. 33 The Siemens Dimension Vista LOCI are widely vulnerable to biotin interference; however, the level of concentration of biotin required to cause analytical bias is apparently quite high. 34 The biotin tolerance of any given assay is ultimately a function of the assay design and particular assay microenvironment. It is important to note that the biotin sensitivity characterized herein applies specifically to Roche Elecsys immunoassays and cannot be extrapolated to other biotin-sensitive platforms. Their biotin tolerance will need to be determined empirically.
Notably, the Abbott Architect and the DiaSorin Liaison XL platforms stand out as the major routine platforms that have not widely incorporated streptavidin–biotin technology into their immunoassays and are resistant to biotin interference. In the case of Architect, this applies to every immunoassay, none of which are susceptible to biotin interference. 35 For Liaison XL, the vast majority of assays are unaffected; to our knowledge, only one immunoassay is vulnerable to biotin interference. 36
With the current attention on biotin interference, it is prudent to reiterate that average dietary intake (30 µg/day 37 ) and standard multivitamin formulations (containing biotin in microgram amounts) do not elevate plasma biotin concentration sufficiently to interfere with routine streptavidin–biotin assays. There are variable estimates for the normal plasma biotin concentration (for example 0.12–0.32 ng/mL; 38 0.60 ± 0.15 ng/mL 39 ) but all are far below the tolerance of these assays. High-dose biotin of 300 mg daily in MS represents more than 10,000 times the average intake.
Both the adoption of high-dose biotin therapy in MS and the increased availability of 5–10 mg biotin supplements have recast biotin interference from a low frequency event to one with a pervasive risk to laboratories and patients. Laboratories are now at a higher risk of reporting erroneous results, and clinicians and patients at increased risk of resultant clinical confusion and adverse events. Manufacturers are obliged to respond to this increased risk and improve the biotin tolerance of their immunoassays. In the mean time, laboratories must take precautions. We hope that in explicating the patterns of biotin interference across different assays, we equip laboratories with tools to assess this newly increased threat and respond to it. Our data can be used by laboratories to set surveillance thresholds to identify biotin interference. It can also be used to extrapolate the number of half-lives required to reduce biotin to below the tolerance of particular assays. However, there is clearly great need for further innovation in this area, to prevent clinical harm from the significant problem of biotin interference.
Footnotes
Acknowledgements
We are grateful to the scientists and staff of Melbourne Pathology’s Collingwood laboratory for assistance and support with this research. We are also grateful to scientists in Biochemistry at The Royal Melbourne Hospital Pathology laboratory, and Melbourne Pathology’s Epworth laboratory for analysing TSH receptor antibodies and pro-BNP, respectively.
Declaration of conflicting interests
The author(s) declared no potential conflicts of interest with respect to the research, authorship, and/or publication of this article.
Funding
The author(s) received no financial support for the research, authorship, and/or publication of this article.
Ethics
Not applicable.
Guarantor
CT.
Contributorship
CT conceived the study, designed and performed the experiments, reviewed the literature, performed the data analysis and interpretation, and wrote the first draft of the manuscript. KS was involved in analysis and interpretation of data, revision of the manuscript and supervised the project. ZL and TY were involved in data interpretation and execution of the project. All authors reviewed and edited the manuscript and approved the final version.