
Abstract
Background
Measured (MO) and calculated osmotic concentrations (CO) and the osmotic gap (OG) are commonly used in the investigation of electrolyte and volume disturbances as well as in cases of suspected volatile ingestion.
Methods
We compared 38 published formulae for CO with MO on a large data-set (n = 9466) and adjusted the CO with the result of a Passing-Bablok regression procedure. Validation of this adjustment was performed with a separate data-set (n = 2082).
Results
All but one of the CO formulae underestimate MO due to a proportional bias (slope 0.67 to 0.95) and the OG limits were therefore not applicable throughout the observed range. Using Passing-Bablok regression to adjust the CO: CO#3 = (2 × Na+urea+glucose−14.54)/0.93. After adjustment, the mean OG was 0.3 mmol/L with a SD of 5.1 mmol/L across the measurement interval. The distribution of the OG could be fully explained by the analytical imprecision of the measured components.
Conclusions
Simple adjustment of the CO for the proportional underestimation of MO allows OG reference limits of approximately −10 to +10 mmol/L to be used, even in the upper ranges of CO in patients with suspected volatile ingestion.
Keywords
Introduction
The activity of water in aqueous solutions is expressed as osmolality and this determines the colligative properties of solutions such as vapour pressure, osmotic pressure, boiling point elevation and freezing point depression.1,2 The osmotic concentrations of serum and urine are invaluable to investigate the disturbances of electrolyte and water homeostasis. Furthermore, the serum osmotic gap (OG) derived from the difference between the measured osmotic concentration (MO) and calculated osmotic concentration (CO) is an important indicator of pseudo-hyponatraemia and suspected volatile ingestion (e.g. methanol and ethylene glycol poisoning).
Osmolality is defined as the quotient of the negative natural logarithm of the rational activity of water and the molar mass of water and expressed in units of mol/kg. 1 Since the mass density of water is approximately 1 g/cm, 3 this is practically equal to the osmotic concentration expressed in mol/L. In biological fluids, the osmotic coefficient approaches unity, and therefore the osmotic concentration can be directly compared with the sum of the solute substance concentrations.1,2 The obsolete term ‘osmolarity’ is commonly used when the osmotic substance concentration is derived from commonly measured constituents in serum, while osmolality is used when this property is estimated directly by a technique such as freezing point depression. 3 In accordance with the IFCC and IUPAC recommendations, we have consistently used the terms CO, MO and OG with units reported as mmol/L and assumed that 1 mmol/L = 1 mmol/kg. 1
Regression equations obtained from the comparison of calculated osmotic concentration with measured osmotic concentration using 38 published formulae.

CO: calculated osmotic concentration; MO: measured osmotic concentration; Na: sodium; K: potassium.
Periodically, new proposed formulae are published to achieve a better correlation and/or agreement with the measured osmolality, which suggests that none perform as expected.7,9,10
In our institution, CO#1 has been used historically with a reference interval of 275 to 295 mmol/L, and an OG with a reference interval of −10 to 10 mmol/L. We noticed that an elevated OG tended to occur more frequently with elevated MO and CO, which led us to analyse historical data to investigate whether this was a consequence of constant or systematic bias and if it was amenable to a simple correction. We further tested the hypothesis that the OG is a simple function of the combined analytical imprecision of the measured parameters.
Methods
We extracted historical data for five years from our laboratory information system, where MO, sodium, potassium, urea and glucose were performed on the same sample. We excluded samples where ethanol, methanol, ethylene glycol or isopropanol were detected. All analytes were measured on Beckman Coulter DXC chemistry analysers (Beckman Coulter Diagnostics, Brea, CA, USA). The electrolytes were measured by indirect potentiometry; urea measured by a two-step enzymatic assay utilizing urease and glutamate dehydrogenase; and glucose was measured by a glucose oxidase method linked to an oxygen-sensing electrode. Serum osmolality was measured by freezing point depression (Advanced Instruments Inc. Norwood, MA, USA) over this period. CO were calculated with 38 published formulae. Quality control (QC) data obtained over a six-month period for sodium, potassium, urea, glucose and MO were used to calculate the expected OG due to analytical variance.
Regression analysis was performed with the Passing-Bablok technique. Outliers were excluded if the residuals were greater than 3.5 standard deviations with the first analysis after which the regression was repeated. Analyses of the differences (OGs) were performed according to the method of Altman and Bland. A validation data-set was obtained over a separate calendar year to test the reproducibility of any correction factors. Statistical analyses were performed with Analyse-It v2.3 (Analyse-It Software Ltd. Leeds UK).
Results
In the test data-set, 9571 samples with MO, electrolytes, urea and glucose were retrieved of which 105 samples were excluded as outliers (see Figure 1). The MO ranged between 201 and 414 mmol/L. The validation data-set contained 2082 observations with MO ranging between 221 and 399 mmol/L. All but one of the 38 CO formulae demonstrated a systematic negative bias between the CO and MO (see Table 1) which in turn resulted in a progressive increase of OG with increased serum osmolality. CO#3 was used subsequently.
Passing-Bablok regression of the calculated osmotic concentration relative to the measured osmotic concentration.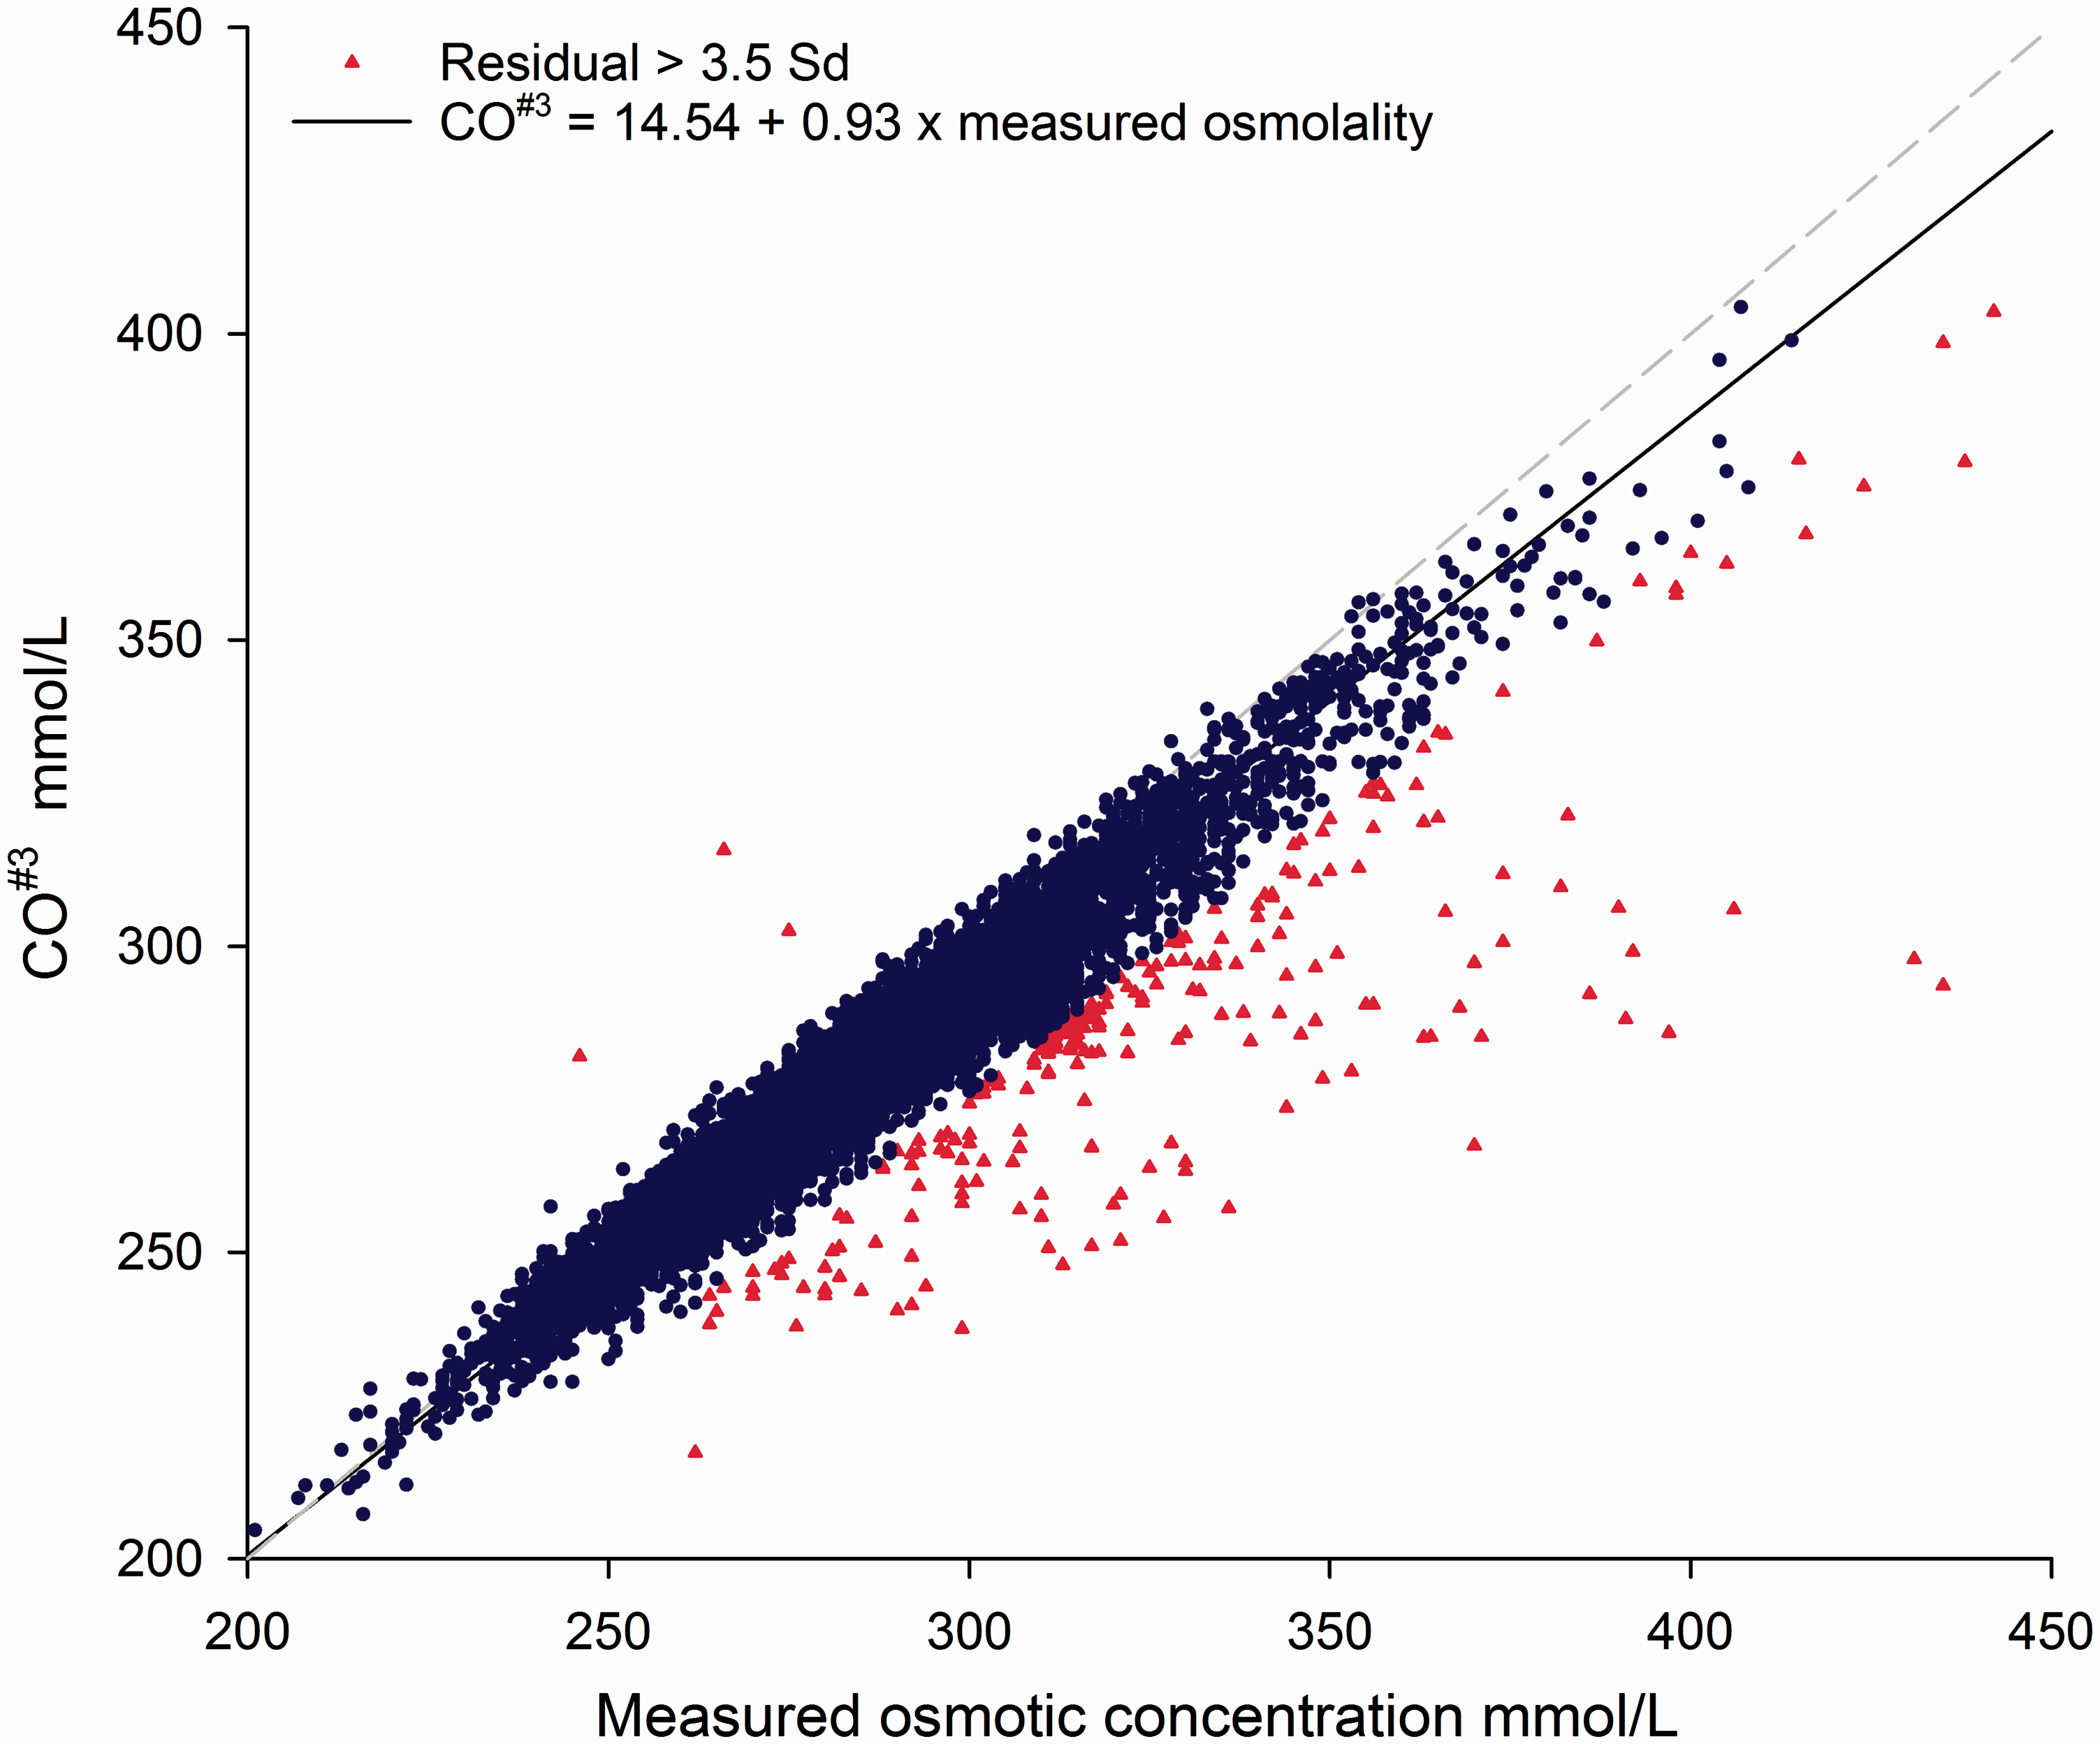
As seen in Figure 2, the OG between CO#3 and the MO revealed a mean bias of 5.1 mmol/L with a 95% limits of agreement between −5.1 to 15.2 mmol/L and a trend of increased OG at higher osmolality (R2 = 0.153). Using the regression (CO#3= 0.93 × MO+14.54) simple algebraic rearrangement produces the formula CO#3 = 2.15 × Na+1.07 × urea+1.07 × glucose−15.63. After correcting CO with the regression equation formula, the mean bias decreased to 0.3 mmol/L (95% limits −10.4 to 9.9 mmol/L) and with virtually no correlation with the osmotic concentration (R2 = 0.01). Applying this correction to the CO#3 results of the validation data-set, the regression equation had a slope of 1.01 and an offset of −0.76 mmol/L with the 95% limit of agreement for the differences between −11.4 and 9.1 mmol/L.
Osmotic gaps before and after adjustment of the calculated osmotic concentration.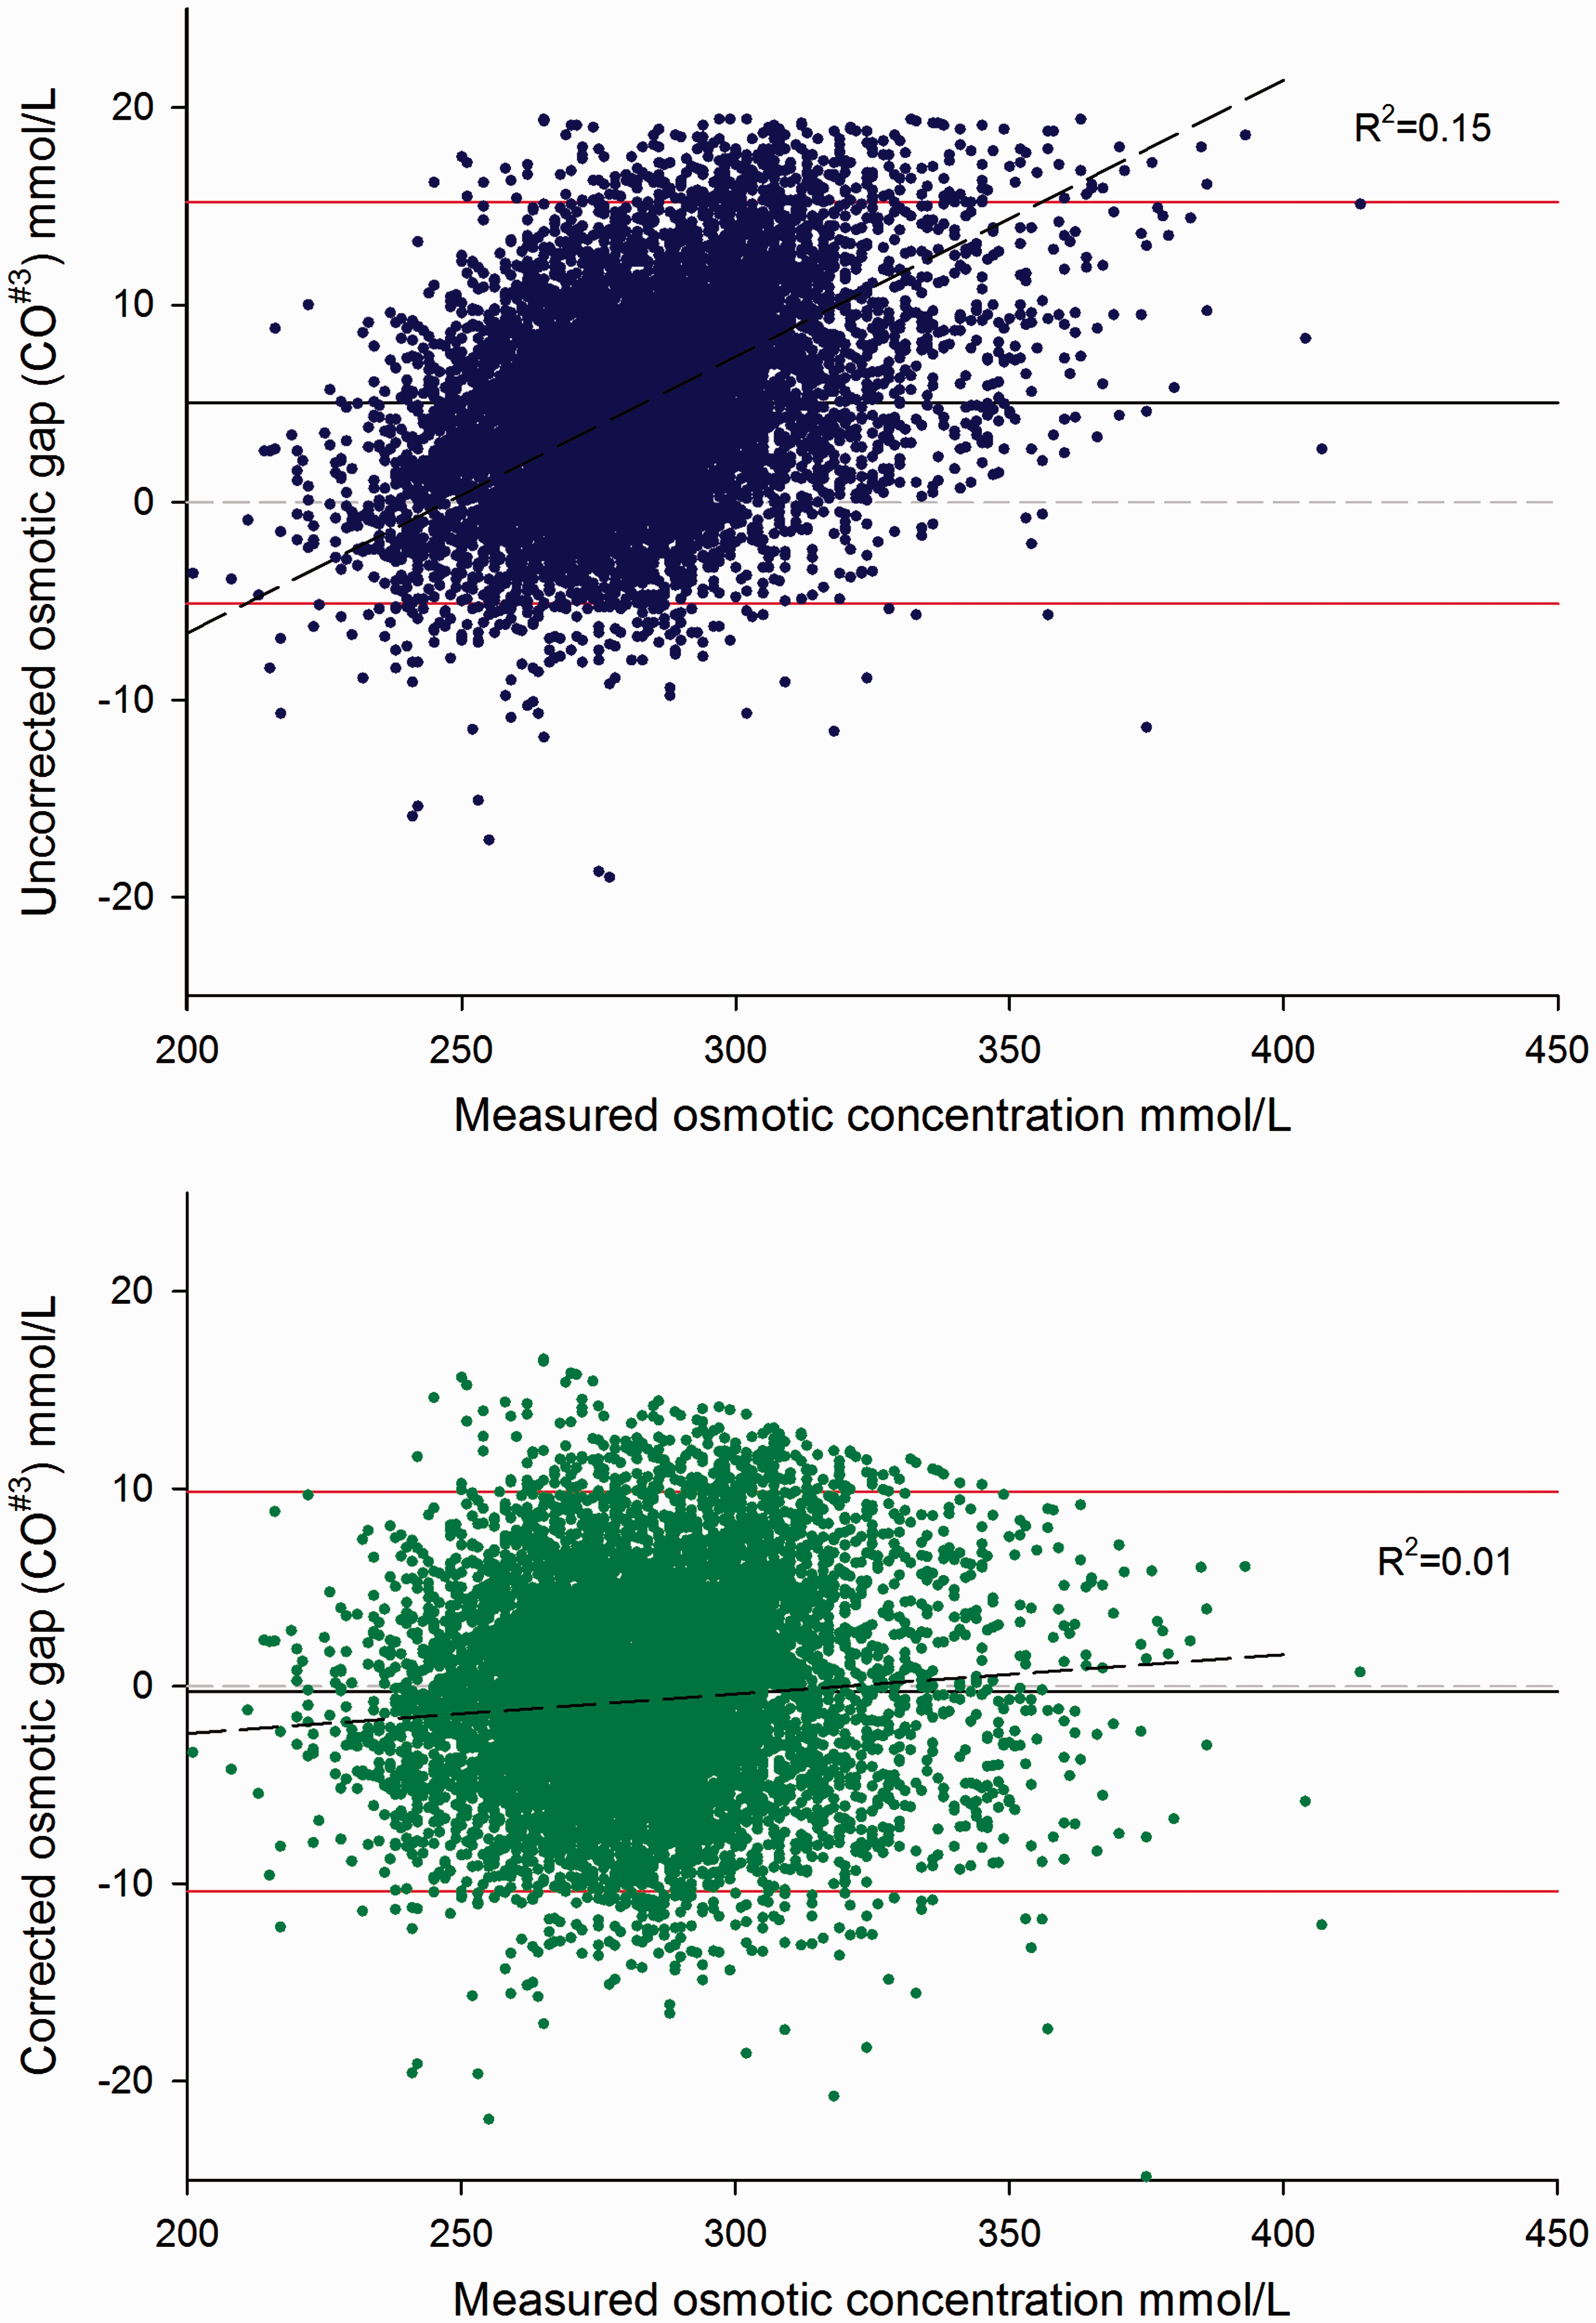
The predicted variances of the OG were calculated from the analytical imprecision data obtained from QC material over a six-month period. The respective means (SD) were: MO 332 mmol/L (4.5 mmol/L), sodium 151.3 mmol/L (1.2 mmol/L), potassium 6.8 mmol/L (0.08 mmol/L), urea 18.3 mmol/L (0.37 mmol/L) and glucose 16.4 mmol/L (0.027 mmol/L). The predicted SD for OG calculated with CO#3 were 5.1 mmol/L and the predicted 95% limits of ±10 mmol/L agreed well with the observed distributions of both the test and validation sets.
Discussion
‘The definition of insanity is doing the same thing over and over again and expecting a different outcome’. This statement has been variously attributed to Albert Einstein, Mark Twain and Benjamin Franklin. The proliferation of published formulae for CO implies that none are robust across laboratories and over time. The data-sets used have characteristically been relatively small, ranging from 100 to 715 samples, and many used a relatively narrow range of osmotic concentration. In addition, each formula is derived from a separate population, with different analytical methods or platforms, and at different time points. Unsurprisingly, small variations to tweak the formula yield a marginally improved fit on the specific data-set, but are not universally applicable to all laboratories.
Our data demonstrate that none of the formulae used for serum CO performed satisfactorily across the range of results found in clinical practice. The proportional bias of the CO resulted in an apparently increased OG at high concentrations which decreased the clinical utility of the procedure. We confirmed the proportional underestimation of MO with 38 published formulae, with a consistent pattern of underestimation of MO in all but one, which overestimated the MO. In view of the good correlation with MO, and in line with recent Australian harmonization recommendations, CO#3 was used to illustrate the correction. 11
We propose that laboratories use a published CO formula and adjust this with the results of a regression against MO over a suitable number and range of patient samples to eliminate proportional bias.
There is considerable variation in the reported mean OG with most being around 5 mmol/L with a SD of approximately 5 mmol/L. 10 Our data show that the variance in OG was fully explained by the analytical variances of the components of the CO formula. This suggests that there is little need to invoke the unmeasured osmotically active substances, as suggested by some authors, 12 in the absence of volatile ingestion or analytical interference or error. The predicted variance agreed well with the directly observed variance of ∼ −10 to +10 mmol/L. Other authors have previously documented that very few of the numerous formulae have a reference interval of −10 to +10 mmol/L, although the range was approximately 20 mmol/L. 7 Our view is that there is no benefit to be gained from adjusting the mean OG by adding a constant to the correction factor.
Using a large data-set, we have shown that a proportional bias leads to an underestimation of the osmotic concentration in the upper range in agreement with other authors.13,14 This is especially problematic when applying ‘rule of thumb’ reference limits of −10 to +10 mmol/L to screen for volatile ingestion.13,15 A sensible solution is to correct for the proportional bias so that the same reference limit can be applied across the full spectrum of measured osmolality. The wide reference interval for OG cautions against its use to detect smaller ingestions of volatile substances.
Strengths of our paper are the large data-set of 9466 samples, a wide range of measured osmolality and the validation of our approach in a separate set of 2082 samples. The determination of the correction involves simple linear regression without the requirement for more sophisticated statistical techniques such as multivariate regression analysis. 8 Furthermore, this approach lends itself to monitoring temporal changes that have been reported 7 and applying correction factors as needed.
In conclusion, most formulae for CO underestimate osmolality in the upper range, and subsequently, the application of common OG reference limits is misleading. Correction of proportional bias allows the OG reference limits of −10 to +10 mmol/L to be used throughout the range, even in the upper range where patients with suspected volatile ingestion are likely to occur.
Footnotes
Acknowledgements
We would like to thank Karen Noy for her assistance in the collection of the QC data.
Declaration of conflicting interests
The author(s) declared no potential conflicts of interest with respect to the research, authorship, and/or publication of this article.
Funding
The author(s) received no financial support for the research, authorship, and/or publication of this article.
Ethical approval
Not applicable.
Guarantor
UW.
Contributorship
UW, CJP, JPJU designed the study. UW collected the data. UW and CJP performed the statistical analysis. UW wrote the first draft of the manuscript. All authors contributed, reviewed and approved the final manuscript.