
Abstract
Background
Azole-based antifungals are the first-line therapy for some of the most common mycoses and are now also being used prophylactically to protect immunocompromised patients. However, due to variability in both their metabolism and bioavailability, therapeutic drug monitoring is essential to avoid toxicity but still gain maximum efficacy.
Methods
Following protein precipitation of serum with acetonitrile, 20 µL of extract was injected onto a 2.1 × 50 mm Waters Atlantis dC18 3 µm column. Detection was via a Waters Quattro Premier XE tandem mass spectrometer operating in ESI-positive mode. Multiple reaction monitoring (MRM) detected two product ions for each compound and one for each isotopically labelled internal standard. Ion suppression, linearity, stability, matrix effects, recovery, imprecision, lower limits of measuring interval and detection were all assessed.
Results
Optimal chromatographic separation was achieved using gradient elution over 8 minutes. Voriconazole, posaconazole and itraconazole eluted at 1.71, 2.73 and 3.41 min, respectively. The lower limits of measuring interval for all three compounds was 0.1 mg/L. The assay was linear to 10 mg/L for voriconazole (R2 = 0.995) and 5 mg/L for posaconazole (R2 = 0.990) and itraconazole (R2 = 0.991). The assay was both highly accurate and precise with % bias of voriconazole, posaconazole and itraconazole, respectively, when compared with previous NEQAS samples. The intra-assay precision (CV%) was 1.6%, 2.5% and 1.9% for voriconazole, posaconazole and itraconazole, respectively, across the linear range.
Conclusion
A simple and robust method has been validated for azole antifungal therapeutic drug monitoring. This new assay will result in a greatly improved sample turnaround time and will therefore vastly increase the clinical utility of azole antifungal drug monitoring.
Keywords
Introduction
Chemical structures and selected pharmacokinetic parameters for voriconazole, posaconazole and itraconazole.
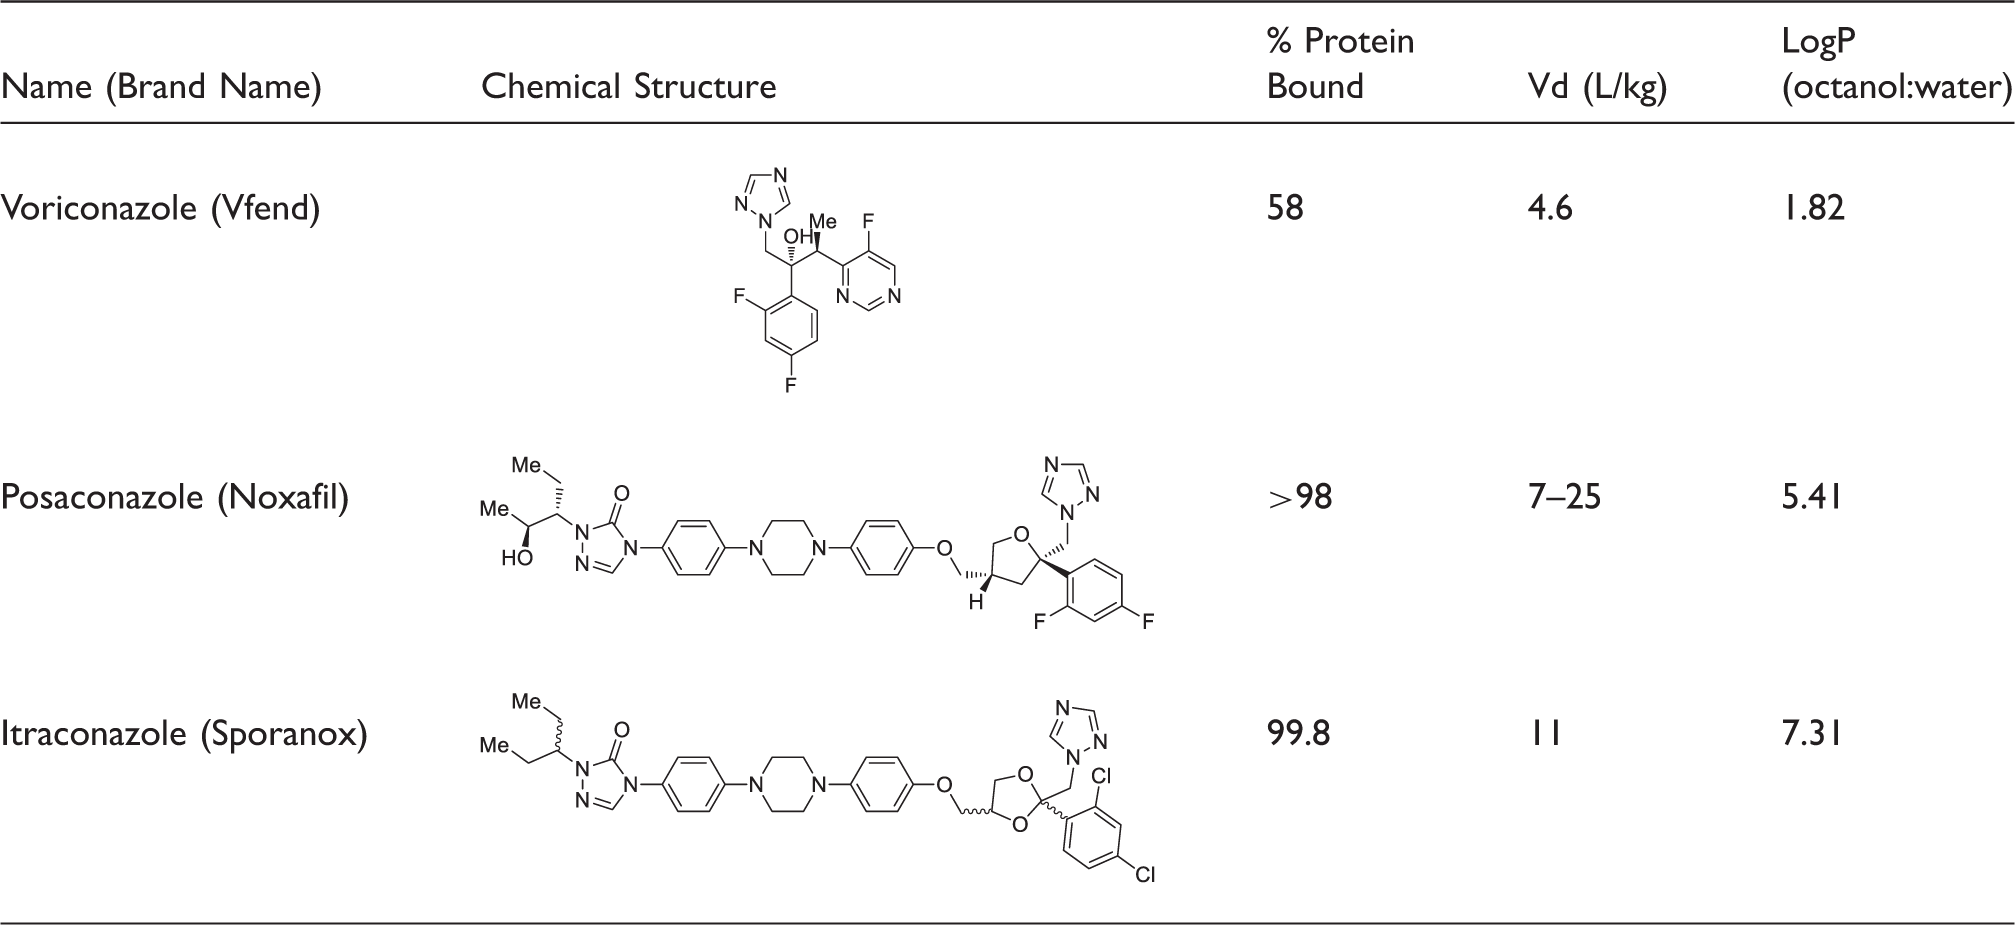
Vd: volume of distribution.
The use of these newer antifungals is increasing as a direct result of the rise in invasive fungal infections (IFIs).2,3 IFIs are the collective name given to any deep tissue mycoses, which can be fatal unless effectively treated. The increased danger of IFIs is associated with the prerequisite that only immunocompromised patients are susceptible to these infections. Therefore, the development of a deep tissue fungal infection in patients currently receiving chemotherapy, on immunosuppressive therapies or with other co-morbidities requires prompt, effective treatment to avoid mortality.
From the chemical structures alone, it is apparent that posaconazole and itraconazole will be hydrophobic, which is confirmed by their highly protein bound nature (in the aqueous serum environment) and their high partition coefficients (log P values) (Table 1). The variation in hydrophobicity between the three antifungals is known to confer differences in bioavailability and would also be expected to be problematic during chromatography development. Unfortunately, all three of these antifungal drugs have a non-linear relationship between dose and efficacy; therefore, therapeutic drug monitoring (TDM) is essential. 4 Indeed, recent meta-analysis has shown that the correct, therapeutic dose of voriconazole doubles the patient’s chances of a positive outcome. 5 Voriconazole exhibits non-linear metabolism/excretion due to variability in P450 enzymes (CYP2C19, CYP3A4 and CYP2C9) which can be either up- or down-regulated by other common drugs.6,7 Posaconazole has confirmed linear kinetics, but absorption becomes saturated with doses above 800 mg/day. 8 Itraconazole has variable bioavailability and non-linear metabolism which has been shown to arise from saturation of the hydroxylase involved in the first step of metabolism. 9 The case for TDM for all three of these drugs has been coherently made and is now recommended in treatment guidelines.10–12 However, the analysis of samples for azole TDM is still only performed in specialist regional centres resulting in delayed turnaround times. The reporting of results five to seven days after the sample is taken reduces the clinical utility of the test and has resulted in poor testing compliance from clinicians.
Although several clinical laboratories in the United Kingdom currently perform antifungal TDM using liquid chromatography tandem mass spectrometry (LC-MS/MS), to date none have published their method. Worldwide the few methods that have been published fail to address the needs of routine clinical laboratories by either publishing overly complex assays which included drugs that are not routinely monitored or have failed to validate their methods in line with the current clinical guidance.13,14 The assay presented herein offers a simple, quick and accurate method for azole TDM that has been specifically designed to be introduced alongside existing LC-MS/MS methods making azole antifungal TDM a realistic prospect for nearly all clinical laboratories.
Materials and methods
Materials
Voriconazole, posaconazole and itraconazole were purchased individually as Cerilliant standards (Sigma-Aldrich, Dorset, UK) at a concentration of 2 mg/mL in methanol. D3-voriconazole, D4-posaconazole and D3-itraconazole (Toronto Research Chemicals, Canada) were used as internal standards; these compounds arrived lyophilized and were re-dissolved in methanol to a concentration of 2 mg/mL. Then 1% hydrochloric acid (1 M) was added to the D3-itraconazole solution to aid solubility. Following initial development work using methanolic calibrators, commercial lyophilized whole blood quality control (QC) material and calibrators were purchased from both Recipe (RECIPE Chemicals and Instruments GmbH, Germany) and Chromsystems (Chromsystems Instruments & Chemicals GmbH, Germany). The internal standards were diluted in 50:50 methanol:water and used to prepare a combined working internal standard solution of; D3-voriconazole (1 mg/L), D4-posaconazole (1 mg/L) and D3-Itraconazole (5 mg/L). Both the Cerilliant standards and deuterated internal standards were stored at −20℃ until required. All methanol and acetonitrile were LC-MS/MS grade purchased from Sigma (Sigma-Aldrich, Dorset, UK). Hydrochloric acid (ACS reagent grade, 1 M) and ammonium acetate (BioXtra, ≥98%) were purchased from Sigma (Sigma-Aldrich, Dorset, UK). Formic acid (Biosolve, 99% ULC-MS) was purchased from Greyhound Chromatography (Greyhound Chromatography and Allied Chemicals, Birkenhead, UK). The water used for both dilutions and mobile phases was produced in-house using a MilliQ (Millipore, Darmstadt, Germany) purification system to a resistivity of ≥18.2 MΩ cm.
Sample preparation
Patient serum, QCs or calibrators (100 μL) were combined with working internal standard solution (100 μL) in a microcentrifuge tube. Acetonitrile (200 μL) was then added to precipitate the serum proteins. The suspension was then mixed for 15 s using a vortex mixer and centrifuged at room temperature (5 min, 10,000 × g).The sample was then sealed and stored at 4℃, until it was injected onto the column.
Chromatography
Liquid chromatography was performed on a Waters Alliance 2795 separation module. Extracted sample (25 µL) was injected onto a Waters Atlantis column 3 µm dC18 (2.1 × 50 mm) column (Waters, Hertfordshire, UK). The column was maintained at 30℃ throughout the assay. Mobile phase A contained ammonium acetate (2 mM) and formic acid (0.1 % v/v) in water. Mobile phase B had the same composition but dissolved in methanol. Initial conditions were 45% mobile phase B. Following sample injection, elution was performed by means of a multistep gradient at a constant flow rate of 0.6 mL/min starting from 45% to 75% mobile phase B over 1 min, before being held at 75% mobile phase B for a further 1 min. Following this, the proportion of mobile phase B was increased to 98% over 2 min and held at 98% mobile phase B for a further 3.5 min. Finally, the mobile phase was returned to starting conditions (45%) for the remaining 0.5 min before the next injection. An automated programme of three consecutive strong washes consisting of 100% methanol was used to clean the sample injector between sample injections.
Mass spectrometry
Mass spectrometer detector settings for quantifier, qualifier and internal standard MRM transitions.
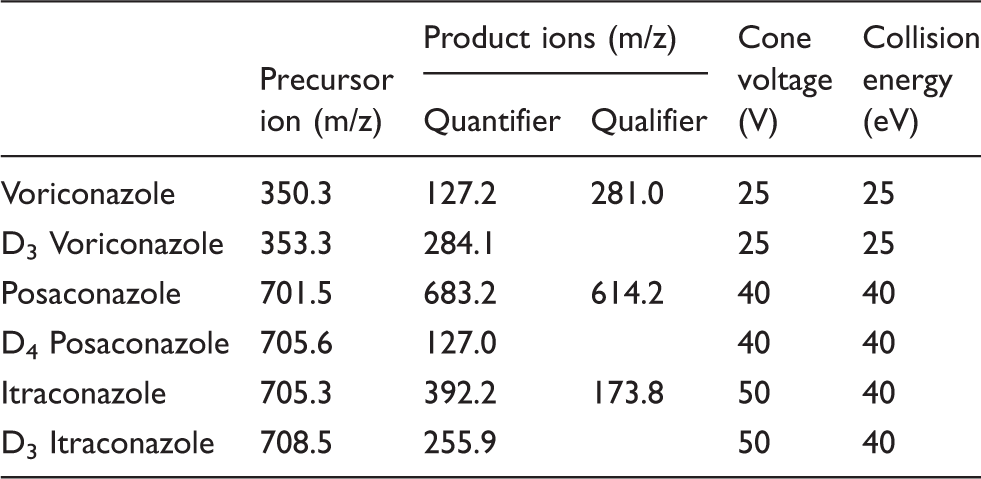
MassLynx software (Version 4.1; Waters, Manchester, UK) was used for instrument control, data acquisition, peak smoothing, peak area integration and signal-to-noise determinations. Statistical analysis was performed using a combination of Microsoft Excel (2016) and GraphPad Prism 6.
Method validation
The LC-MS/MS method was validated for precision, accuracy, recovery, linearity, sensitivity, specificity and sample stability according to published acceptance criteria.13,14
Ion suppression
Ion suppression was evaluated through both postcolumn infusion and matrix factor experiments. Each analyte (1 mg/L) in 50:50 methanol:water was infused directly into the mass spectrometer at a flow rate of 10 µL/min, while the extracted samples of either water or antifungal free patient serum were introduced separately via the auto sampler, through the column. Ion suppression/enhancement was interpreted by any fall or rise in the total baseline ion count around the retention time of the analyte.
The effect the matrix has upon the ionization and detection of ions was also investigated using matrix factor experiments. These experiments were performed in two potential matrices, water and serum. The serum of six patients (who were not currently taking any antifungal drugs) and filtered water was spiked with water, to create a blank, individually with each internal standard and with each analyte to a final concentration of 1 mg/L. The matrix factor was determined by comparison of peak areas achieved from analyses of the serum samples, to the areas achieved from the analysis of the water samples.
Linearity
Linearity was determined separately for each analyte by analysis of multiple calibrators. For voriconazole, eight calibrators with concentrations 0.1, 0.5, 1, 2, 4, 6, 8 and 10 mg/L were analysed, while for posaconazole and itraconazole seven calibrators with concentrations 0.1, 0.5, 1, 2, 3, 4 and 5 mg/L were used. QuanLynx software (Version 4.1; Waters, Manchester, UK) was used to plot nominal values against the generated LC-MS/MS peak areas. Linearity of the calibrators was confirmed if the correlation coefficient produced by weighted linear regression was >0.99.
Carryover
Carryover was assessed individually for each analyte by repeat (n = 5) analysis of the highest calibrator followed by analysis of a blank. Blank samples were defined as having no discernible peak for the analyte or internal standard at the expected retention time.
Stability
Post-extraction stability of each analyte in both patient (n = 9) and QC samples (n = 9) was assessed by repeat injections of samples over a seven-day period, after storage at either 4℃ or room temperature. The response of each analyte was then compared with the response on day 0 and the mean percentage difference calculated.
Recovery
Recovery experiments were performed individually for each of the three analytes. Serum from five patients was spiked pre-extraction with 10 µL of analyte at three different concentrations (0.1, 1 and 10 mg/L) or 100 µL of internal standard. The calculated concentrations from the samples spiked pre-extraction were then compared with the known concentration used to spike the sample.
Imprecision
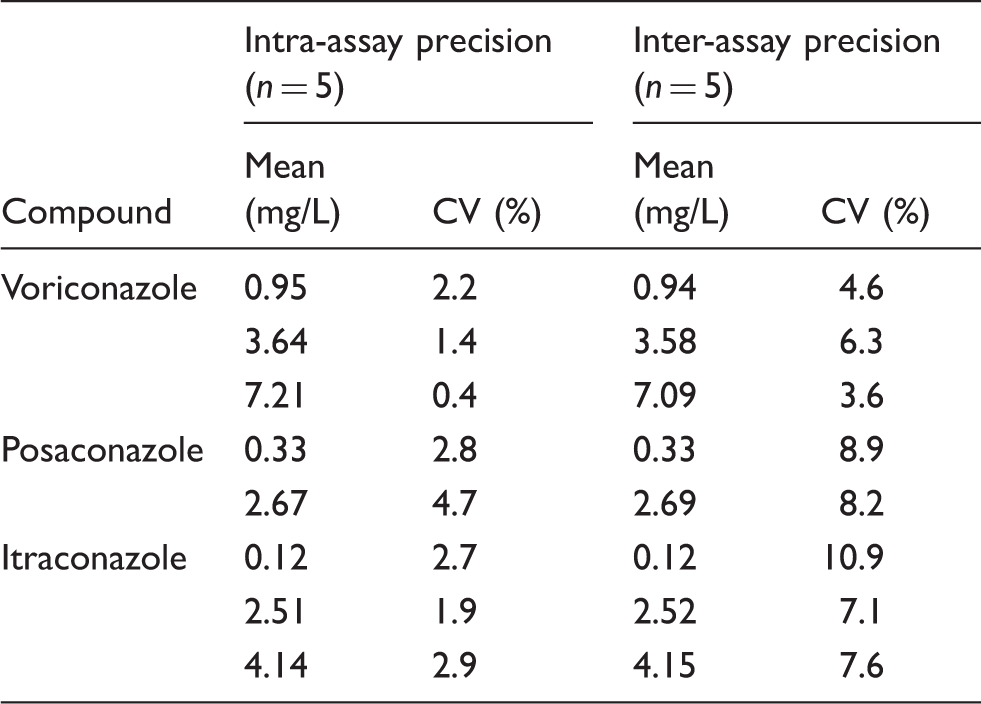
Intra-assay precision was evaluated by the analysis of five sets of QC in one batch. The commercial QC samples were analysed as unknowns and compared by the comparison of peak areas.
Inter-assay precision was evaluated by the analysis of five sets of QC on five different batches prepared and analysed on five separate, non-consecutive days.
Lower limit of measuring interval
Lower limit of measuring interval (LLMI) was determined individually for each analyte by assessment of the signal-to-noise ratio and comparison of percentage difference. LLMI was assigned to the minimum clinically relevant concentration that had a percentage difference <20% and a signal-to-noise ratio >5:1. The percentage difference was calculated by comparison of the experimentally derived concentrations from five replicates to the predicted concentration.
Accuracy
The accuracy of the assay was evaluated by the measurement of external quality assurance (EQA) samples, n = 25 for each analyte. The results were then compared against the all-laboratory trimmed mean as individual method means were unavailable.
Results
Voriconazole, posaconazole and itraconazole had retention times of 1.71, 2.73 and 3.41 min, respectively. All three compounds co-eluted with their deuterated equivalents (Figure 1). The total chromatographic run time was 8 min, a solvent divert was set up between 0–1 and 5–8 min.
(a) voriconazole (1 mg/L), (b) posaconazole (1 mg/L), (c): itraconazole (1 mg/L). Red trace – multiple reaction monitoring trace for each analyte. Green trace – multiple reaction monitoring trace for each deuterated internal standard (D3–voriconazole (1 mg/L), D4–posaconazole (1 mg/L) and D3-itraconazole (5 mg/L)).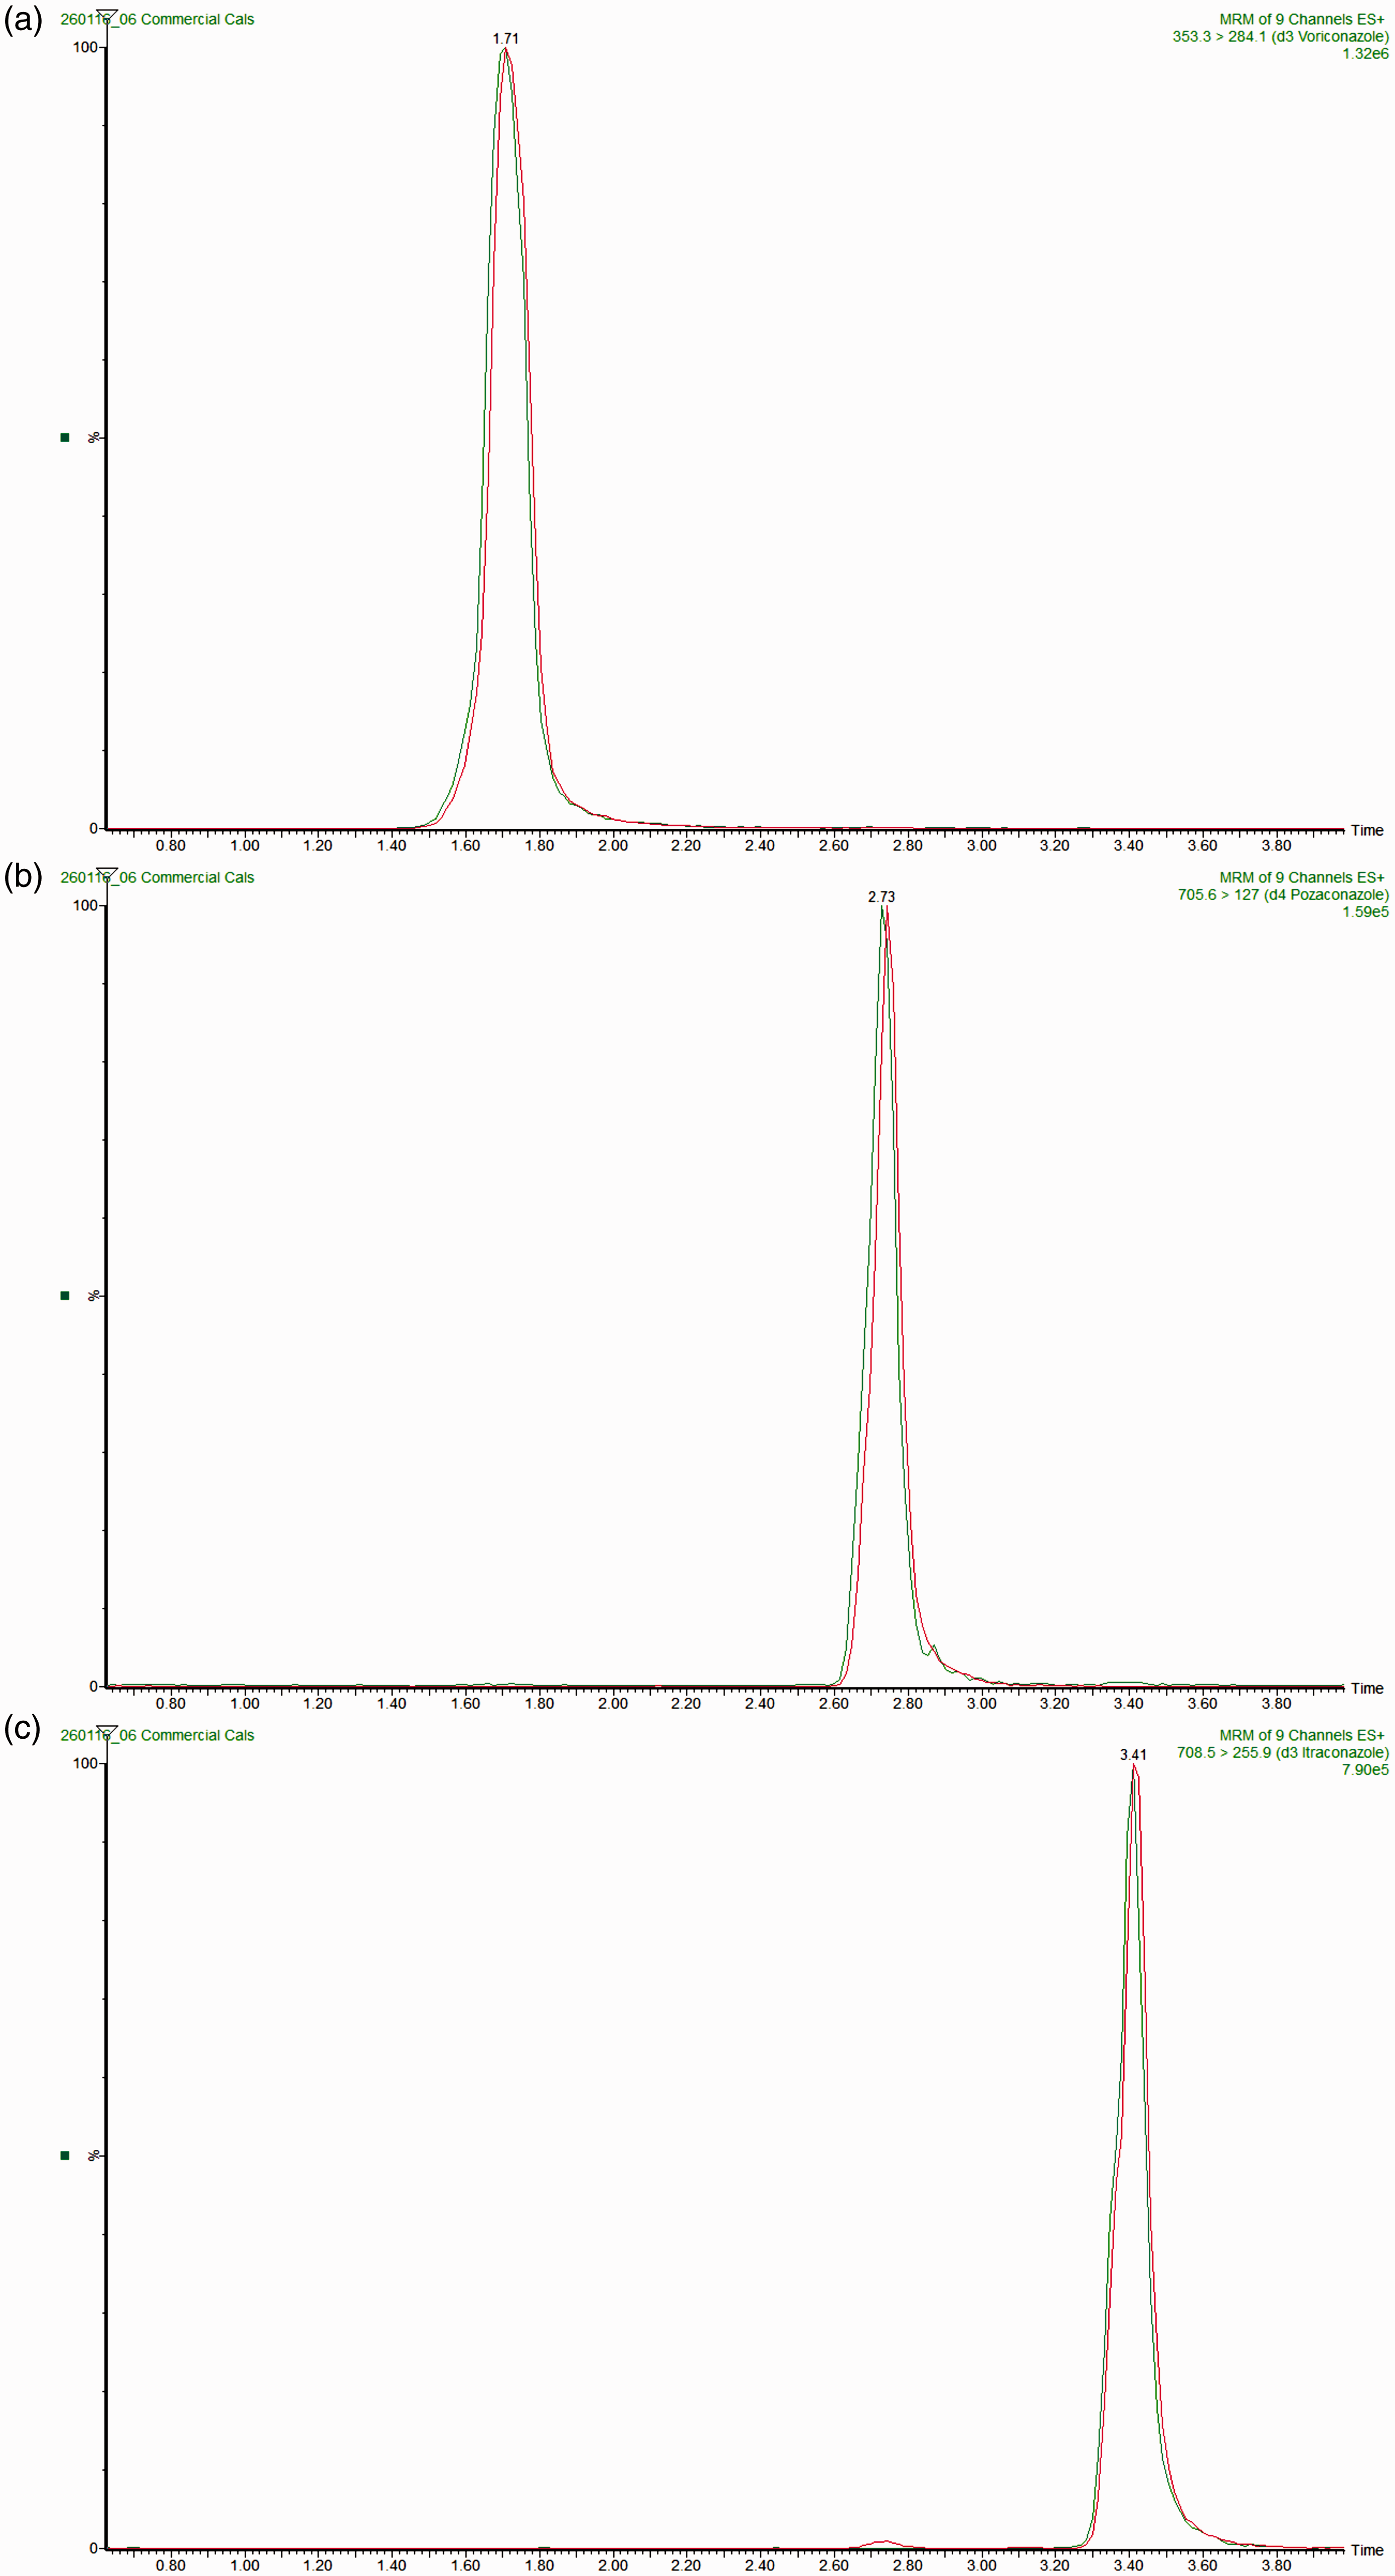
Qualitative ion suppression profiles demonstrated no significant suppression or enhancement of signal in the region of the chromatograms where voriconazole, posaconazole or itraconazole eluted (Figure 2). Additionally, quantitative ion suppression experiments, assessed by comparison of the peak areas generated from known concentration of analyte spiked into both serum samples and water yielded matrix factors of 1.01 (CV 11.8%), 1.12 (CV 16.1%) and 1.09 (CV 12.8%) for voriconazole, posaconazole and itraconazole, respectively. Similar experiments but spiking internal standard produced matrix factors of 1.22 (CV 10.6%), 1.02 (CV 6.9%) and 0.94 (CV 11.7%) for D3-voriconazole, D4-posaconazole and D3-itraconazole, respectively.
(a) voriconazole, (b) posaconazole, (c) itraconazole. Red Trace – Multiple reaction monitoring trace from the post-column infusion of each analyte (1 mg/L) and elution of blank serum. Green Trace – Overlay showing usual analyte retention time.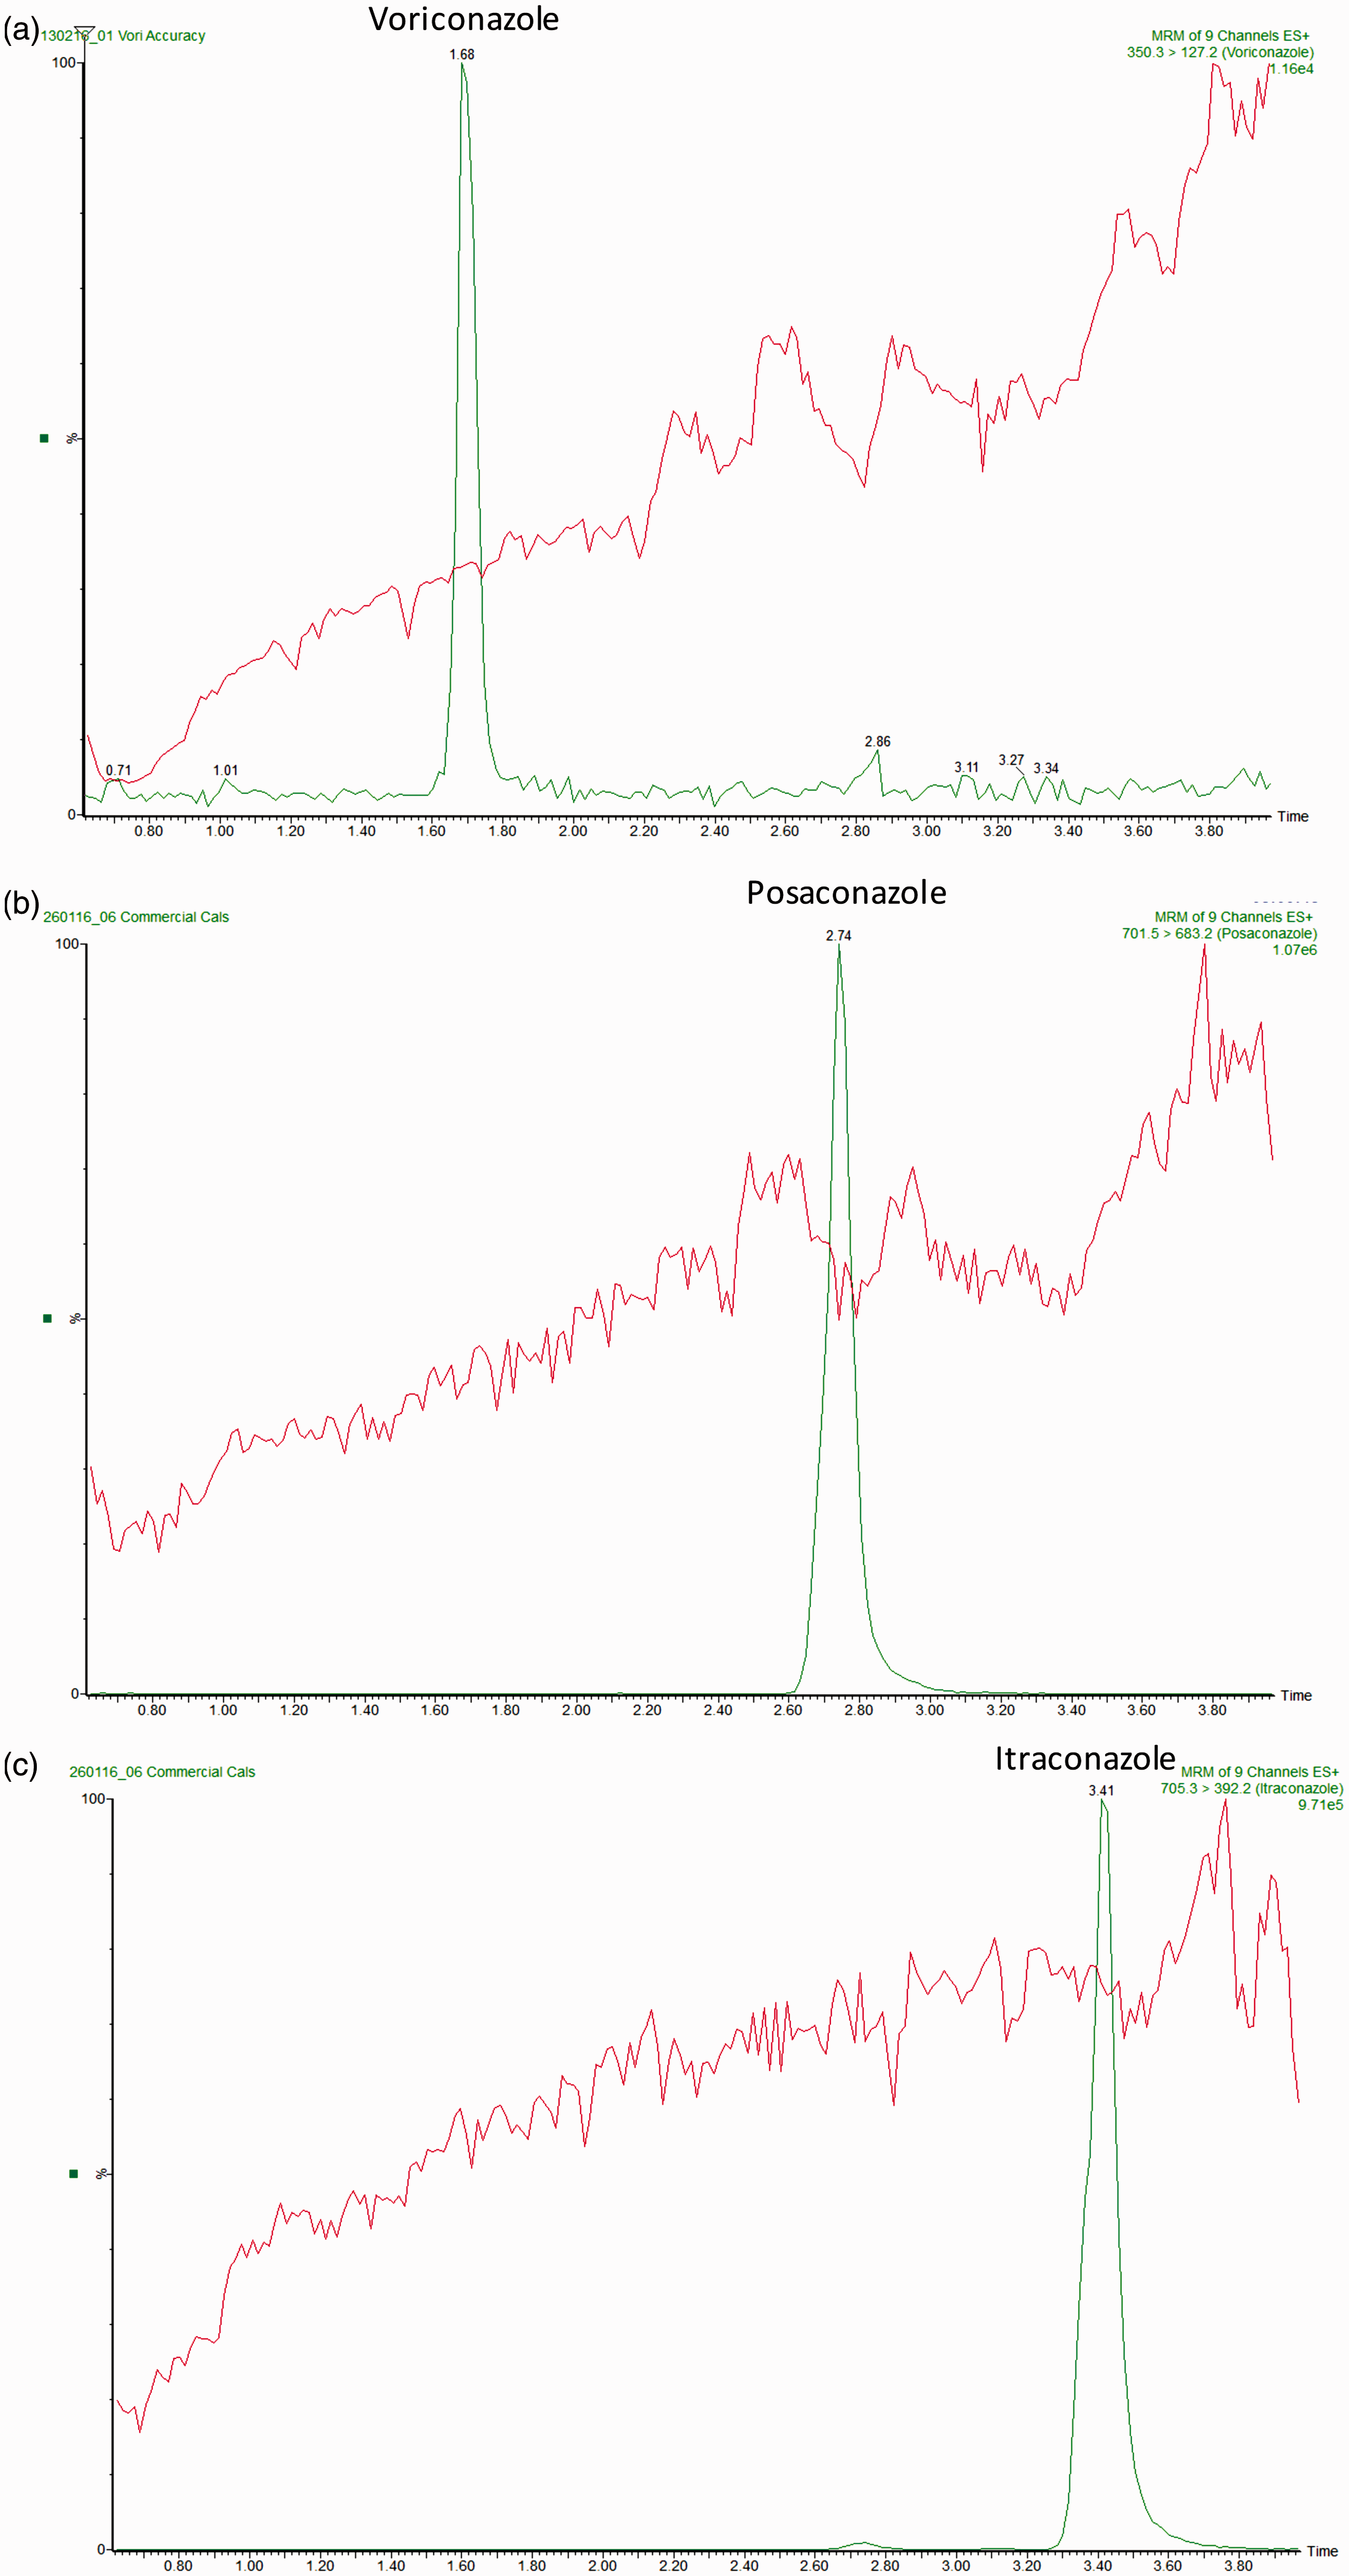
The assay was linear up to 10 mg/L for voriconazole. The linearity of itraconazole and posaconazole was only evaluated up to 5 mg/L. The linearity was assessed by linear regression analysis consistently giving R2 values >0.99. The LLMI was defined as 0.1 mg/L for all three analytes, as this was deemed the minimum clinically relevant concentration. At this concentration, the percentage difference of the experimental result compared with the predicted result for each analyte was less than <10% and the signal-to-noise ratio was >10:1. Carryover between the lowest and highest calibrators was evaluated by interspacing high calibrators with blanks and comparing the blank area to the LLMI peak area. Each of the three analytes showed no carryover with the blank area consistently less that 5% of the LLMI.
Intra- and inter-assay precision.
Due to the difficulty obtaining sufficient samples to facilitate a sample swap, accuracy was determined by the analysis of previous EQA samples (n = 25 for each analyte). The experimentally determined concentrations were compared with the published all laboratory trimmed mean (Figure 3). Mean bias from the all laboratory trim mean (ALTM) target values was −4.7%, 0.5% and 1.1% for voriconazole, posaconazole and itraconazole, respectively.
Correlation between experimentally determined analyte concentrations and National External Quality Assurance Scheme (NEQAS) targets (a) voriconazole, (b) posaconazole and (c) itraconazole. Bland–Altman plots showing absolute difference (experimental – NEQAS ALTM) vs. average concentration for (d) voriconazole, (e) posaconazole and (f) itraconazole.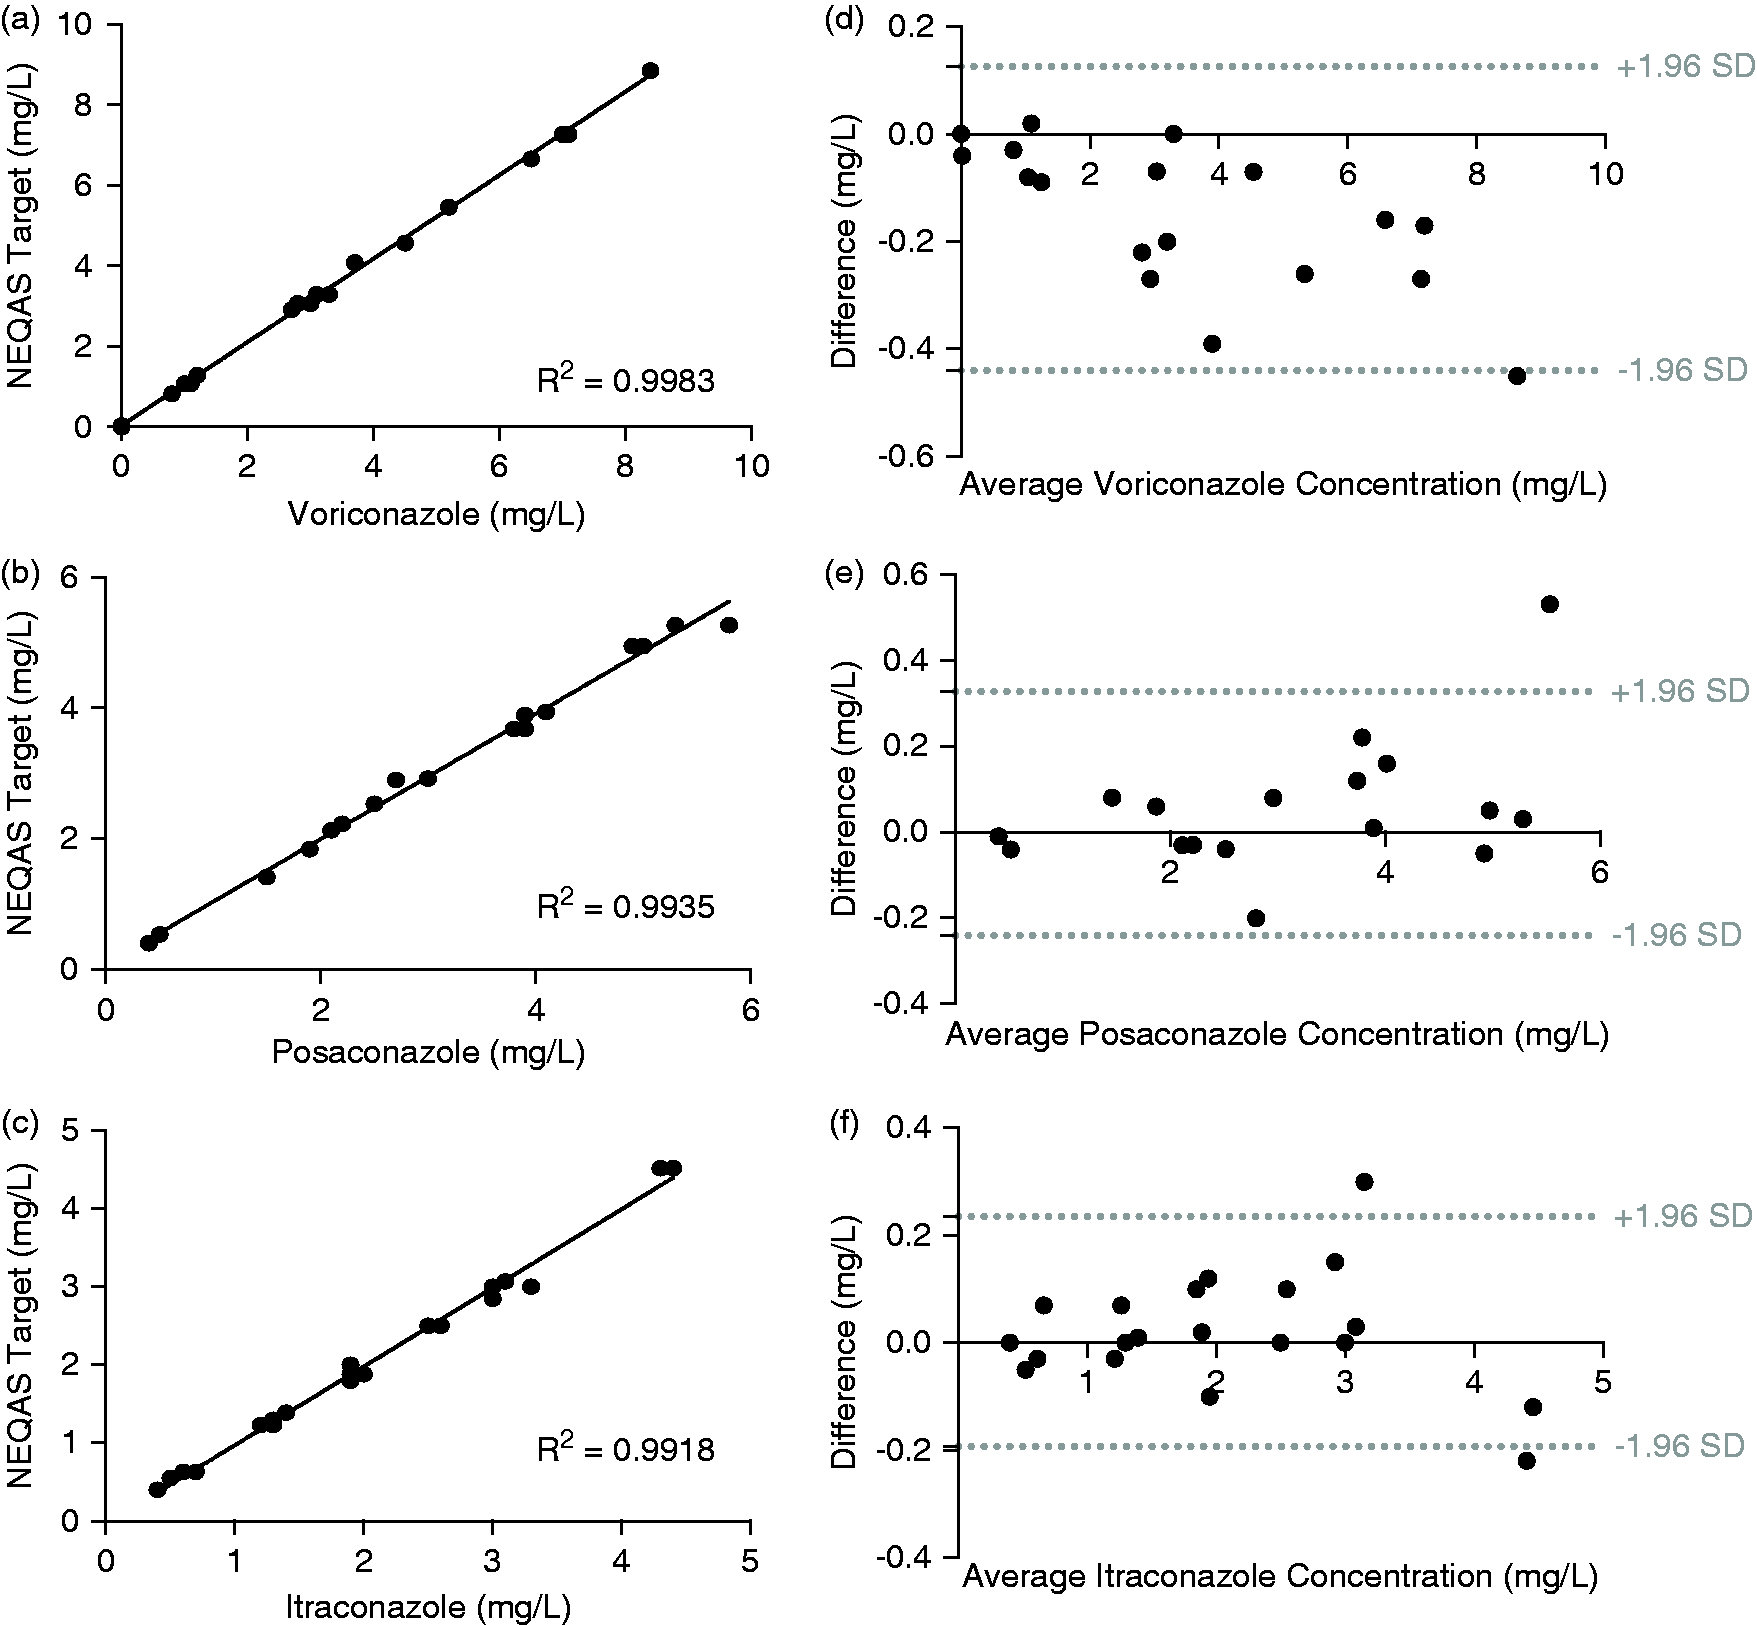
Discussion
This method was developed in response to clinical need and was therefore designed to have maximum clinical utility. From its inception, it was decided to develop a combined assay for voriconazole, posaconazole and itraconazole as these three drugs make-up the first-line treatments for the most common fungal infections. The inclusion of other azole-based drugs was considered, but many of those have been largely superseded by second-generation azole drugs such as voriconazole, posaconazole and itraconazole and therefore their use is in decline. Special consideration was given to the inclusion of fluconazole in this assay. However, due to its reduced potency in comparison to itraconazole and its efficacy being limited to yeasts, its popularity was deemed insufficient to warrant inclusion.
The sample preparation was deliberately kept as quick and simple as possible. The current relatively low, but increasing, numbers of azole TDM performed within the Trust necessitated that this new method would need to be quick, simple to perform and utilize only pre-existing equipment for this assay to become viable. Therefore, with these pre-requisites, zinc sulphate was initially trialled as the protein precipitating agent and was added to the patient samples in a 2:1 v/v. However, these early experiments showed zinc sulphate completely precipitated itraconazole and its internal standard from samples. The reason for this must derive from the chemical structure of itraconazole and its lipophilicity. The log P of itraconazole is higher than the other two compounds in this assay and even exceeds the suggested lipophilicity of drug molecules. Lipinski’s rule for predicting poor absorption and permeability suggest drugs should have a log P of <5. 15 As itraconazole is highly insoluble in water, the addition of an aqueous protein-precipitating agent needed to be avoided. In a deliberate attempt to avoid the additional steps generated by an extraction-based purification, protein precipitation with acetonitrile was attempted. Addition of two equivalents of acetonitrile proved very effective, producing a clear extract and allowed excellent chromatographic separation of all three analytes. The extraction efficiency was evaluated (data not shown) and shown to be 50, 80 and 90% for voriconazole, posaconazole and itraconazole, respectively. The variability of the extraction efficiencies, between analytes, must be attributed to differences in their hydrophobicities and is a consequence of designing combined methods for structurally very diverse drugs (Table 1). However, even the lowest extraction efficiency of 50% did not pose a problem due to the matched extraction efficiency of the internal standards and the high analyte concentrations (mg/L) being well within the sensitivity of the instrument. The utility of the internal standards and their ability to correct for extraction inefficiencies is exemplified in the recovery data. These experiments involved the spiking of samples pre-extraction and comparing the experimentally determined analyte concentration to the known concentration of the spike. As the experimental concentration is determined from the response, and is therefore normalized to the internal standard, any inefficiencies in the extraction process are accounted for. The percentage recoveries are excellent at 103, 95 and 103% for voriconazole, posaconazole and itraconazole, respectively.
The hydrophobic nature of itraconazole also caused problems during the development of the chromatography. Initially, itraconazole did not fully elute from the column and sample carryover was seen. The inclusion of the rather extensive 3.5 min, 98% mobile phase B wash was initially trialled to remove the residual itraconazole before the injection of the next sample. However, even with this wash step in place itraconazole, carryover was still seen and could not be eradicated by further elongation of this wash step. We therefore conclude there must be another source of the carryover. In the literature Wong et al. noted that the injector port required rinsing multiple times to help overcome itraconazole carryover. 16 In the light of this information, the strength of wash, which the auto-sampler used, was increased from 10% methanol to 100% methanol. The number of injector washes performed between samples was also increased from one to three. The combination of these changes eradicated any sample carryover as evidenced by the area of the blanks following injection of high concentrations of each analyte being <5% of the LLMI area. The literature also reports the formation of posaconazole glucuronides in vivo which do not possess the same antifungal efficacy but can lead to over-quantification in mass spectrometry based methods due to in-source fragmentation. 17 These metabolites can, however, be easily separated chromatographically, as is the case in this assay and is evidenced by the lack of a positive bias upon comparison to other methods.
The analytical range that should be covered for each analyte was first determined theoretically and then the analytical performance was evaluated to make sure the minimum performance criteria were met. Following a review of the therapeutic ranges used by the antimicrobial reference laboratory along with the guidelines for TDM of antifungal agents published by the British Society for Medical Mycology and other literature, the following analytical ranges were determined.12,18,19 Voriconazole 0.1–10 mg/L, posaconazole 0.1–5.0 mg/L and itraconazole 0.1–5.0 mg/L.
The minimum signal-to-noise ratio for any of the quantifier or qualifier ions at the LLMI of 0.1 mg/L was 14:1, well above the minimum cut-off of 5:1. The percentage variation at the LLMI was also well within the minimum 20% standard suggesting the LLMI could have been considerably lower than 0.1 mg/L. However, there is no clinical need to quantify concentrations <0.1 mg/L and therefore this was not attempted. Dilutions of certified reference material showed the assay is linear to at least 10 mg/L for voriconazole and 5 mg/L for both posaconazole and itraconazole. The correlation between the spiked concentration and the experimental concentration was excellent and showed no signs of plateauing at the higher end and therefore the analytical range could also have been higher. Again, clinically the decision was taken that concentrations higher than 10 mg/L and 5 mg/L could be reported as greater than or re-run on dilution and therefore there was no need to extend the linear range. Development work has shown that all three analytes dilute in the expected linear manner. Both Chromsystems and Recipe provide commercial calibrators and QCs for azole-based antifungals, but neither company covers as broad an analytical range as is shown here thus further highlighting the utility of this new assay.
The intra- and inter-assay precision results were both good and raised no concerns. The precision of this assay was attributed to a combination of the simple yet robust sample preparation procedure, the use of deuterated internal standards and the well-resolved chromatography. Both the direct correlation between the NEQAS targets/experimental values and the Bland–Altman plots highlights the accuracy of this method. The inter- and intra-assay precision and percentage bias also compare very favourably to other publish methods.20–22
In conclusion, this assay is a simple, robust and accurate way to quantify three commonly used antifungals in serum. The challenges that have arisen throughout the development of this assay have not pushed the frontiers of scientific practice but instead have centred around the struggle to harness simple chemistries and pre-existing infrastructure to develop a clinically necessary service. The relatively low, but increasing, demand for this assay necessitated the column and mobile phase to be the same as the pre-existing assays run on the same instrument therefore allowing this assay to be integrated within the current workload and repertoire. It is hoped that the ubiquitous choice of sample preparation method, column and mobile phases will also allow others clinical laboratories to add this assay to their testing repertoire and in doing so improve patient care nationally. Locally, the implementation of this method will decrease sample turnaround times and consequently give azole antifungal TDM much greater clinical utility and result in optimal, tailored dosing for patients.
Footnotes
Acknowledgements
The authors thank Dr Martin Wieczysty for drawing all the chemical structures contained in this work and Dr Andrew Lovering for kindly supplying the previous NEQAS EQA material used within this work.
Declaration of conflicting interests
The author(s) declared no potential conflicts of interest with respect to the research, authorship, and/or publication of this article.
Funding
The author(s) received no financial support for the research, authorship, and/or publication of this article.
Ethical approval
None applicable.
Guarantor
ASD.
Contributorship
JMW undertook all of the laboratory work and wrote the first draft of the manuscript. ASD and AMM supervised the laboratory work and reviewed the manuscript. JA gave advice on the clinical utility of azole antifungals.