
Abstract
Background
One of the kallikrein genes (KLK3) encodes prostate-specific antigen, a key biomarker for prostate cancer. A number of factors, both genetic and non-genetic, determine variation of serum prostate-specific antigen concentrations in the population. We have recently found three KLK3 deletions in individuals with very low prostate-specific antigen concentrations, suggesting a link between abnormally reduced KLK3 expression and deletions of KLK3. Here, we aim to determine the frequency of kallikrein gene 3 deletions in the general population.
Methods
The frequency of KLK3 deletions in the general population was estimated from the 1958 Birth Cohort sample (n = 3815) using amplification ratiometry control system. In silico analyses using PennCNV were carried out in the same cohort and in NBS-WTCCC2 in order to provide an independent estimation of the frequency of KLK3 deletions in the general population.
Results
Amplification ratiometry control system results from the 1958 cohort indicated a frequency of KLK3 deletions of 0.81% (3.98% following a less stringent calling criterion). From in silico analyses, we found that potential deletions harbouring the KLK3 gene occurred at rates of 2.13% (1958 Cohort, n = 2867) and 0.99% (NBS-WTCCC2, n = 2737), respectively. These results are in good agreement with our in vitro experiments. All deletions found were in heterozygosis.
Conclusions
We conclude that a number of individuals from the general population present KLK3 deletions in heterozygosis. Further studies are required in order to know if interpretation of low serum prostate-specific antigen concentrations in individuals with KLK3 deletions may offer false-negative assurances with consequences for prostate cancer screening, diagnosis and monitoring.
Introduction
Prostate-specific antigen (PSA) is a key biomarker for prostate cancer (PCa) diagnosis and monitoring and has been advocated for PCa screening. 1 PSA is encoded by KLK3, a kallikrein gene. 2 Several studies have associated serum PSA concentrations with KLK3 single nucleotide polymorphism (SNPs). 3 Most of the associations in the pre-Genome Wide Association Studies (GWAS) era were insufficiently replicated. However, recent GWAS4–6 with higher power has reinforced a number of previous associations, in addition to discovering new variants linked with circulating PSA.
We have previously analysed the presence of inactivating genetic variants in KLK3 that would be consistent with haploinsufficient concentrations of PSA. 7 A thorough analysis was done to investigate KLK3 variants at the DNA sequence and at the structural concentrations from the study of thirty individuals with the lowest PSA concentrations (≤0.1 ng/mL) and absence of PCa among 85,000 males from the ProtecT biorepository. 7 This report was the only study to date that detected the presence of hemizygous deletions in three individuals with very low concentrations of PSA, representing a likely link between KLK3 deletions and low PSA concentrations. 7 These individuals had no diagnosis of PCa. However, other (affected) individuals with these genetic rearrangements may be misidentified as PCa-free due to their impaired ability to express PSA.
Polymerase chain reaction (PCR)-based methods have prevailed as the tools of choice for the targeted screening of copy number variants (CNVs), due to their rapidity, simplicity and flexibility. Several techniques employ PCR in a multiplex manner, as a means to enhance gene dosage estimation by co-amplifying reference genes along with ones in test. Examples include multiplex PCR of short fluorescent fragments, 8 multiplex amplifiable probe hybridization, 9 multiplex ligation-dependent probe amplification, 10 the paralogue ratio test 11 and quantitative real time PCR (qPCR), in addition to the methodology used in this study: the amplification ratiometry control system (ARCS). 12 Apart from ARCS, all of these methods have been reviewed at length, 13 and a useful comparison of performance characteristics across these PCR-based tests for copy number is available. 12
Gross rearrangements can also be detected by in silico approaches. It is known that the agreement between both in silico and experimental approaches is important for CNV validation. 14
SNP arrays were originally designed to genotype SNPs for GWAS; however, they have been adapted for structural variant discovery from large data-sets. Several generations of dense SNP array platforms have been made available by leading companies in the industry (e.g. Illumina and Affymetrix), motivating the development of several algorithms (e.g. PennCNV) that normalize key metrics like signal probe intensities and minor allele frequencies from various forms of genetic data, to detect CNVs.
PennCNV employs hidden Markov models (HMMs) to infer the underlying states of copy number while interrogating multiple features, two of which are key in CNV detection. The B allele frequency (BAF) value is a measure of the allelic intensity (i.e. proportions of the B allele compared with the A allele), whereas Log R ratio (LRR) is an indicator of signal intensity. PennCNV has been previously used to detect CNVs in genomic regions.15,16
The characterization of the frequency of KLK3 deletions in the general population is relevant to the knowledge of their implications for the use of PSA as a biomarker for the detection of PCa, in addition to monitoring its progression, and guiding treatment. Our aim in this study was to estimate the frequency of KLK3 deletions in the general population from both in vitro and in silico data.
Materials and methods
WTCCC2 studies: The 1958BC and the NBS samples
The National Child Development Study, otherwise known as the 1958 British birth cohort (1958BC), started as a perinatal mortality and morbidity survey, looking at all births in England, Wales and Scotland in a single week in 1958. This included an original sample of 17,638 births (in addition to a further 920 immigrants born in the same reference week). Cohort members were further followed up by medical examinations (at 7, 11 and 16 years of age) and interviews (at ages 23, 33 and 42). The first biomedical assessment was conducted between September 2002 and March 2004 by trained nurses from the National Centre for Social Research, who visited the homes of cohort members at age 44–45 years.17,18
Consent was sought to collect blood samples for the extraction and storage of DNA and the creation of immortalized cell lines (via Epstein-Barr viral transformation of peripheral blood lymphocytes) for research purpose. A final set of 8018 EDTA blood samples, in addition to 7526 successfully transformed cell cultures were used to derive two DNA sample series of peripheral blood and cell line origin, respectively (http://www2.le.ac.uk/projects/birthcohort/1958bc/available-resources). These efforts led to the creation of a national research resource through funds from the Wellcome Trust and The Medical Research Council. 18
A subset of 3000 controls from the 1958BC, in addition to 3000 samples from the UK National Blood Service (NBS) were genotyped using cell line DNA by the WTCCC2 (Wellcome Trust Case Control Consortium, second round) in WTCCC2 project controls study (Study ID EGAS00000000028). The 6000 controls were genotyped on both the Illumina 1.2M and the Affymetrix v6.0 chips (http://www.wtccc.org.uk/ccc2/).
Ethical approval was obtained from the South East, UK, Multicentre Research Ethics Committee (reference 01/1/44).
ARCS assays to estimate the frequency of KLK3 deletions in the 1958 cohort
A high-throughput ratiometric method (ARCS) developed and validated in our laboratory 12 was used to identify KLK3 deletions. This approach has previously been used to detect KLK3 deletions in individuals with very low PSA concentrations. 7 In short, it is based on a PCR protocol which analyses the ratio of copy-number-variable target gene to diploid (2 n)-copy reference gene. The target and reference gene amplicons are designed to have melting temperatures separated by a few degrees to enable differentiation in a melt assay, and the ratio of target copy number to reference is derived from the change in fluorescence contributed by each as it undergoes melting.
Rodriguez et al., 7 showed that KLK3 exon 3 is a good indicator of KLK3 deletions, since it was deleted in all three individuals showing KLK3 deletions. Copy number status was surveyed for a total of 3815 cell line DNA samples from the 1958 cohort by ARCS at KLK3 exon 3. Beta globin (HBB), an established reference for ARCS assays in our lab, was used as the reference for diploid number. The assays were run in duplicates for each sample. ARCS primers and conditions were as previously described. 7
Statistical analysis of data from ARCS
An in-house Perl script written by Guthrie et al. 12 was used to calculate peak heights. This script analyses melt files (.mlt) from the LightTyper (Roche Diagnostics Corporation, Indianapolis, Indiana, USA), generating cluster plots to enable the visualization of potential copy number classes. Further output lists well position, left (L) peak height, right (R) peak height, (L/R) peak height ratio and fluorescence intensity per well in spreadsheet format. These were saved for further statistical analyses. Confidence intervals (95%) were calculated to assign copy number, as follows: In ARCS, target peak height/reference peak height ratios are calculated to infer copy number, after which the mean ARCS ratio (a plate-specific attribute) for all of the samples in a run is calculated.
In the original implementation of ARCS, the left peak was for a target gene (HP), while the right peak was for a reference amplicon (TP53). Deletions or duplications will have ratios lower or higher than 1.96SDs from the mean ratio, respectively; however, in the KLK3 assays described above, this order was flipped, assigning the left peak for the AT-rich reference amplicons HBB, whereas the right peak represents the target (KLK3 exon 3) (higher in GC content). This would make the height of the target peak the denominator in calculated ratios, and thus renders it inversely proportional to the ARCS ratios (i.e. deletions will have higher ratios than duplications).
Samples with values that lie outside the ± 1.96SDs of the mean target peak height/reference peak height are flagged as potential CNVs. ARCS assays were designed to test KLK3 exons 3 (conditions in supplementary file).
PennCNV software to estimate the frequency of KLK3 deletions in the 1958 and NBS cohorts
We used the Illumina data-set (ega Dataset ID EGAD00000000022). All of the data from iDAT files corresponding to ≈3000 samples from each cohort were compacted into 13 final reports per data-set. These reports contained all of the essential probe intensity data needed by PennCNV. 19 PennCNV initially built to analyse Illumina genotyping data is capable of handling Affymetrix data through its alternative version PennCNV-Affy. In general, for an algorithm developed to analyse data from a specific platform, its performance is more powerful when applied to data from the same format and shows some weakness when applied to another platform. 14 In addition, algorithm-specific platforms are more specific than platform-independent software. 20
Individual exclusions criteria
A comprehensive set of genotypes, intensities and signal data were provided for the 1958BC and the NBS controls data-sets. Individual exclusions from the initial 3000 samples in each set were based on some of the following considerations: (i) based on a principal component analysis of HapMap individuals, samples that differed from the majority of the collection in terms of ancestry were excluded. The final data-sets within the WTCCC2 project controls study included genotypes from the 1958BC (n = 2867) and NBS (n = 2737) after initially drawing 3000 DNA samples in each of the two cohorts. (ii) Gender discrepancies between sex reported by suppliers and sex estimated from normalizing A-allele probes on the X chromosome to autosomal intensities. (iii) Disproportionate missingness or heterozygosity compared with the cohort-wide fraction of called SNPs that were missing or heterozygous. (iv) Identity by descent (IBD) at 5% or higher, identified by an HMM. (v) Identity checks. Prior to full genotyping, individuals were genotyped by Sequenom at a reference panel of 30 SNPs via the Wellcome Trust Sanger Institute. Samples with concordance of less than 90% between Sequenom and full genotypes were deemed unknown and thus excluded. (vi) Batch effects. The cohort-wide mean of the A and B allele intensities from 10,000 SNPs on chromosome 22 was computed, and outliers were excluded.
In addition, exclusions regarding SNPs included minor allele frequency less than 0.01, violation of Hardy-Weinberg equilibrium at < 1e-20 and genotyping missingness of 2% or more at the SNPs that reach the maximum call probability threshold.
Statistical analysis of data from PennCNV
The combination of LRR and BAF values was used to estimate KLK3 deletion frequencies in two large samples by PennCNV.
The two essential metrics to infer copy number states are the LRR (standardized to have a mean = 0) and the BAF (ranges from 0 to 1). 21 In an Illumina data analysis framework, X and Y values are derived for each marker from raw data in a five-step normalization procedure implemented in Illumina’s software BeadStudio. Normalization includes, among other steps, removing outliers, background estimation and scale appropriation. 22 R and theta (θ) values represent polar transformations of the intensities, and from this (and reference cluster locations), the LRR and BAF metrics are calculated.
The R ratio obtained by PennCNV normalizes the signal intensity from an individual to that of a reference sample population for each marker in the data-set. The R or total signal intensity of both alleles at an SNP (R = X+Y) is calculated, after which LRR (log2 [Rsubject/Rexpected]) can then be computed. 22 The Rexpected is computed from ‘canonical genotype clusters’ detailed in Peiffer et al. 21 The theta value is calculated as θ = arctan (Y/X)/(π/2), and is meant to measure the relative allelic intensity ratio of alleles A and B.
The transformation of R and θ into LRR and BAF aims to standardize signal level data across SNPs in order to allow ready comparisons, while remaining sufficiently close to the raw data to carry relevant information for copy number quantification. 23
Results
ARCS assays at KLK3 exon 3
A list of samples where KLK3 exon 3 was found deleted by ARCS.

Note: A total of 152 samples have shown evidence for a deletion in KLK3 exon 3 by at least one replicate in ARCS, including 31 samples where both replicates indicated a deletion, and 18 samples were PCR failures.
SNP array data (including BAF and LRR): WTCCC data-sets. PennCNV
CNV data from the analysis of the 1958BC data on PennCNV indicate the presence of 61 heterozygous deletions encompassing KLK3 (freq = 2.13%) (Figure 1).
KLK3 heterozygous deletions in the 1958BC data-set. A snapshot of custom tracks generated by the UCSC genome browser. Sixty-one single copy deletions were found in the 1958BC. Each deletion is represented by a track – in black. (KLK3 is highlighted by the red box in the bottom panel. The scale bar at the top of the panel represents 100 kb.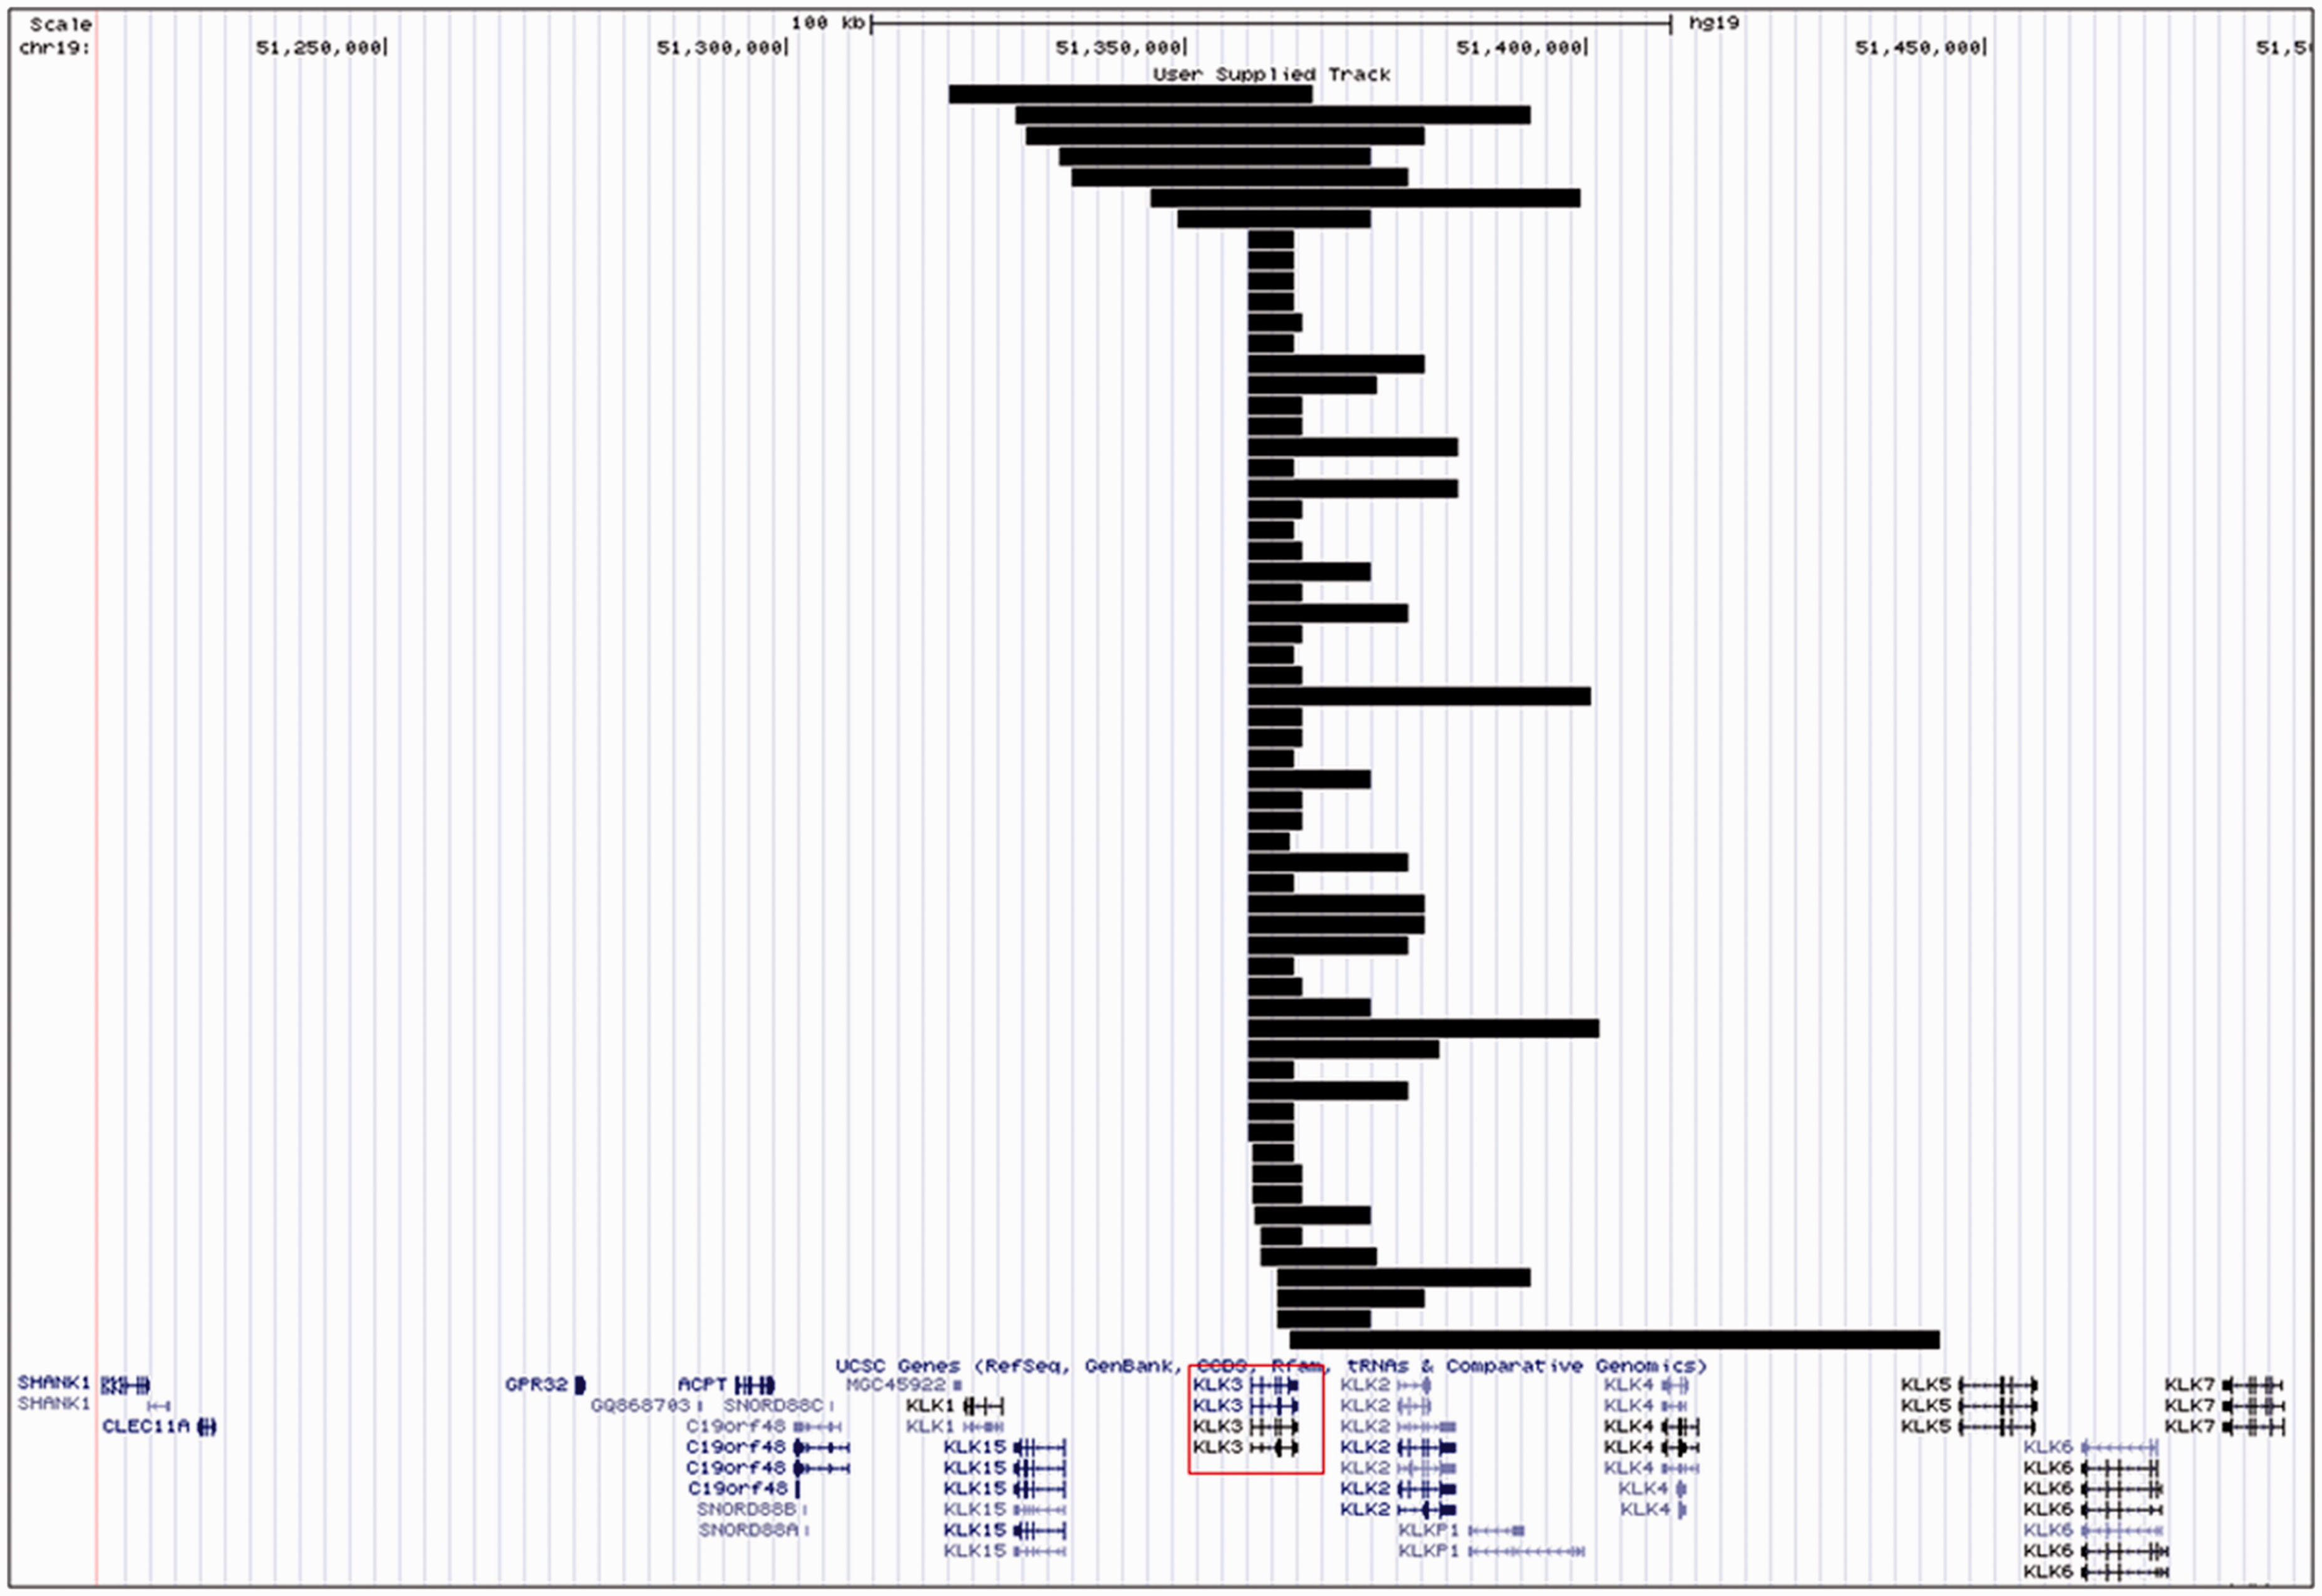
The majority of KLK3 deletions in this cohort (86.5%) were less than 50 kb in length (median CNV length = 15.5 kb). LRR and BAF plots for one deletion detected by PennCNV are shown (Supplementary Figure 2). A full list of deletions called in this cohort is provided (online Appendix 1).
PennCNV identified three putative homozygous deletions (copy number = 0). Detailed manual inspection of LRRs and BAF values were inconsistent with the occurrence of homozygous deletions.
A subset of 44 deletions in KLK3 from the 1958BC data (≈61%) start at the SNP rs3760722 in the promoter of the gene (Figure 2).
KLK3 deletions with a common start breakpoint in 1958BC. A total of 44 deletions were found to start at the SNP rs3760722 in the 1958BC data-set. Common endpoints are found at six different SNPs (annotated in red beside each group of tracks that share the same end). KLK3 is highlighted by the red box in the bottom panel. The scale bar at the top of the panel represents 20 kb.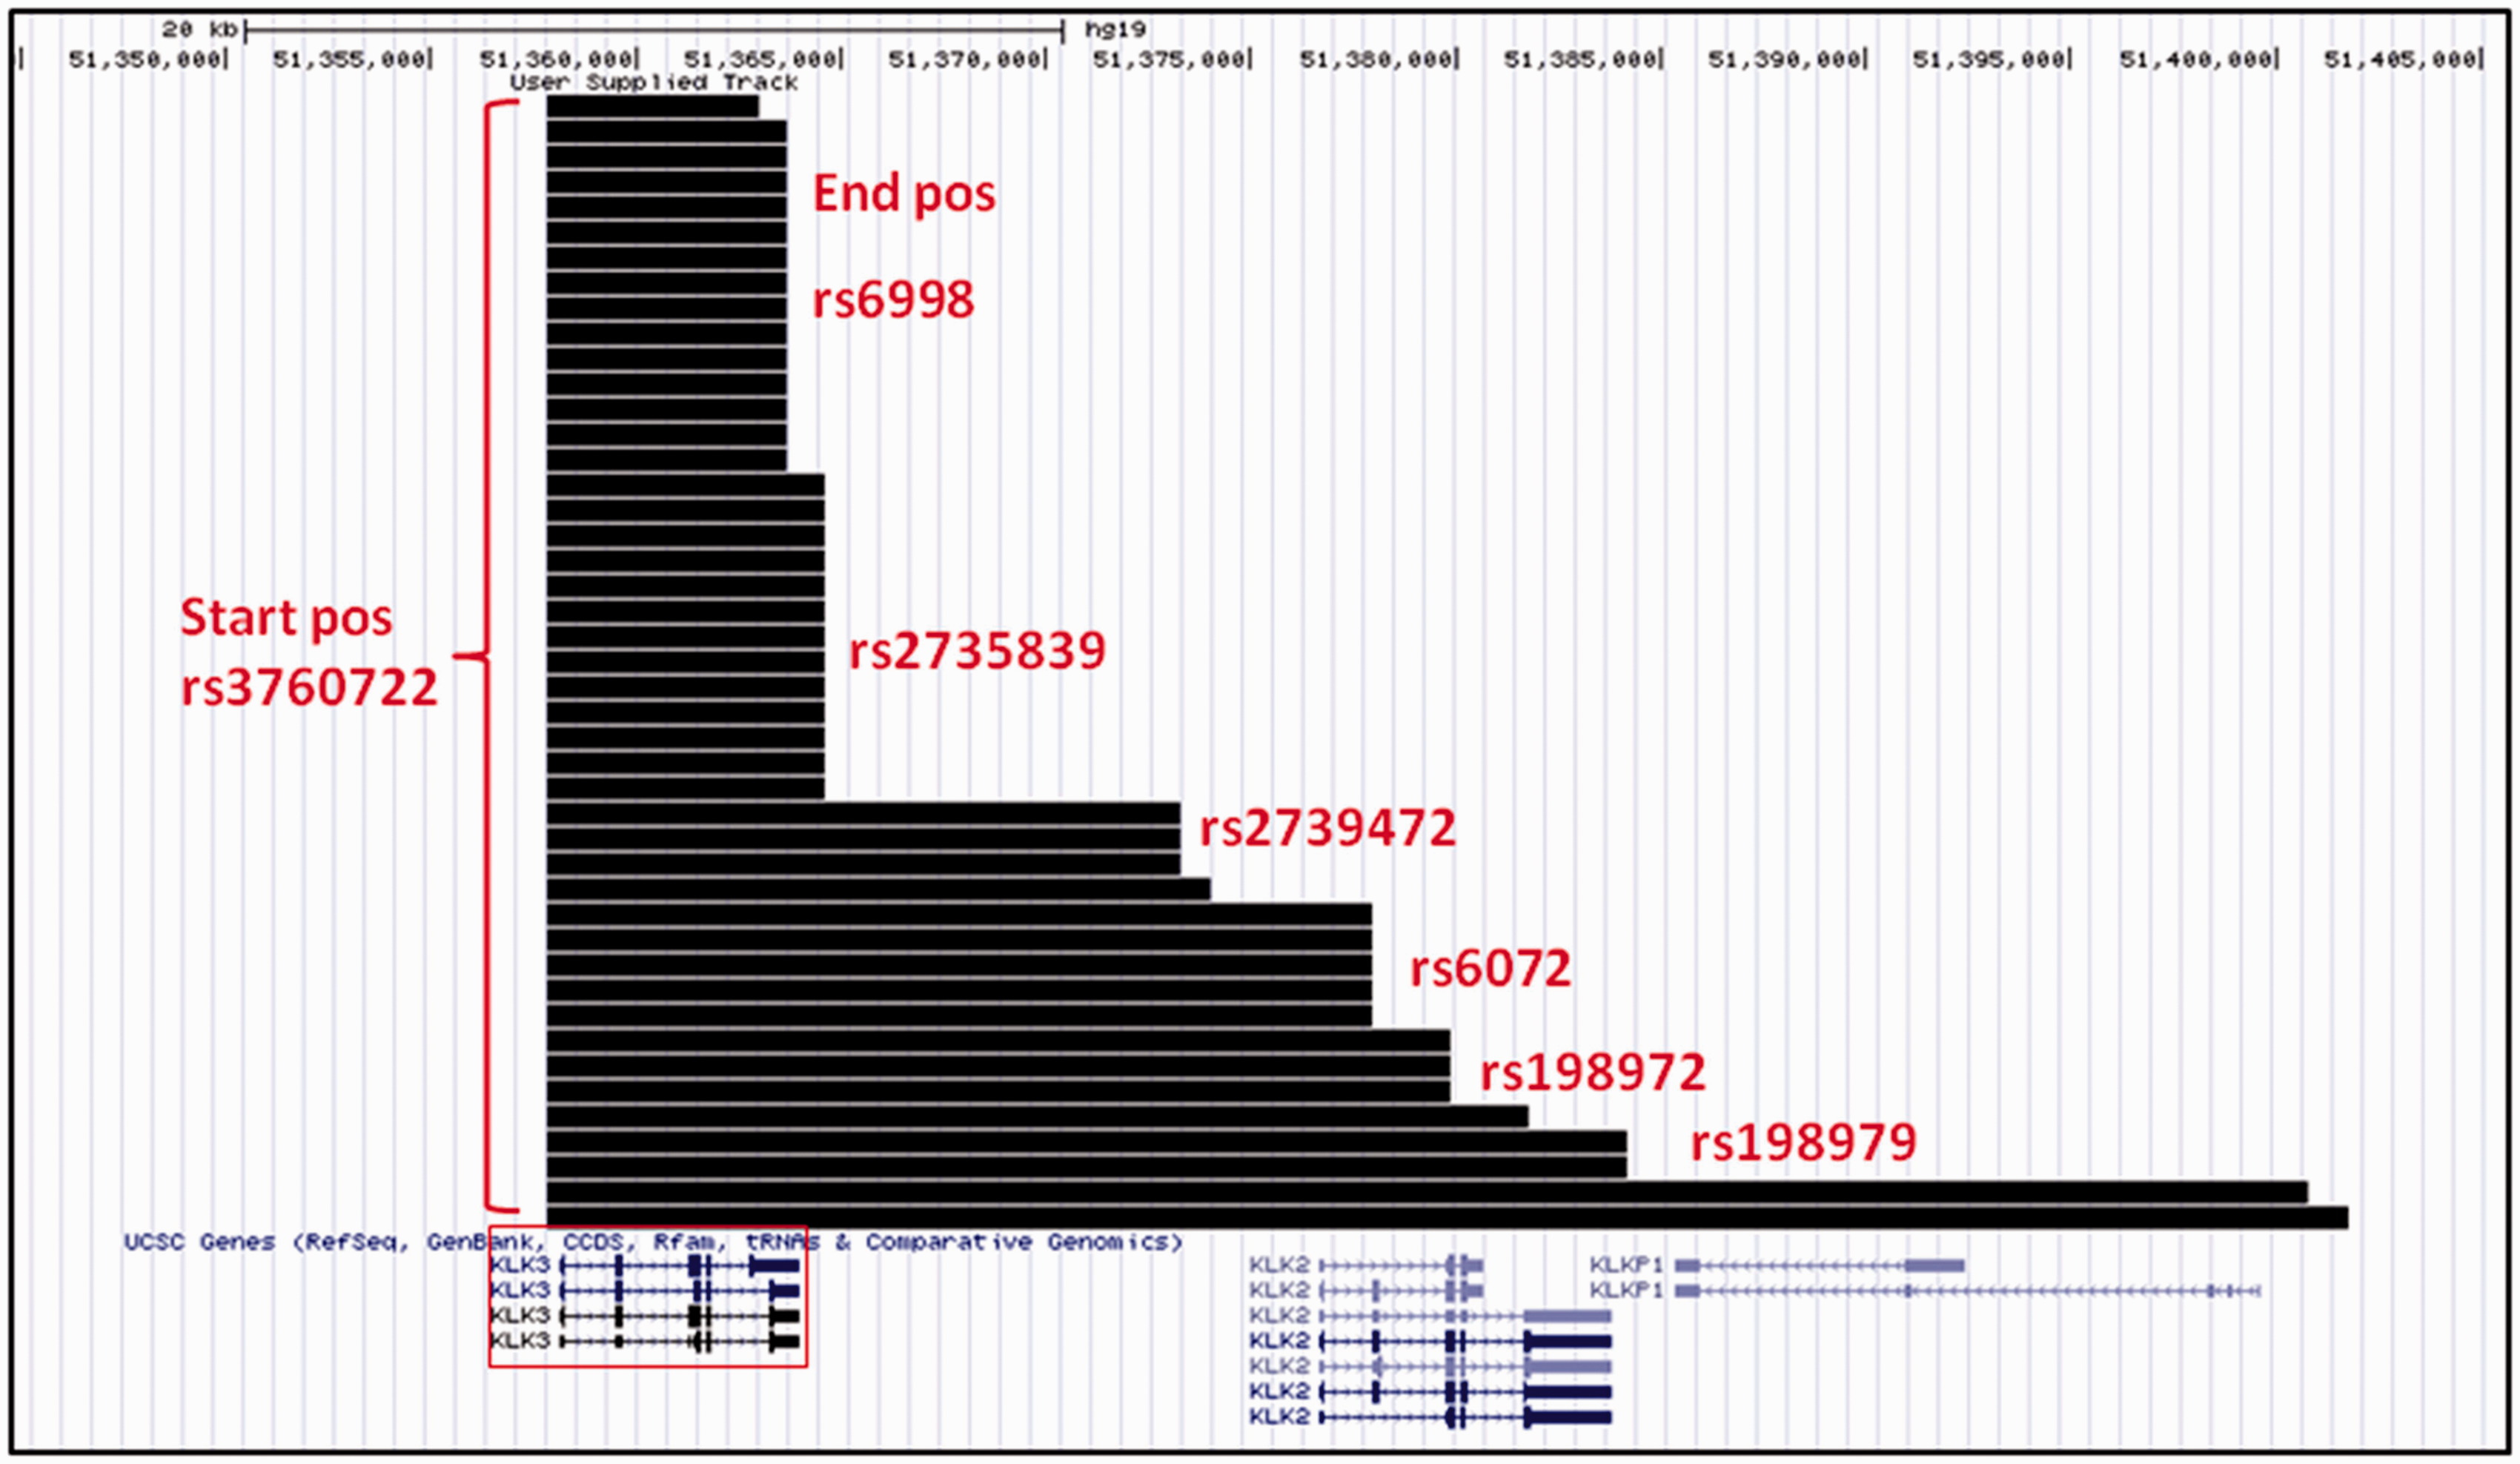
These deletions range in length between 5.2 and 44 kb (mean = 12.6 kb; median = 6.8 kb; median no. of SNPs = 18). Common endpoints were observed for these deletions, at rs6998 (14 deletions), rs2735839 (13 deletions), rs6072 (4 deletions), rs2739472 and rs198972 (3 deletions each) and rs198979 (2 deletions). Other common start points for deletions within this set include the SNPs rs2003783 (3 deletions), rs266881 (3 deletions) and rs2271095 (2 deletions). Common start points, end points and deletions are listed in online Appendix 1.
PennCNV analysis of the NBS cohort revealed a lower number of deletions compared with the 1958 cohort (27 deletions, freq = 0.99%) as shown (Figure 3).
KLK3 deletions in NBS (a) length and (b) Common start breakpoints.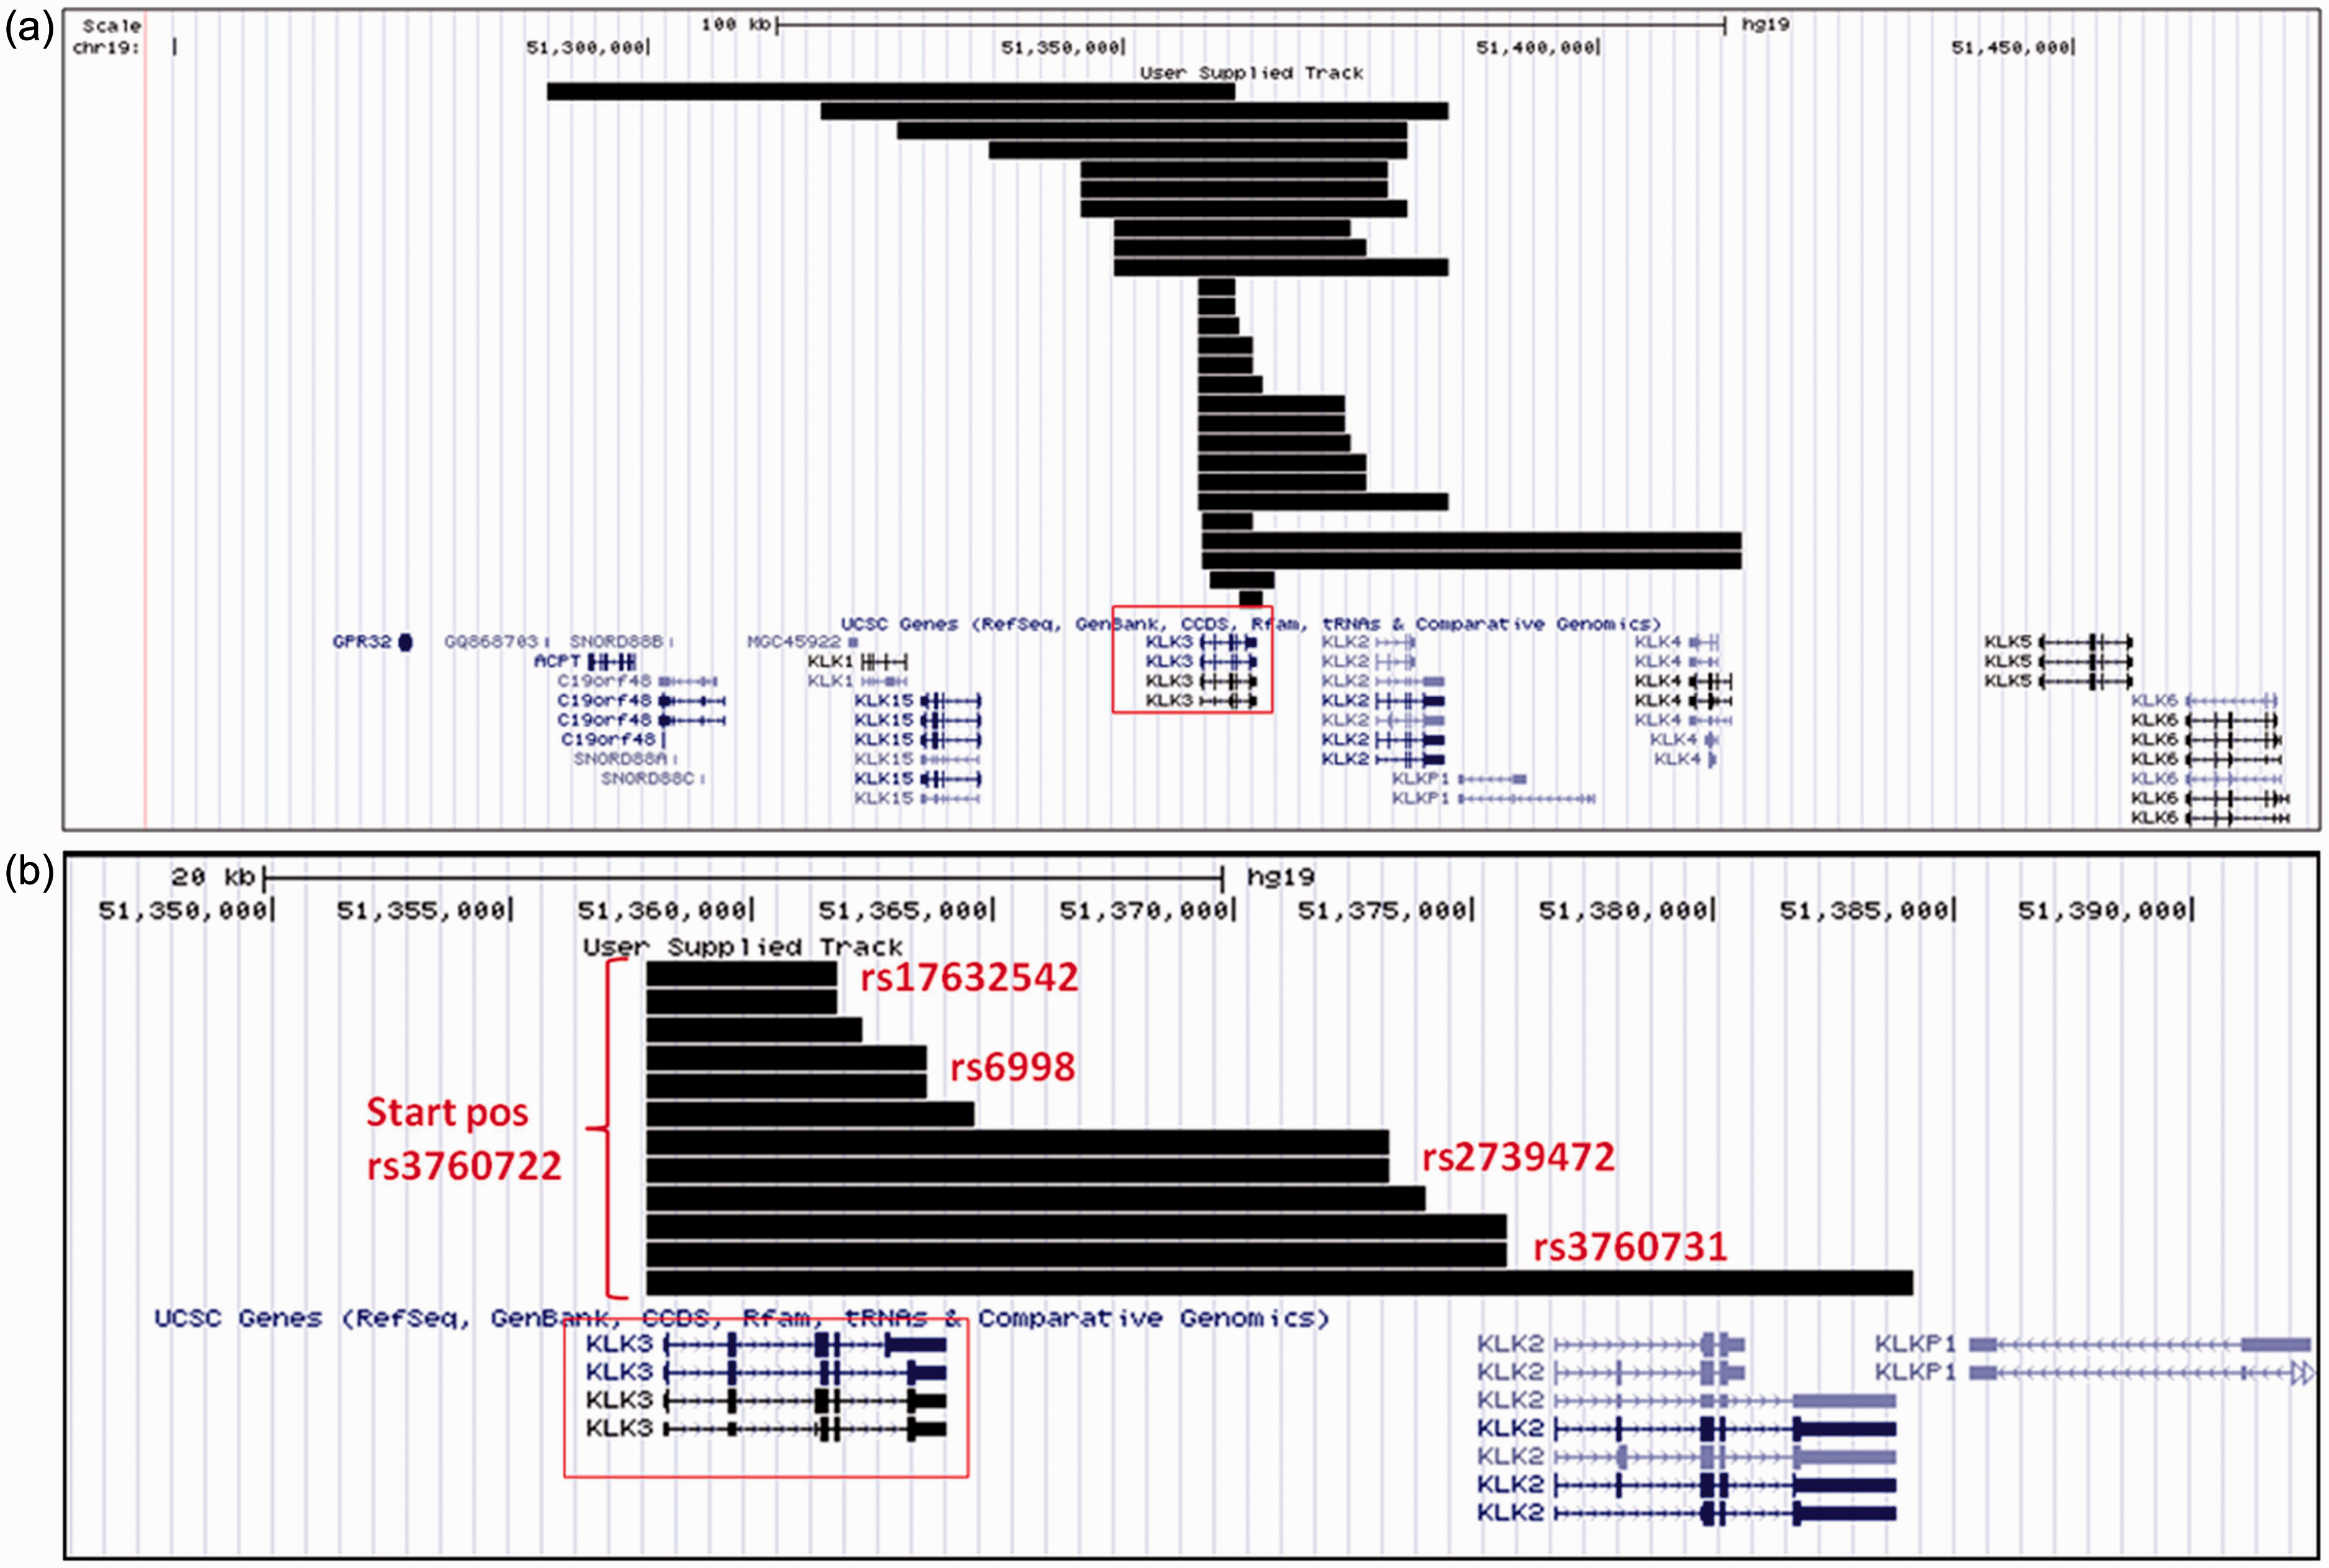
Results from the 1958BC and NBS data-sets – PennCNV.
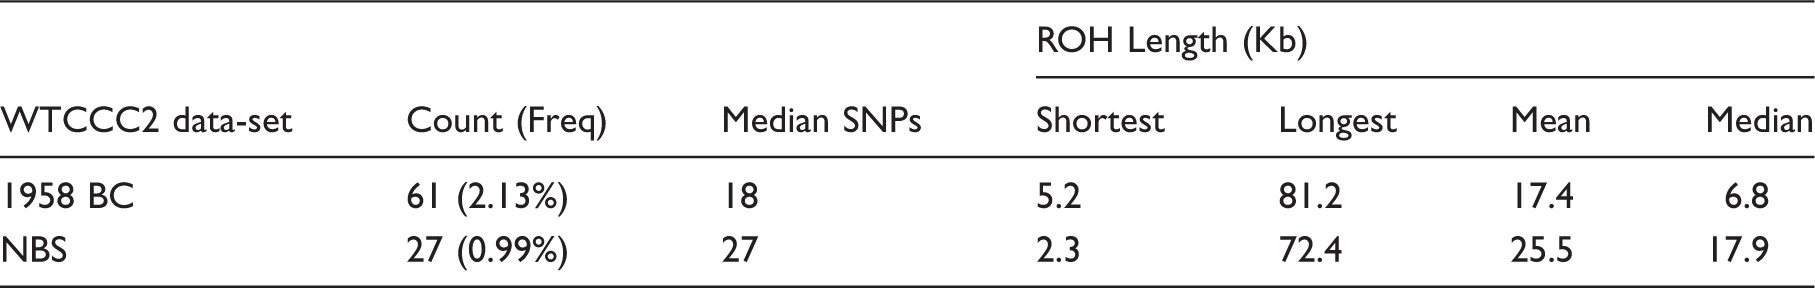
All of the deletions detected were hemizygous (online Appendix 1). As in the 1958BC data-set, 12 deletions identified from the NBS cohort (44.8%) start at rs3760722; whereas 3 deletions start at each one of the SNPs rs2659051, rs266849 and rs266881 (Figure 3). Common start points, end points and deletions are listed in online Appendix 2.
The two-fold difference (2.12% vs. 0.99%) observed in the two samples tested is significant (P < 0.05).
Discussion
To our knowledge, this study is the first report of the frequency of KLK3 deletions in the general population. We also found a number of KLK3 deletions with the same breakpoints, and others displaying one common breakpoint. Data from PennCNV estimate the frequency of KLK3 deletions within the 1958BC at 0.0213, and in the NBS cohort at 0.0099. These differences are significant, suggesting the existence of interpopulation variability in the frequency of KLK3 deletions. An alternative explanation suggesting sample error could be argued from the fact that both estimates are in general agreement with our in vitro experiments for KLK3 deletions, estimated to occur at frequencies between 0.0081 and 0.0398. This frequency is considerably higher than that of rare genetic variants and invites questions about the implications that KLK3 deletions could have on PCa diagnosis, monitoring and screening based on PSA. Assuming that the frequency of deletions observed in our population samples apply to other populations, one could predict the existence of 1–2% of individuals that could potentially have a mistakenly low serum PSA concentration as a consequence of the deletions identified. All analysed samples are of Caucasian ethnicity, which minimizes the occurrence of population stratification.
CNV calling from ARCS data for samples from the 1958 cohort was based on a stringent measure: ARCS ratio values outside the confines of ±1.96SDs from the mean ratio of all samples per plate (a plate-specific attribute). One could envisage that the ARCS assays used in this study were adequately robust to capture CNV events in cluster analysis. ARCS is an accurate method – especially at low copy numbers – that avoids assumptions drawn from standard curve estimations, and offers a high-throughput, generic framework applicable to any CNV assay. 12
In silico analyses presented in this work are informative for the detection of KLK3 deletions. With more than 1.2 million probes, the Illumina 1.2 -M Duo used in genotyping the WTCCC2 control sets is the most useful array for this purpose, as it offers the highest genomic resolution available to determine boundaries of deletions.
All deletions were found in heterozygosis. However, in three instances, PennCNV assigned a zero copy number to three samples pointing to apparent homozygous deletions in KLK3. Careful inspection of LRR/BAF profiles of these samples did not confirm the occurrence of these apparent homozygous deletions in our population samples.
Under the terms of data and material access agreements, it was not possible to link in vitro and in silico findings from this study. It has been suggested that biological confirmation is a necessary condition for validation of copy number events. 14 Our in vitro and in silico estimates represent considerable agreement and independent biological confirmation of the frequency of KLK3 deletions in the UK population. Future studies are required to estimate the frequency of KLK3 deletions in other populations.
Our study also enabled us to stratify KLK3 deletions by type and size. This approach identified a number of deletions that shared the same SNPs at the putative starting and ending points identified by PennCNV. Although it could be argued that the overall frequency of KLK3 deletions is relatively large, we have observed that the commonest single deletion observed in several individuals was present in a frequency of 0.005. This frequency is lower than the threshold (0.01) previously suggested 24 to define common CNVs. The occurrence of what could possibly be the same deletion in several individuals from our UK sample suggests the possibility of IBD and hence of transmission through the generations. However, it is also possible that they represent mutation hotspots, i.e. for recurrent similar deletions (e.g. similar hemoglobin A, HBA, deletions). 25 Neutral or deleterious effects of the deletions found in our study will need to be determined in future studies.
As arrays tend to underestimate the size of CNVs, CNV breakpoints are better characterized by sequencing data. Arrays are limited in terms of resolution by the number and the genomic distribution of SNPs on the genotyping chip. The first and the last markers showing evidence of copy number in an array may still be within a deletion rather than representing its boundaries. Differences between sequence-detected and array-detected breakpoints can be used to evaluate the resolution and the reproducibility of array data. 20
The promoter SNP rs3760722 emerges as a plausible putative breakpoint at the start of KLK3 deletions, as shown by the majority of deletions detected by PennCNV. The 3′UTR SNPs rs6998 and rs2735839 were found to represent the endpoint of numerous deletions as well. Interestingly, the latter SNPs were associated with serum PSA concentrations in several studies. Free serum PSA concentrations were associated with rs6998, 26 and rs2735839 was also associated with PCa risk 4 and serum PSA27–29 with studies suggesting that the association signal from this SNP is implied within a stronger signal from a coding SNP in exon 4 of the KLK3 gene, rs17632542.5,28 The characterization of well-defined CNVs in KLK3 would allow for testing associations between KLK3 deletions and serum PSA concentrations, and the recognition of putative breakpoints from SNP array data could prove a useful guide for KLK3 resequencing studies.
No data on serum PSA concentrations or PCa status are available from the 1958BC and NBS. Future studies are required in order to derive direct conclusions about the impact of KLK3 deletions on the correlation between gene dose effect and serum PSA and PCa status. This will inform about the suitability of the PSA test in individuals carrying KLK3 deletions.
Footnotes
Acknowledgements
This work was supported by an overseas PhD studentship from King Saud University (Riyadh, Saudi Arabia) to Osama Al-Ghamdi. This study makes use of data generated by the Wellcome Trust Case-Control Consortium. A full list of the investigators who contributed to the generation of the data is available from ![]() .
.
Declaration of conflicting interests
The author(s) declared no potential conflicts of interest with respect to the research, authorship, and/or publication of this article.
Funding
This work was supported by an overseas PhD studentship from King Saud University (Riyadh, Saudi Arabia) to Osama Al-Ghamdi. Funding for the project was provided by the Wellcome Trust under award 076113 and 085475. The Integrative Epidemiology Unit is supported by the MRC and the University of Bristol (MC_UU_12013/1-9).
Ethical approval
Ethical approval was obtained from the South East, UK, Multicentre Research Ethics Committee (reference 01/1/44).
Guarantor
SR.
Contributorship
SR and INMD were involved in conception and design, acquisition of data, and analysis and interpretation of data, drafting the article and revising it critically for important intellectual content. OAG and PAIG were involved in analysis and interpretation of data, drafting the article, revising it critically for important intellectual content. HA.S, WM, TG and K.K.A were involved in analysis and interpretation of data, revising the article critically for important intellectual content, final approval of the version to be published and agreement to be accountable for all aspects of the work.