
Abstract
Background
Phlebotomy for the purpose of blood analysis is often performed at remote locations, and samples are usually temporarily stored before transport to a central laboratory for analysis. The circumstances during storage and shipment may not meet the necessary requirements. If analysed anyway, false results may be generated. We therefore examined the influence of precentrifugation time and temperature of the most frequently requested tests in whole blood.
Methods
Healthy volunteers donated blood in which 48 analytes were tested. Routine chemistry was performed in lithium heparin tubes, haematology in ethylenediaminetetraacetic acid tubes, coagulation in citrate tubes and glucose in sodium fluoride tubes. One tube was measured directly. The others were kept at different temperatures (4, 8, 20 or 30℃) and stored for 4, 6, 8 or 24 h before analysis. Additionally, some analytes were examined at 12, 16, 24 and 28℃. The mean percentage deviation was compared with different decision levels, including the total allowable error.
Results
When using the total allowable error as an acceptable limit, most of the investigated analytes remained stable. However, bicarbonate is unstable at almost all tested time-points and temperatures. Calcium, lactate dehydrogenase, potassium and sodium are particularly affected at low temperatures, while phosphate is mainly affected at and above room temperature after 8 h.
Conclusion
We established the influence of time and temperature on a broad range of analytes, which may be applied to set the limits in transportation and storage of whole blood samples.
Introduction
As part of the ISO15189 accreditation, every laboratory needs to achieve and document certain quality goals. These quality goals involve the preanalytical phase, the analytical phase and the postanalytical phase.
The preanalysis includes the transport of blood, which must happen under predefined circumstances to preserve the integrity of the blood samples. The best circumstances to transport blood have not yet been completely elucidated, but it is known that the integrity of blood samples is influenced by precentrifugation time and storage temperature.
The influence of prolonged precentrifugation time and temperature on the stability of numerous analytes has been described, but many studies have only tested short precentrifugation times up to 2 h1–8 and often did not cover all the generally requested tests and measured only a limited range of temperatures and times.9–14
The aim of this study was to determine the influence of temperature and time in whole blood on the stability of commonly requested analytes.
In order to interpret the results of this study, the limit of rejection of an analyte must be determined. These limits of rejection are debatable. Some authors choose to work with t-tests to determine main effect differences, but this statistical approach is too strict in clinical practice. 12 Others use stability criteria based on the coefficient of biological variation (CVb) and/or the coefficient of analytical variation (CVa) in different formulas.5,7,11–14 Examples of formulas are the critical change value (CCV), the maximum permissible instability (MPI) and the total allowable error (TEa).
The CCV is generally used to compare sequential results from one individual. Since this method deals with within-subject variation and not with between-subject variation, it was considered less suitable to use in the current study.
The MPI was introduced by the German working group of extra-analytical quality assurance of the German United Society for Clinical Chemistry and Laboratory Medicine. 13 With this method, the permissible deviation should be smaller than half of the total error derived from the sum of biological and analytical variability. The decision limits are narrow. Besides, the working group warns that the stability of constituents in the sample can be considerably reduced under pathological conditions. These small ranges are unworkable in daily practice of most clinical laboratories.
The TEa is widely accepted for internal and external quality control procedures, but the theoretical basis is doubted by some, because bias and imprecision are combined into a single parameter.15,16 Nevertheless, this method provides standardization between laboratories, but still allows for adjustments. The six sigma concept for quality control proposes minimal, desirable and optimal specifications for the TEa. 15 We used the desirable concentration for all analytes, which is most widely used. Each laboratory can anticipate on the percentage of TEa that is acceptable for preanalytical variation in its setting.
In this study, we show the influence of a wide range of times and temperatures during transport of blood tubes on key analytes using all three criteria.
Materials and methods
Subjects
Fifty healthy volunteers donated 17 tubes of blood each (circa 68 mL) after giving written informed consent in the Jeroen Bosch Hospital. The study was performed under the tenets of the Helsinki declaration, local laws and regulations and was monitored by the scientific committee of the Jeroen Bosch Hospital. The Dutch Medical Research involving Human Subjects Act (WMO) did not apply to this study, because the aim of this study was not to answer a question about health and disease. Therefore, this study is not categorized as medical scientific research.
Sample collection and analytes
The following vacutainer blood collection tubes were used: lithium heparin tubes (LH PST™ II; REF 367374), sodium fluoride tubes (NaF 6.0 mg Na2EDTA 12.0 mg; REF 368521), ethylenediaminetetraacetic acid tubes (K2E (EDTA) 7.2 mg; REF 368861) and citrate tubes (9NC 0.109 M Buff. Na3 citrate, REF 363048), all from Becton Dickinson, New Jersey, USA.
In LH plasma, we measured alanine aminotransferase (ALT), albumin (Alb), alkaline phosphatase (AP), amylase (Amy), aspartate aminotransferase (AST), bicarbonate (Bic), bilirubin direct (Bild), bilirubin total (Bilt), calcium (Ca), chloride (Cl), cholesterol (Chol), creatinine (Cre), C-reactive Protein (CRP), ferritin (Fer), folic acid (Fol), free thyroxin 4 (FT4), gamma-glutamyl transferase (GGT), glucose (Gluc), lactate dehydrogenase (LD), magnesium (Mg), phosphate (P), potassium (K), sodium (Na), triglycerides (Trig), troponin I (TropI), thyroid-stimulating hormone (TSH), urea nitrogen (Urea), uric acid (UA) and vitamin B12 (VitB12). In NaF, we measured Gluc. In EDTA plasma, we measured haemoglobin (Hb), haematocrit (Ht), erythrocytes (Ery), mean corpuscular volume (MCV), mean cell haemoglobin (MCH), platelets (Plt), reticulocytes (Reti), leukocytes (Leuko), neutrophils (Neutro), lymphocytes (Lympho), monocytes (Mono), eosinophils (Eos) and basophiles (Baso). In citrate plasma, we measured activated partial thromboplastin time (APTT), prothrombin time (PT), international normalized ratio (INR), D-dimer, fibrinogen and antithrombin III activity (ATIII).
Distribution, incubation and processing
One sample was directly measured (t0) and the other tubes were distributed into different storage circumstances at 4, 8, 20 or 30 ± 2℃ for either 4, 6, 8 or 24 ± 0.5 h after blood sample collection. Ca, LD, K and Na were additionally tested at 12, 16, 24 and 28 ± 2℃ at the same incubation times to delineate the exact temperature intervals at which these analytes are stable.
After the incubation period was expired, all the tubes were centrifuged, except EDTA tubes, using a swinging bucket rotor (Hettich Rotixa 50 RS, Tuttlingen, Germany, settings: 3000 g, 10 min, 22℃, brake 50%) and then analysis was performed.
All incubations were performed in temperature controlled water baths. Supplemental Figure 1 shows an overview of the study design.
Biochemistry parameters were measured with Dimension VISTA 2500 (Siemens, Munich, Germany). Haematology parameters were tested with Advia 2120a (Siemens, Munich, Germany), and coagulation was measured with the STA-R (Stago, New Jersey, USA).
Statistics
For each analyte and each storage condition, the mean of the results obtained from 10 samples (10 donors) was calculated (tx). Subsequently, for each condition (time and temperature), the mean percentage deviation was calculated related to the measurement directly after blood collection (Mean percentage deviation = [(tx − t0)/t0] × 100%). Mean percentage deviations were given with a 95% confidence interval (CI) and were reflected to the total allowable error
Stability of biochemical analytes in whole blood (4, 8, 20 and 30℃).

Note: Mean % deviations in relation to T = 0; Bold cells exceed total error allowable (analysis was performed in plasma).
LH: lithium heparin; ALT: alanine aminotransferase ; Alb: albumin; AP: alkaline phosphatase; Amy: amylase; AST: aspartate transaminase; Bic: bicarbonate. Bild: bilrubin direct; Bilt: bilirubin total; Ca: calcium; Cl: chloride; Chol: cholesterol; Cre: creatinine; CRP: C-reactive protein; Fer: ferritin; Fol: folic acid; FT4: free thyroxin 4; GGT: gamma-glutamyl transferase; Gluc: glucose; LD: lactate dehydrogenase; Mg: magnesium; P: phosphate; K: potassium; Na: sodium; Trig: triglycerides; TropI: troponin I; TSH: thyroid-stimulating hormone; Urea: urea nitrogen; UA: uric acid; VitB12: vitamin B12.
Results
Stability of glucose in whole blood (4, 8, 20 and 30℃).
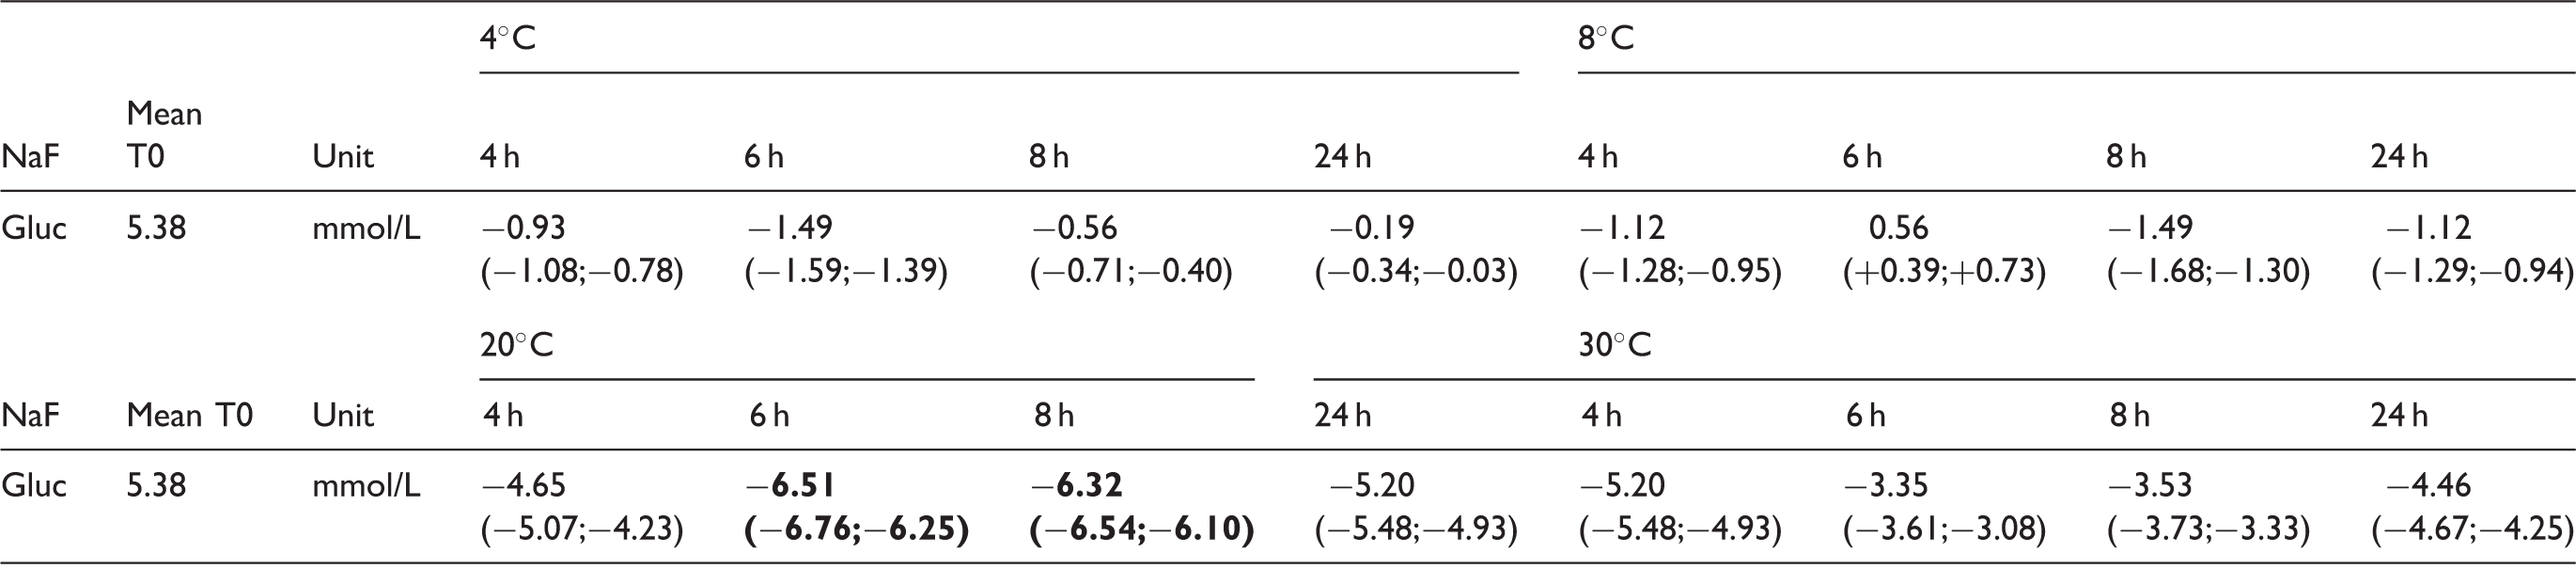
Note: Mean% deviations in relation to T = 0; Bold cells exceed total error allowable.
NaF: sodium fluoride; Gluc: glucose.
Stability of haematology analytes in whole blood (4, 8, 20 and 30℃).

Note: Mean% deviations in relation to T = 0; Bold cells exceed total error allowable.
Hb: haemoglobin; Ht: haematocrit; Ery: erythrocytes; MCV: mean corpuscular volume; MCH: mean cell haemoglobin; Plt: platelets; Reti: reticulocytes; Leuko: leukocytes; Neutro: neutrophiles; Lympho: lymphocytes; Mono: monocytes; Eos: eosinophiles; Baso: basophiles.
Absolute count.
Stability of coagulation analytes in whole blood (4, 8, 20 and 30℃).
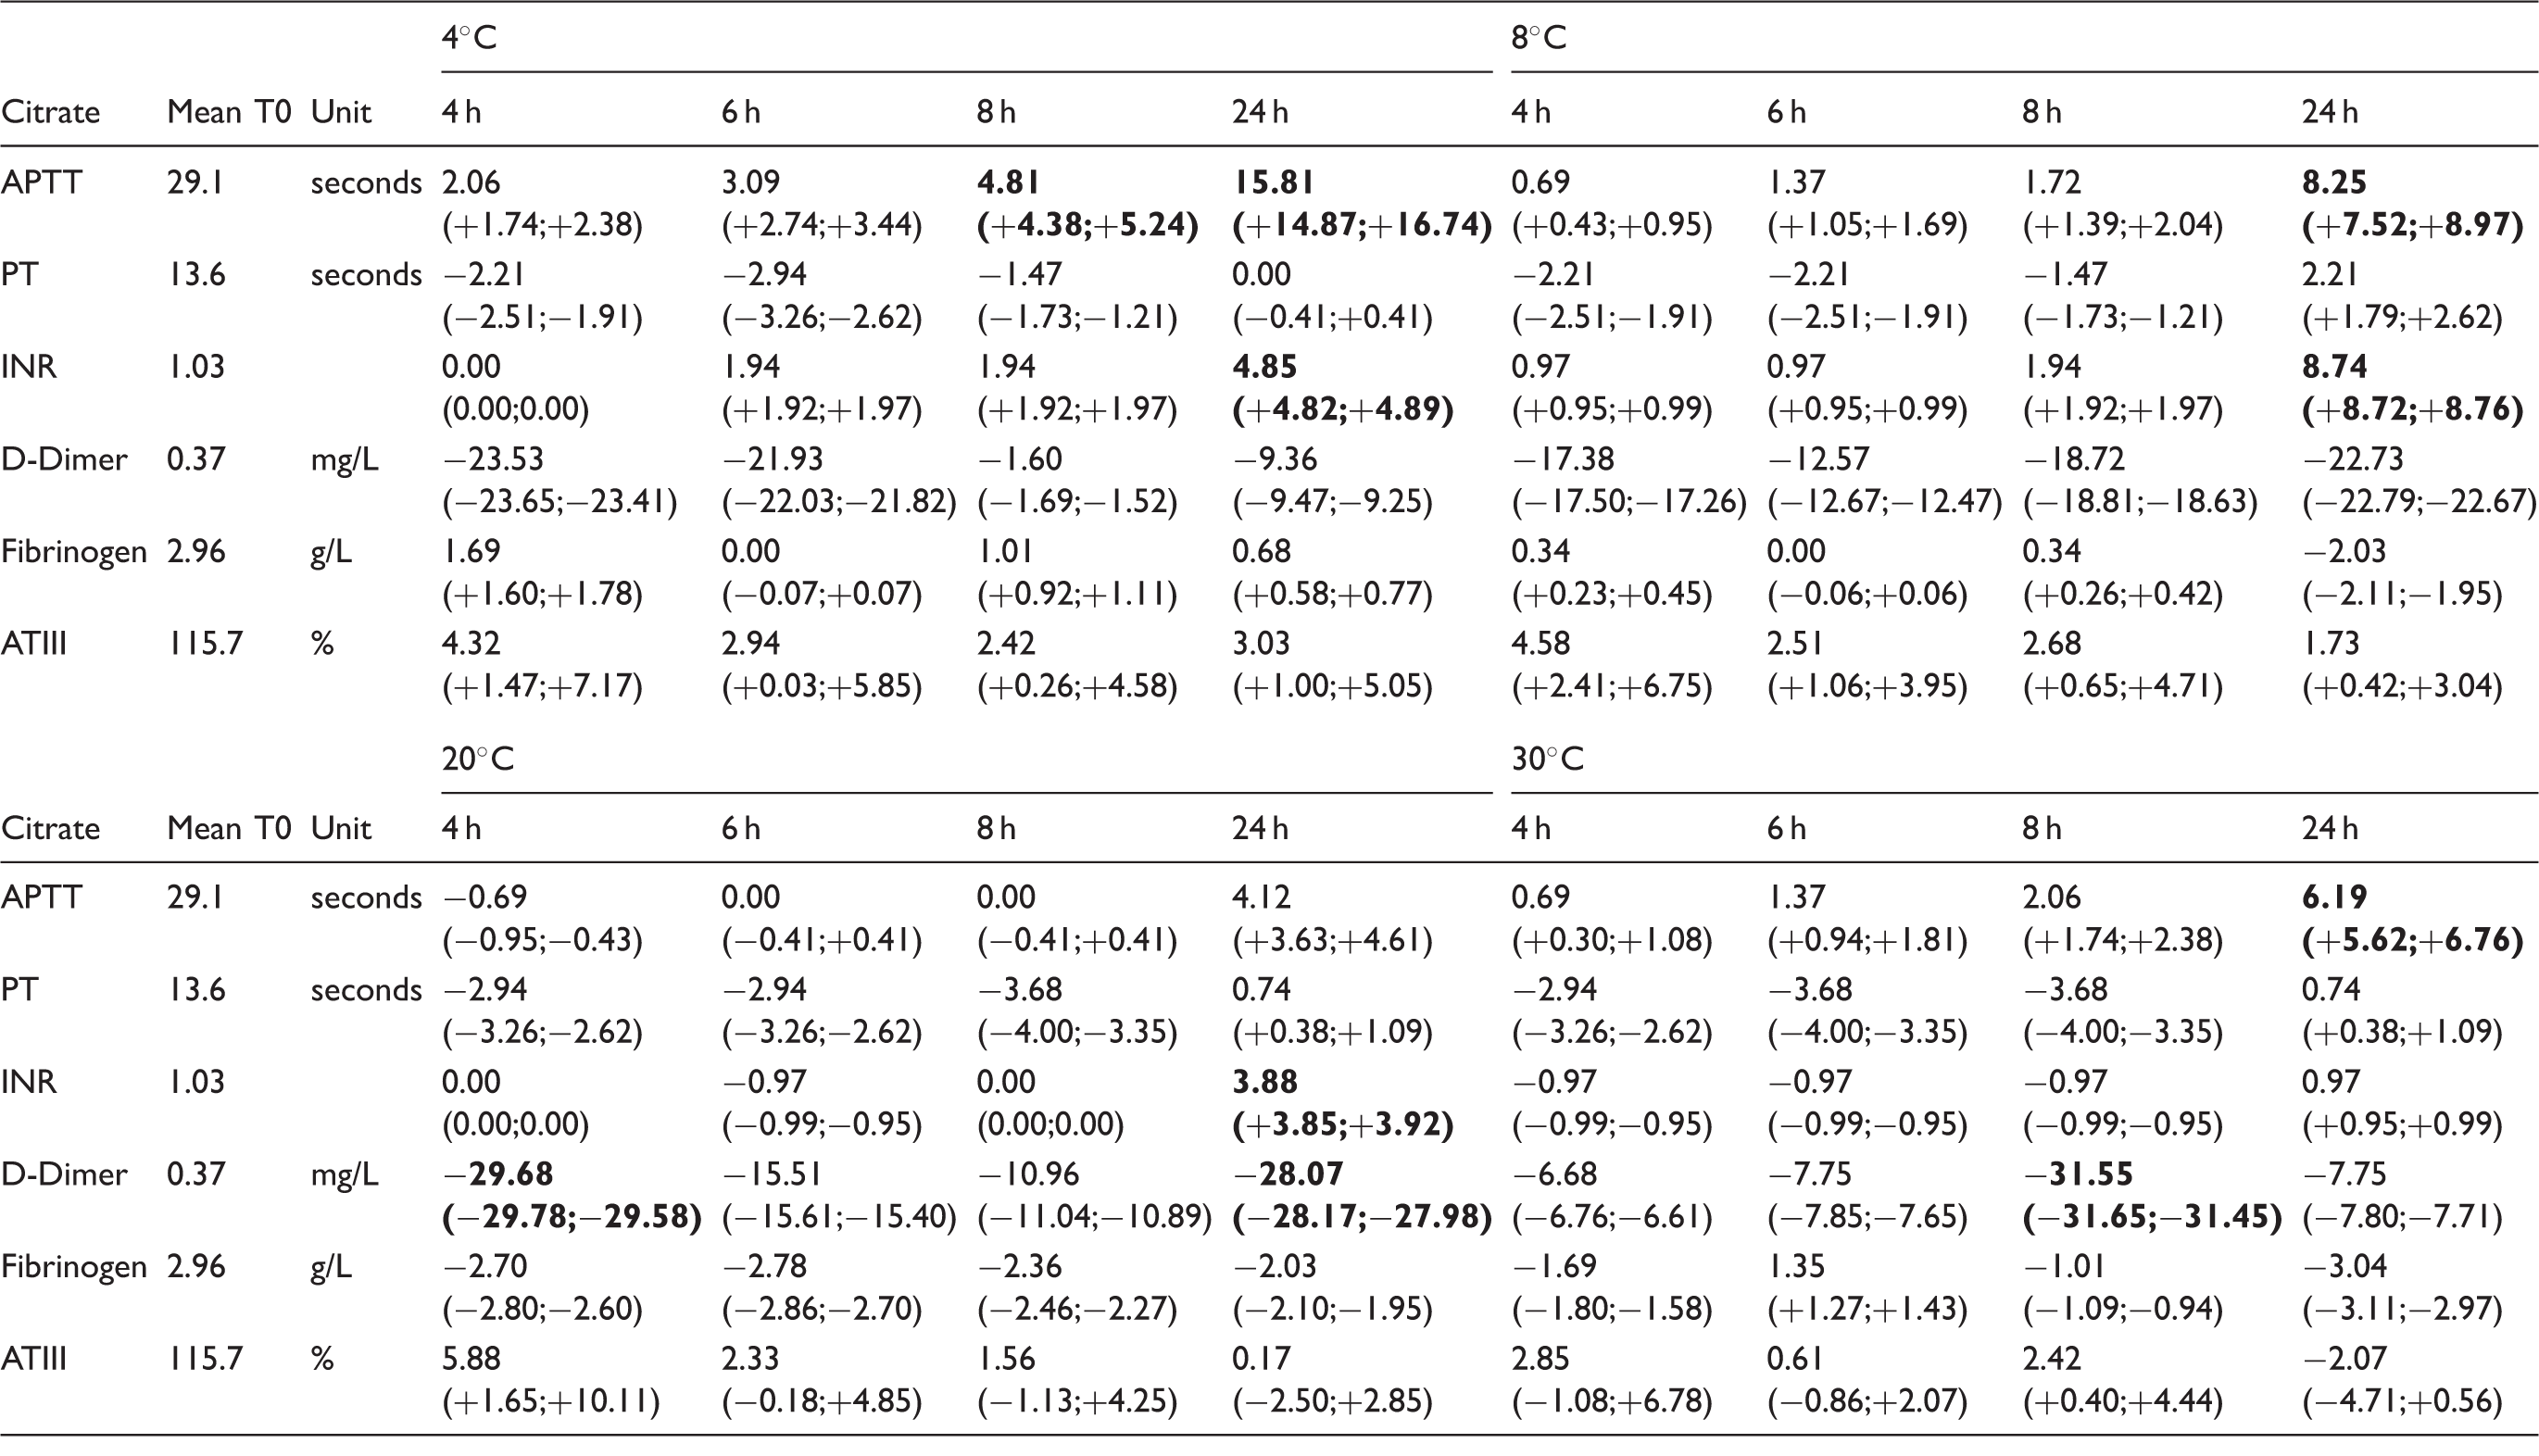
Note: Mean% deviations in relation to T = 0. Bold cells exceed total error allowable (analysis was performed in plasma).
APTT: activated partial thromboplastin time; PT: prothrombin time; INR: international normalized ratio; ATIII: antithrombin III activity.
For biochemistry, Bic and Gluc in LH exceeded the TEa at every examined temperature, but not at all time-points. Bic stayed within the limit at 20℃ at 4 h of incubation and Gluc was stable at 4℃ at 4 h of incubation. Gluc in NaF was more stable than in LH, but exceeded the limit at 6 h of incubation at 20℃. Ca, LD, K and Na exceeded the TEa at 4℃ and 8℃. K also exceeded the limit at 12℃ after 8 h of incubation and at 16℃ and 28℃ after 24 h of incubation and at 30℃ after 6 h incubation. P exceeded the limit at 20℃ and 30℃ after 8 h of incubation.
For haematology, only Ht, MCV, MCH and basophiles exceeded the TEa, but at 20℃ they only exceeded the limit after 24 h.
For coagulation, APTT exceeded the limit at 4, 8 and 30℃, and D-dimer exceeds the limit at 20 and 30℃.
At 20℃, within 4 h, all the chemistry, haematology and coagulation analytes were acceptable for analysis, except D-dimer.
Discussion
In this study, we investigated the influence of temperature and precentrifugation time on the stability of commonly requested chemistry, haematology and coagulation parameters. Some analytes have to be considered carefully when setting up a transport protocol as they show greater variation than the predefined acceptable limit. Here, analytes were mirrored to the TEa and discussed below. Figure 1 suggests a decision chart based on the TEa that could be used to determine whether temperature and time of transported blood tubes from remote locations are acceptable.
Decision chart – parts 1 and 2: Procedure after arrival of transported whole blood tubes at the central laboratory using the TEa as the decision limit. Bic: bicarbonate; Gluc: glucose; MCV: mean corpuscular haemoglobin; NaF: sodium fluoride; TEa: total allowable error; Ca: calcium; Cl: chloride; Gluc: glucose, NaF: sodium fluoride; LD: lactate dehydrogenase; K: potassium; Na: sodium; Ht: haematocrit; MCV: mean corpuscular volume; Reti: reticulocytes; APTT: activated partial thromboplastin time; INR: international normalized ratio; Bic: bicarbonate; LIS: laboratory information system; MCH: mean corpuscular haemoglobin; Mg: magnesium; P: phosphate.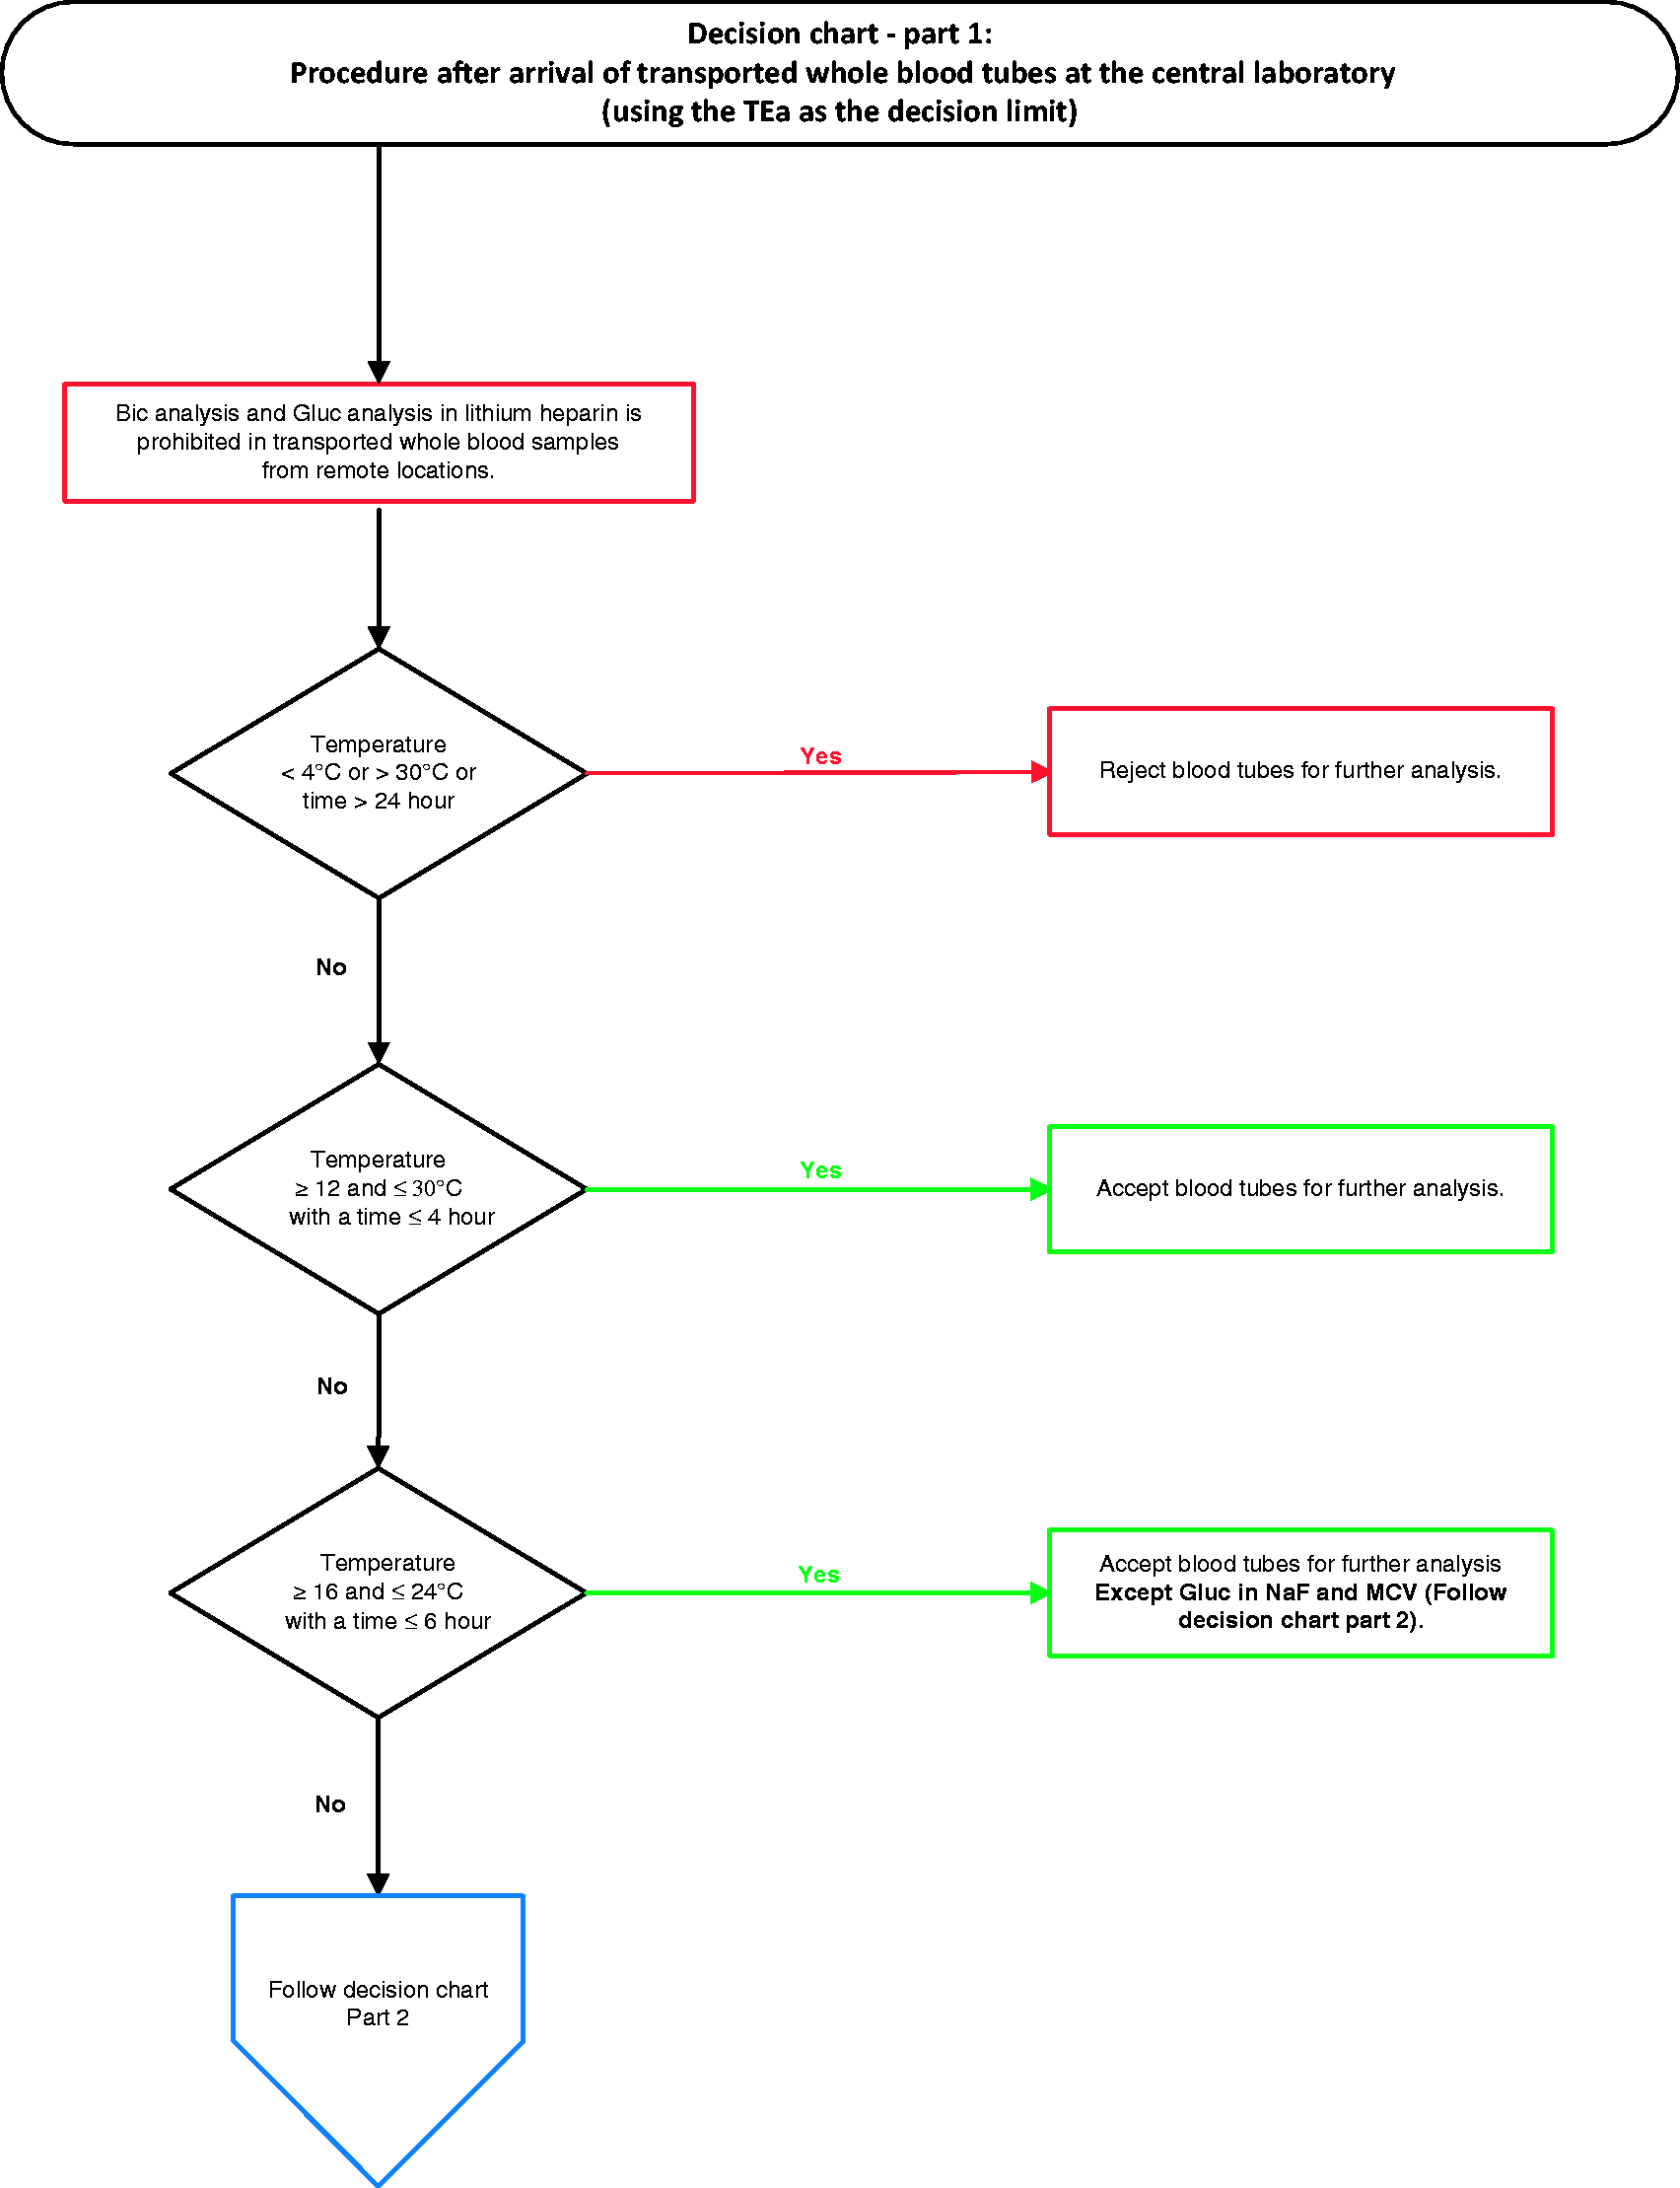
When comparing the results to the CCV, all analytes are accepted up to 8 h after phlebotomy, except Gluc and K. When comparing the results to the MPI, more than half of the analytes are rejected at certain examined time-points and temperatures.
Biochemistry
Bic, Ca, Cl, Gluc, LD, Mg, P, K and Na vary widely, exceeding the TEa at certain incubation times and temperatures.
Bic shows large variation at most times and temperatures. Previously, it was found that Bic is very unstable and should be measured within 30 min after blood collection. 13 Our study suggests that Bic can be accepted when transported at 20℃ and analysed within 4 h, even when using Guder’s stringent MPI as the decision limit. This discrepancy could be explained, because Bic is often calculated from the pH and pCO2 values obtained from a blood gas analysis. Changes in these parameters that indeed occur quickly after phlebotomy also causes changes in Bic. 18 However, in our study, Bic was measured directly without calculation steps.
Ca stability in whole blood has been tested in other studies, although only at limited temperatures (20℃–25℃).7, 9-11, 14 At 4 and 8℃, we found increased Ca concentrations exceeding the limit. The mechanism of this increase has not yet been elucidated.
Another biochemical analyte that exceeded the TEa in our study is Cl. Cl is stable at all temperatures up to 8 h, except at 30℃ (up to 6 h).
Furthermore, we identified that the mean percentage deviation of LD at 6 and 8 h after blood collection was decreased compared with analysis after 4 h at almost all temperatures. This inexplicable pattern is not described in literature; therefore, the precise interactions still need to be investigated further.
Mg was tested in other analyte stability studies, and in these studies deviations were up to 5% and almost completely in accordance with our results.5,6,11,14
Other results can be well explained by physiology.
For example, the decrease of Gluc is due to ongoing glycolysis. The largest variation in Gluc concentrations is measured in LH tubes, which is in concordance with literature.21,22 The stability of Gluc in NaF tubes with EDTA is improved because of inhibited glycolysis. Nonetheless, at 20℃ at 6 and 8 h of incubation Gluc deviations exceed the TEa, which leads to the conclusion that glycolysis is incompletely inhibited under these circumstances.
Two other studies also measured Gluc in NaF EDTA tubes at room temperature and compared it with Gluc in NaF EDTA tubes with citrate.21,22 Deviations in NaF EDTA Sarstedt Monovettes after 4 h at room temperature were higher than in our study, but deviations in NaF EDTA tubes with citrate were small (up to 1.4%), indicating that this tube might be optimal for Gluc diagnostics. 21 Additional testing of NaF with citrate under different temperature circumstances could be valuable.
For K and Na, high temperature stimulates the Na-K ATPase that leads to increased uptake of K and increased release of Na by cells, while low temperatures or cell decay cause the opposite effect. Therefore, K should not be measured in samples stored at temperatures <12℃. Our results show a decrease in K values at all times and temperatures above 20℃, except at 28℃ and 30℃ at 24 h after blood collection. Oddoze et al. found a slight increase of K at 25℃ after 2 and 4 h. 11 Possibly, the function of the Na-K ATPase is decreased after a longer period of time ex vivo. In conclusion, the least variation is observed at 20℃, where variation is acceptable for up to 24 h. As described, the acceptable variation of Na shows a similar pattern, although concentrations decrease with low temperatures. The variation is acceptable at 20℃ at all measured time-points.
Regarding P, it is known that its concentrations increase due to hydrolysis of phosphate esters with subsequent diffusion from the erythrocyte. 5 Ten Boekel et al. showed increasing P concentrations at temperatures of 25 and 35℃ during transport time up to 24 h, but P was stable at 15℃. 23 This is in concordance with our results: an increased P at each temperature, except at 20℃, which shows a slight decrease with a maximum absolute decrease per volunteer of 0.1 mmol/L. This decrease at room temperature is described in the literature and is thought to be due to inorganic P consumption during intracellular phosphorylation of Gluc. 7
Comparable studies already have been performed analysing the stability of multiple biochemical analytes at different conditions, each with its own limitations and caveats.
Guder et al., 13 for example, generated a large review about sample stability and created an overview of all available information on analyte stability. Unfortunately, the stability of whole blood samples ex vivo is only shown at room temperature, while serum/plasma stability is divided into 20℃, 4–8℃ and 20–25℃.
Oddoze et al. 11 investigated the stability of 81 analytes at 4℃ and room temperature and rejected the same biochemical analytes as in our study, except Na. Na was accepted in their study at 4℃ using the total change limit: a variant of the CCV, also including analytical and biological variation.
Monneret et al. 14 also tested 24 biochemical analytes in whole blood at room temperature with 28 healthy volunteers. Mean heparinized plasma concentration measured after 2-h storage of whole blood was considered the baseline value, which is in contrast to our baseline value (0 h). Mean percentage deviations were compared with the analytical change limit (ACL) and reference change value (RCV). The RCV is also comparable to the CCV. Using the ACL as the decision limit, P, Bic and LD are rejected within 6 h at room temperature, whereas only LD is rejected in our results using the TEa as the decision limit. All 24 analytes tested were considered stable for 6 h with the RCV as the decision limit. In our study, these 24 analytes were also stable for 6 h at 20℃ when using the CCV as the decision limit.
Haematology
The largest variation for haematology parameters is observed after 24 h at 20℃ and 30℃, where certain parameters exceed predefined limits. For example, MCV increases, because erythrocytes swell over time. According to the decision chart MCV should be rejected >20℃ and after 4 h, because MCV is exceeding the limit at 30℃ after 6 h. It is very well possible that MCV will not exceed the limit at temperatures in between. An additional experiment at these temperatures in between would be useful to widen the temperature limits for MCV.
The percentage deviation in the basophile count is difficult to interpret, because absolute counts are small in healthy donors. Therefore, measured basophiles were accepted under all circumstances in the decision chart.
Although most parameters are within the predefined limits, it should be noted that cell morphology changes. 24 Flagging generated on automated cell counts as a result of dysmorphic cells is usually followed by manual blood smear analysis, which should be performed within 4 h after phlebotomy. Therefore, haematology parameters should preferably be performed within 4 h.
Coagulation
Concerning the coagulation parameters, only APTT and D-dimer were rejected using the TEa at some temperatures up to 8 h after blood collection.
D-dimer is unexpectedly variable over time at various temperatures. The mean percentage deviation is maximal after 4 h and decreases after 6 h at 20℃. When studying the individual values of the included volunteers, there were no outliers. Measured values were overall variable. In this study with healthy volunteers, D-dimer values were low and consequently percentage deviations were larger. Our data suggest to reject D-dimer at 20℃ after 4 h, but after 6 and 8 h deviations do not exceed the limits. Therefore, D-dimer is accepted until 8 h after phlebotomy in the decision chart, conform recommendations of Guder et al. 13 Further research on D-dimer stability should be performed with elevated D-dimer samples.
Coagulation testing guidelines have been formulated by the Dutch foundation of quality surveillance for medical laboratory diagnostics, which are based on Clinical and Laboratory Standard Institute guidelines and other literature.25–27 This Dutch protocol describes that all whole blood haemostasis tests should be performed within 4 h after blood collection, except D-dimer (6 h) and should be kept between 18 and 24℃. Only APTT, fibrinogen and ATIII can also be tested in blood samples at 2–4℃ within 4 h. However, others have demonstrated that APTT can also be measured within 6 to 8 h after blood collection. 28 In our study, fibrinogen and ATIII are stable at all tested storage conditions. But when patients are treated with unfractionated heparin, samples should be centrifuged within 1 h and testing should be completed within 4 h. 28
Van Geest-Daalderop et al. tested patient material at three different times after blood collection. 25 Their results measured on STA-R are roughly in concordance with our findings. They determined a clinically significant change at 10%. The TEa, CCV and MPI are within this range. INR analysis on STA-R is based on a modified PT-test with excellent sensitivity, which makes it very suitable for discriminating small deviations between samples.
In this study, we tested a wide variety of temperatures and time frames, which gives an overall and complete image of the stability of routine laboratory analytes. Previous studies only tested analyte stability at limited temperatures.
However, there are also some limitations to this study.
Firstly, like most previously published research, we examined healthy volunteers with reference range values. This is especially important for analytes that are low in healthy donors like TropI, Bild, Bilt and CRP.
Secondly, sample size was limited. The majority of chemistry analytes were also independently tested in another laboratory with 10 other healthy volunteers with the same equipment at room temperature at 4 and 8 h of incubation in 10 healthy donors (unpublished data). The conclusions regarding acceptable variation with the TEa as a decision limit were similar with our study, except for P. P exceeded the TEa at 4 h (in our study at 8 h).
Thirdly, mechanical agitation by transportation of the tubes was not taken into account during the experiments, although this should only slightly influence the results if all tubes are transported in a vertical position. van Geest-Daalderop et al. 25 tested mechanical agitation in coagulation parameters and this increased the mean deviation percentage by a maximum of 3.8% in their experiments. Our results for PT are still within the limits when corrected for this factor.
A high quality of laboratory analysis is crucial to diagnose and monitor patients. As part of ISO15189 accreditation, we reviewed the transport conditions of our blood samples and noticed that the current limits for transportation were not completely evidence based.
We recommend each laboratory to arrange their blood transport with the decision limit that fits best in its setting. In concordance with ISO15189, temperature in transport cases and transport time should be kept between predefined limits and should be registered. Consequently, analysis should only be performed on correctly transported blood to avoid errors in test results.
Footnotes
Acknowledgments
We would like to thank Maarten van Gool, Robert Vanderloo, Marie-Louise van Gerven, Afzal Kariman and Shuk Wan Lee for their technical assistance. We thank all the volunteers for donating blood.
Declaration of conflicting interests
The authors declared no potential conflicts of interest with respect to the research, authorship, and/or publication of this article.
Funding
The authors received no financial support for the research, authorship, and/or publication of this article.
Ethical approval
The study was performed under the tenets of the Helsinki declaration, local laws and regulations and was monitored by the scientific committee of the Jeroen Bosch Hospital. The Dutch Medical Research involving Human Subjects Act (WMO) did not apply to this study, because the aim of this study was not to answer a question about health and disease. Therefore, this study is not categorized as medical scientific research.
Guarantor
RK.
Contributorship
NP and RK conceived the study and JB and EG were involved in requesting ethical approval and in amendment to protocol development and data analysis. JB and EG were also involved in volunteer recruitment and practical performance. All the authors contributed to the data retrieval and analysis. JB and MH wrote the first draft of the manuscript. All authors reviewed and edited the manuscript and approved the final version.