
Abstract
Background
Results of numerical pathology tests may be subject to interference and many laboratories identify such interferences and withhold results or issue warnings if clinically erroneous results may be issued. Some laboratories choose to correct for the effect of interferences, with the uncertainty of the correction noted as a limitation in this process. We investigate the effect of correcting for the effect of interferences on the ability to release results within defined error goals using the effect of in-vitro haemolysis on serum potassium measurement as an example.
Methods
A model was developed to determine the uncertainty of a result corrected for the effect of an interferent with a linear relationship between concentration and effect. The model was used to assess the effect of correction on the results which could be released within specified accuracy criteria.
Results
Using the effects of haemolysis on potassium results as an example, the maximum amount of haemolysis in a sample that would change the result by > 0.5 mmol/L, with a frequency of 5%, was increased from approximately 1100 mg/L (no correction) to 8000 mg/L (with correction).
Conclusions
With modelling of the factors related to the uncertainties of results in the presence of interferences, it is possible to release results in the presence of significantly higher concentrations of interferences after correction than without correction. Correction of a result for a known bias and allowance for the uncertainty of the correction can be considered consistent with the guide to the expression of uncertainty in measurement (GUM).
Introduction
For some numerical laboratory tests the presence of potential interferents is assessed so that the laboratory can provide a consistent response. Examples include the identification of haemolysis or icterus on routine chemistry samples using spectrophotometry. 1 In some cases, these (semi) quantitative measurements closely approximate the concentration of haemoglobin or bilirubin while in other systems, only a qualitative grading is provided. In response to the presence of an interferent laboratories may respond in a number of ways. These responses may include withholding results when the interferent exceeds a specified level; issuing the results with a generalised warning comment about possible effects of the interferent; or issuing the result with an estimation of the amount of change that may have occurred due to the presence of the interference. An alternative approach is to correct for the effect of the interference with the aim of releasing more results. 2 This is a controversial practice with mixed views on its validity and safety.1,3–7 Some authors have suggested that correction can be done with the associated uncertainty reported in a qualitative or semi-quantatitive manner.5,7–10
For any response to an interferent the laboratory must determine several factors. One factor is the maximal allowed change in the result due to the interference. This is based on the likely clinical effect of an error of the allowed magnitude. The other key factor is the amount of interferent that may cause the allowed change. This may be based on information supplied by the kit manufacturer, obtained from the literature, or on local experimental evidence. The experimental data on the effect of interferences from any of these sources will show a range of different responses, provided multiple experiments have been performed, which can be described with an average response and the uncertainty about that average. An additional component in determining a response to interferences is the percentage of results which may be erroneous by more than the maximal allowed. The simplest model is based on determining the average concentration of the interferent which produces the maximal allowed change. This model does not account for any uncertainty in the interferent effect and sets the fraction of results affected by more than the maximal allowable change at 50%. A more sophisticated model will include the uncertainty of the effect of the interferent as well as establishing the allowable fraction of results that may exceed this limit.
In this paper, we analyse the effect of correction for interferences on the ability to release results within defined standard of accuracy when the uncertainties of the measurement of the measurand of interest, the measurement of the interferent and the slope of the correction algorithm are considered. The correction for known causes of bias, and including consideration of the uncertainty of that correction, is recommended in standard metrology according the Guide to the Expression of Uncertainty of Measurement (GUM). 11 The study is limited to situations where the concentration of the interferent is measured and there is a linear relationship between the concentration of the interferent and the effect on the measurement of the measurand of interest. Common examples where this approach may be applied are the effect of in-vitro haemolysis on results for serum potassium, creatine kinase, folate or lactate dehydrogenase or bilirubin on some assays for creatinine, magnesium or total protein. 12 In this paper, data for the effect of in-vitro haemolysis on potassium measurement used as an example.
Methods
A model to quantitate the effect of interference on results was developed using Microsoft Excel. The model predicted the amount of interferent which would produce more than a fixed percentage of results beyond acceptable limits, with and without correction for the effect of the interferent. The following inputs were included in the model: measured measurand concentration in the absence of interferent (Ao); uncertainty of the measurement of the measurand concentration expressed as co-efficient of variation (CVA); measured interferent concentration (B); uncertainty of the measurement of the interferent expressed as co-efficient of variation (CVB); slope of the effect of the interferent on measurement of measurand (C); uncertainty of the slope of the effect of the interferent on measurement of measurand (CVC, see Appendix for terminology summary). The model also required a maximal allowable error and maximal percentage erroneous results. The inputs to the model were varied and the maximal allowable interferent concentration determined for corrected and uncorrected results. The study was limited to interferents with a linear effect on the result.
The combined uncertainty of measurement of A in the absence of interferent is:
Based on the above description it follows that for a given concentration A in the presence of B the best estimate of the measured concentration AB is: AB = Ao + (B × C).
Then U
AB
is the combined uncertainty of the measurand measurement at the measured concentration and the uncertainty of the correction, where the uncertainty of the correction is the combined uncertainty of measurement of the interferent and the uncertainty of the slope of the interferent effect and is given as:
The model predicts, for known input values, the best estimate of AB and the 95% confidence interval for determination of AB. A one-tailed probability is used for interpretation when the result of the interference is to adjust results in one direction.
The effect of correction for the interferent effect was modelled by removing the bias predicted by the amount of interferent and calculating the uncertainty with the same equation. The average and uncertainties of the slope of the interference effect and the uncertainty of the measurement of the interferent used to predict the effect of the presence of an interferent, are the same as should be applied to remove the effect of an interferent.
By way of example the model was populated with representative data for the effect of haemolysis on potassium measurements. The following parameters were based on previously published data examining the effect of haemolysis on serum potassium measurement on a Roche Diagnostics 917 clinical chemistry analyser. 13 Haemolysis was assessed by H index measurement in mg/dL and converted to mg/L for further analysis. This spectrophotometric measurement correlates well with chemical haemoglobin measurement.14,15 Input variables for the model were: C (K/Hb): 0.0028 mmol/mg, CVC: 9%, CVA: 2%, CVB: 5%. 13 An allowable error due to the combined effect of haemolysis and analytical imprecision was taken as 5% of results outside ±0.5 mmol/L. Further analysis was done using different estimates of CVc with other parameters unchanged to assess the effect of the uncertainty of the interferent effect on the reportability of results.
Results
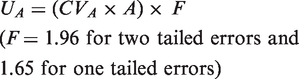
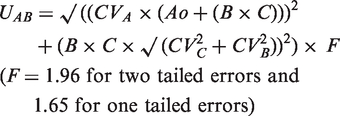
The model was tested using data for the effect of haemolysis on potassium results. Figure 1 shows the expected range of values for measured potassium in samples with various amounts of haemolysis for a true value of 5.0 mmol/L, a CVA of 2%, a CVB of 5%, a slope for C of 0.00028 and a CVC of 9%. It can be seen that it is predicted that an amount of haemolysis releasing approximately 1100 mg/L haemoglobin will produce 5% of results outside the selected error limits of ±0.5 mmol/L potassium. Figure 2 shows the expected range of values for measured potassium under the same conditions after correction for the average effect of haemolysis. In this example, the use of the corrected results allows release of results up to a haemolysis amount of approximately 8000 mg/L as opposed to an amount of 1100 mg/L for the raw results. Alternatively for results up to an haemolysis indicated by 1100 mg/L the 95% confidence interval of the results error is less than ±0.3 mmol/L compared with up to 0.5 mmol/L for the raw results.
Effect of haemolysis on potassium measurement before correction. The solid black line is the average, and the upper and lower black short-dashed lines are the 95% confidence intervals for the range of expected results for a sample with 5.0 mmol/L potassium measured with an assay with a CV of 2% and effect of haemolysis as described in the text. The grey short-dashed lines indicate the 95% one-tailed uncertainty limits. The long-dashed horizontal lines indicate the selected allowable error limits of ±0.5 mmol/L. At haemolysis indicated by haemoglobin greater than 1100 mg/L (indicated by the arrow) there is a greater than 5% chance that the measurement result will be outside the allowable error limits. Effect of haemolysis on potassium measurement after correction. The solid line represents the average and the upper and lower black short-dashed lines are the 95% confidence intervals for the range of expected results for a sample with 5.0 mmol/L potassium measured with an assay with a CV of 2% and effect of haemolysis as described in the text after correction for the effect of the haemolysis. The horizontal long-dashed lines indicate the selected allowable error limits of ±0.5 mmol/L. At haemolysis indicated by haemoglobin greater than 8000 mg/L (indicated by the vertical arrow) there is a greater than 5% chance that the measurement result will be outside the allowable error limits.
The model was tested with a wide range of inputs for the uncertainty of the slope of the interference effect with other parameters unchanged (Figure 3). It can be seen that the effect of this uncertainty has different effects on ability to release corrected and uncorrected results, however in all cases more corrected results are able to be released. Changes in all other parameters were assessed and in all cases the use of results corrected for the effect of the interferent allowed results to be released at a higher interferent concentration compared with uncorrected results, or for the same amount of interference of the expected error was smaller.
Effect of uncertainty of the slope of the interference effect (CVc) on the haemolysis limit for releasing potassium results, With all parameters unchanged from the model as shown in Figures 1 and 2, with the exception of CVc, the upper haemolysis limit for releasing results is shown for uncorrected results (black unbroken line) and for corrected results (grey dashed line). The vertical arrow shows the values obtained in the model with a CVc of 9% as used in Figures 1 and 2.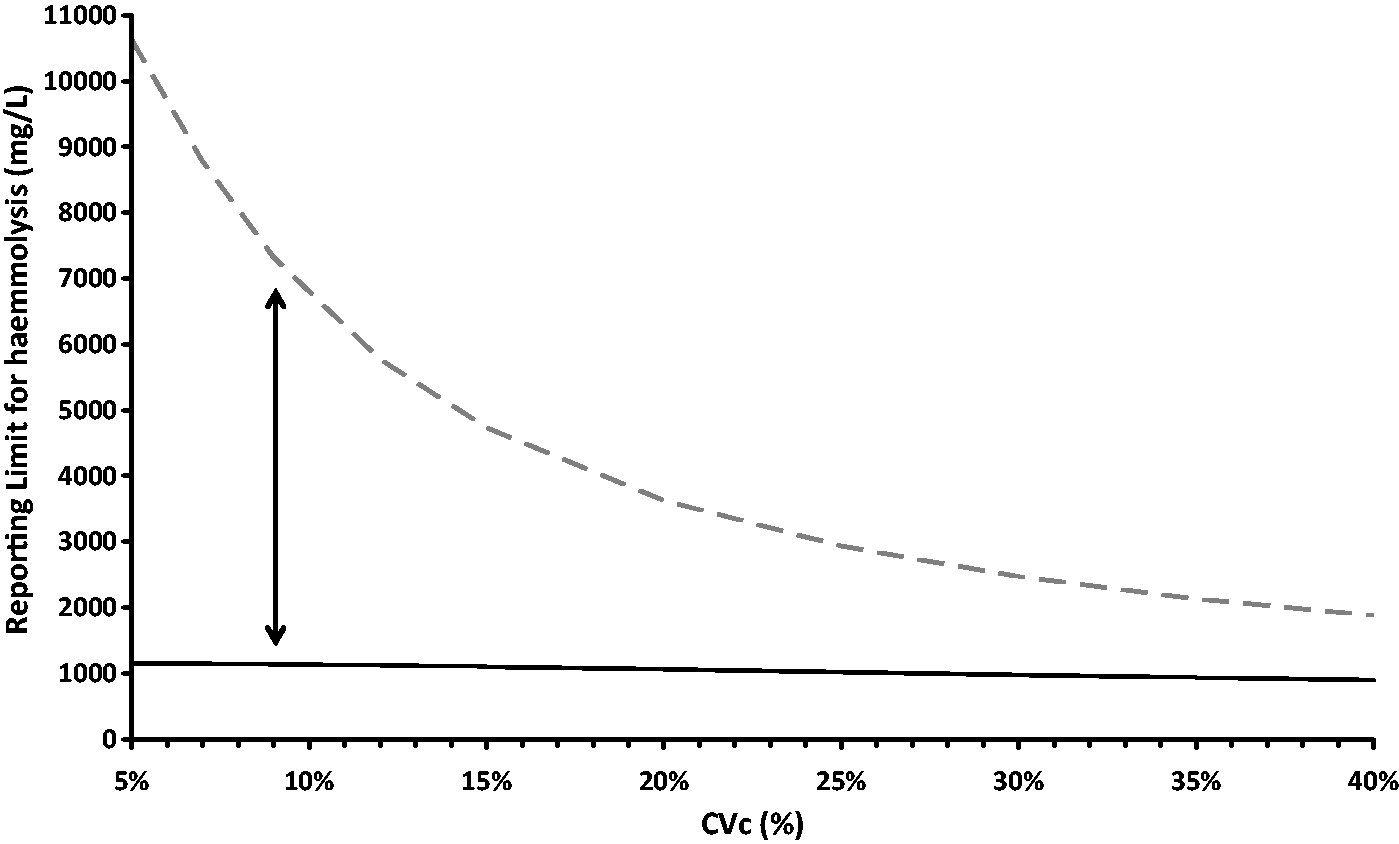
Discussion
Laboratories have a variety of options when handling analytical interference affecting laboratory measurements. These include the following.
Reporting all results uncorrected for interference. Reporting results uncorrected for interference up to a given interferent threshold and suppressing results above this threshold. Reporting semi-quantitative results based on corrected results for a given interferent threshold and suppressing results above this threshold. Reporting all results corrected for interference. Reporting results corrected for interference up to a given interferent threshold and suppressing results above this threshold.
The best alternative is that which minimises the unacceptable bias rate in reported results. From inspection of equations (1) and (2), it can be seen that a corrected result inevitably has a greater uncertainty in the reported value compared with a result from a sample without an interferent. However, as shown in Figures 1 and 2, much higher interferent concentrations can be tolerated with the corrected model than the uncorrected results before the bias rate becomes unacceptable. In this study, the definition of bias as 0.5 mmol/L with a maximally acceptable rate of 5% was arbitrary but the superiority of the corrected model over the uncorrected approach would seem universally true in the absence of grossly elevated values for CVb and/or CVc. Thus it would appear that options 4 and 5 above are preferable to 1 and 2 in minimising the rate of unacceptably biased results. This finding remains true for different values for the uncertainty of the slope of the interference correction. With any of the responses above laboratories may choose to add a comment indicating the uncertainty of the result due to the process adopted. Approach 3 above can be considered as an expression of the uncertainty, but without providing the best estimate of the result.
Previous authors have indicated that correction for interferences can lead to increased uncertainty of the results. On this basis it has been advised that correction for the effect of interferences is not recommended. We agree that any correction process adds uncertainty to a result but would make three additional observations.
Firstly that uncorrected results in the presence of an interference display the same uncertainty in their difference from the true value as is seen with corrected results. Secondly that any evidence-based quantitative response to an interferent requires an assessment of the uncertainty of the effect of that interferent. Thirdly we have demonstrated that correcting for the effect of the interference reduces the expected uncertainty of the issued results.
As indicated above the removal of a known source bias, and inclusion of the uncertainty of that removal process in the final estimate of the uncertainty of the result of this is consistent with recommendations in the Guide to the Expression of Uncertainty of Measurement (GUM). We believe that this approach may allow more results to be issues from routine laboratories and the uncertainty of released results can be reduced.
A key component of the approach is valid comprehensive studies to understand the effect of an interference. Such studies must accurately replicate the “real world” setting and take all relevant factors into account. The recently published guidelines from the Clinical and Laboratory Standards Institute on serum indices as indicators of interference provide standardised protocols for use by laboratories and diagnostic manufacturers. 1 The resolution of interference measurements available (semi-quantitative or qualitative) will limit the utility of this approach. Exceptions to the application of the correction, for example intravascular rather than in-vitro haemolysis, must be identified and acted on appropriately. It is appreciated that assessment of free haemoglobin concentration in plasma and serum is a incomplete measure of all pre-analytical damage to blood constituents (red cells, white cells, platelets) and truly reflects only erythrolysis. 16 If there are multiple sources of interference, e.g. fragile white cells in leukaemia or thrombocytosis affecting potassium results, these could be addressed with separate correction equations provided the data supported a linear relationship and the uncertainties were small enough to make correction worthwhile. Inadequate experimental data may lead to incorrect corrections, in the same way as it may lead to incorrect decisions about whether to release a result of not in the presence of an interferent when corrections are not performed.
This study indicates that issuing of results corrected for the effect of interference is superior to uncorrected results when the uncertainties of each final result are included in the decision. The model described here is limited to linear responses, however the principle may be applicable in different settings with different measurable interferences.
Footnotes
Declaration of conflicting interest
None declared.
Funding
This research received no specific grant from any funding agency in the public, commercial, or not-for-profit sectors.
Ethical approval
Not applicable.
Guarantor
GJ.
Contributorship
GJ conceived the study. RH researched literature and provided supporting data. Both authors reviewed and edited the manuscript and approved the final version of the manuscript.