
Abstract
Background
Microalbuminuria represents vascular and endothelial dysfunction. Thyroid hormones can influence urine albumin excretion as it exerts crucial effects on the kidney and on the vascular system. This study explores the relationship between serum thyrotropin and urine albumin excretion in euthyroid patients with diabetes.
Methods
A total of 433 patients with type 1 or 2 diabetes were included in this retrospective cross-sectional study. Data included anthropometric measurements and biochemical parameters from diabetes clinic. Males with urine albumin creatinine ratio >2.5 and female’s >3.5 mg/mmoL were considered to have microalbuminuria.
Results
34.9% of the patients had microalbuminuria. Prevalence of microalbuminuria increased according to TSH quartiles (26.9, 34.6, 38.5 and 44.9%, P for trend = 0.02). In a fully adjusted logistic regression model, higher TSH concentrations were associated with high prevalence of microalbuminuria (adjusted odds ratio 2.06 [95% CI: 1.14–3.72]; P = 0.02), while comparing the highest with the lowest quartile of TSH. Multiple linear regression analysis showed an independent association between serum TSH and urine albumin creatinine ratio (β = 0.007, t = 2.03 and P = 0.04). The risk of having microalbuminuria was higher with rise in TSH concentration in patients with younger age (<65 years), raised body mass index (≥25 kg/m2), hypertension, type 2 diabetes and hyperlipidaemia and age was the most important determinant (P for interaction = 0.02).
Conclusion
Serum TSH even in the euthyroid range was positively associated with microalbuminuria in euthyroid patients with diabetes independent of traditional risk factors. This relationship was strongest in patients with components of the metabolic syndrome.
Introduction
Thyroid hormones are essential for the embryonic development of kidneys and they also regulate several physiological functions of the kidney in the adult life both directly and indirectly. The direct effects are usually on glomerular function, tubular absorptive and secretory capacities and the functioning of different electrolyte pumps whereas indirect actions are due to influences on the cardiovascular system which ultimately affects renal blood flow (RBF). 1 In addition, the kidneys also influence synthesis, secretion, metabolism and elimination of thyroid hormones and are also the important target organs for thyroid hormones’ actions.1,2 Such a dynamic interplay can alter significantly in a dysthyroid state (hypo or hyperthyroidism) leading to changes in clinical renal parameters like glomerular filtration rate (GFR), urine-specific gravity, urinary protein creatinine ratio and markers of tubular function.3–5 Likewise, alteration in renal haemodynamics from moderate to advanced renal disease can lead to thyroid hormone dysfunction and manifest as subclinical or overt thyroid disease.6,7
Microalbuminuria is a marker of generalized endothelial dysfunction and an important determinant of vascular disease.8,9 Moreover, it increases the risk of diabetes, hypertension, decline in renal function and cardiovascular and all-cause mortality in individuals without diabetes. 8 Thyroid hormones have also been linked to endothelial dysfunction due to effects on blood vessel dilatation and signal processes that regulate endothelial function and homeostasis.10–12 As thyroid function and microalbuminuria are both associated with endothelial dysfunction and vascular disease, several authors have studied this inter-relationship intricately.13–15 Albuminuria has been identified to be an independent risk factor for elevated concentrations of thyroxine (T4) in patients with chronic kidney disease (CKD). 16 On the other hand, free tri-iodothyronine (FT3) concentrations were found to be inversely associated with microalbuminuria in a euthyroid cohort 17 and in euthyroid patients with diabetic nephropathy (DN). 18
Previous studies have explored this close interrelationship between thyroid hormones and albuminuria and have shown that serum thyrotropin (TSH) is independently associated with renal function and CKD in normoglycaemic euthyroid adults, 19 whereas others have established an independent association between microalbuminuria and subclinical hypothyroid (SCH) disease in prediabetic adults 20 and in patients with type 2 diabetes. 21 As albuminuria is a well-established microvascular complication in patients with diabetes 22 which may impact thyroid function 16 and vice versa, we conducted this cross-sectional study to investigate the association of urine albumin excretion (UAE) and serum TSH in euthyroid patients with diabetes.
Patients and methods
Study population and design
This was a retrospective cross-sectional analysis of patients who attended the diabetes clinic at our hospital from October 2010 to May 2016. A total of 679 patients were included initially, and upon exclusion 433 were found to be eligible for the study (Figure 1). Patients were included if they had type 1 or type 2 diabetes and were aged 18–90 years. Patients were excluded if they had biochemical evidence of thyroid disease or were receiving thyroxine, carbimazole, propylthiouracil, lithium, glucocorticoids, amiodarone, antipsychotic and antiepileptic drugs (n = 36). We also excluded patients who had established kidney disease (estimated glomerular filtration rate [eGFR] < 60 mL/min/1.73 m2) (n = 68) or were taking medications like angiotensin converting enzyme inhibitors/angiotensin receptor blockers (n = 113) and had missing or incomplete anthropometric indices (n = 12) and laboratory test results (n = 17).
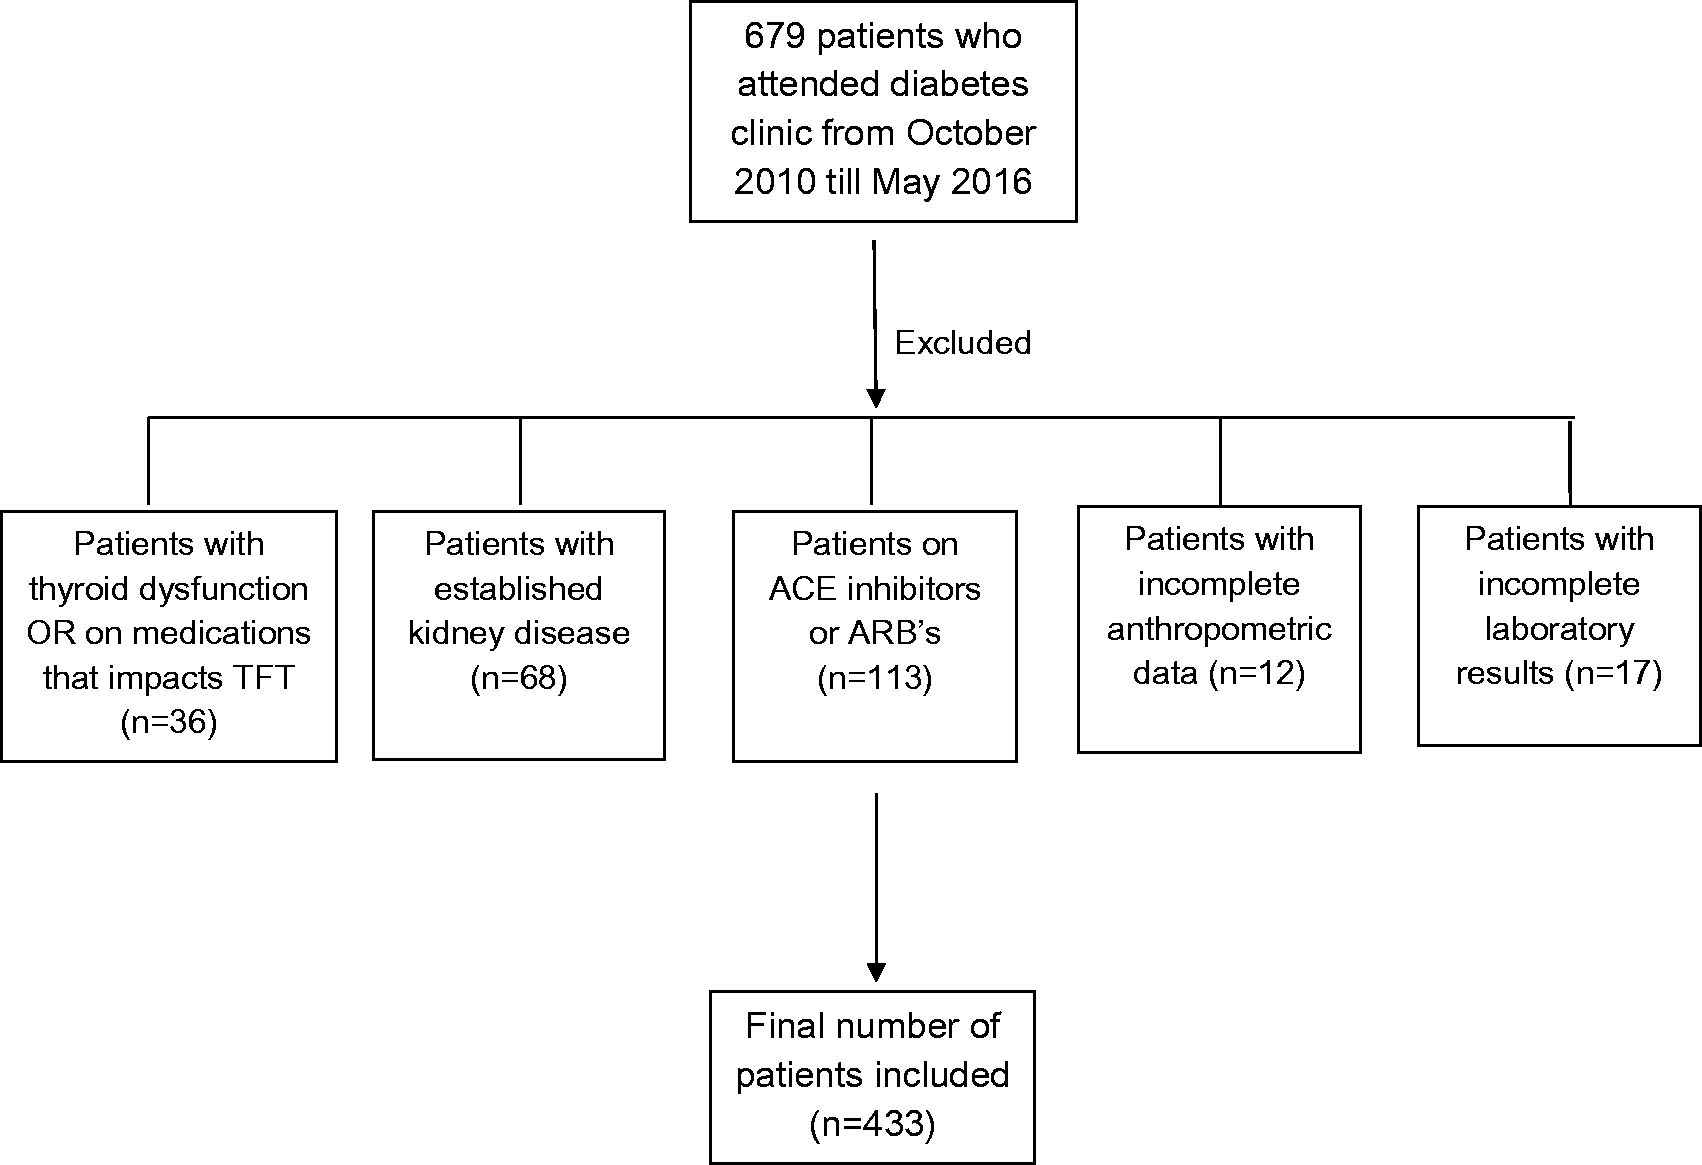
Study design.
Anthropometric parameters like weight, height and blood pressure were measured by nurses in the outpatient department. Body mass index (BMI) was calculated using the formula: weight in kg/height in m2. Patients were defined to have hypertension if their systolic blood pressure (SBP) was > 140 mmHg and/or diastolic blood pressure (DBP) was >90 mmHg (average of three measurements) or when they had an established diagnosis of hypertension and were taking regular medications. Patients were defined to have dyslipidaemia according to National Cholesterol Education Program Adults Treatment Panel III criteria. 23 Renal function, glycated haemoglobin (HbA1c), lipid profile and thyroid function were checked during their attendance and a first voided early morning spot urine sample was collected for assessing urine albumin creatinine ratio (UACR) as containers are sent routinely to patients prior to their visit to the clinic. Patients were defined to have microalbuminuria if their UACR was >2.5 mg/mmoL in males and >3.5 mg/mmoL in females. The study was registered and approved by the Research and Development department of Cwm Taf University Health Board with project number CT/580/15. All data were handled according to Caldicott principles.
Biochemical measurements
HbA1c concentrations were determined by ion-exchange HPLC (G8, Tosoh, Amsterdam, Netherlands) with inter-assay coefficient of variation (CV) of 2.4% at 83 mmol/moL. Serum TSH and FT4 were determined by electrochemiluminescence on Roche Modular E analysers (Roche, Burges Hill, UK), with inter-assay CVs of 3.5% at 0.45 mU/L and 2.9% at 11.8 pmol/L, respectively. All other analytes were analysed on Roche Modular P analysers (Roche, Burges Hill, UK). Serum lipid profiles included total cholesterol, HDL cholesterol and triglyceride, all determined by enzymatic colorimetric methods, with typical inter-assay CVs of 2.1% at 3.0 mmol/L, 3.6% at 0.6 mmol/L and 3.9% at 1.0 mmol/L. LDL was calculated by the Friedewald equation. Serum creatinine concentrations were determined by rate-blanked kinetic Jaffe method with inter-assay CV of 3.6% at 75 μmol/L. eGFR was calculated by IDMS aligned MDRD equation (equation (1)). Equation (1): {175 × ((([Creat]Ser–3.08)/1.004) × 0.011312)−1.154 × Age−0.203 × (0.742 if female)} UACRs were determined by immunoturbidimetry and kinetic Jaffe methods, respectively, on Cobas Integra 400 instruments (Roche, Burges Hill, UK) with inter-assay CVs of 2.2% at 5.6 mmol/L and 6.9% at 14.2 mg/L, respectively.
Data analysis
Continuous variables are presented as means ± standard deviation (SD) and as medians and interquartile range (IQR= Q3-Q1) if not approximating the normal distribution. The study population was divided into four groups according to the quartiles of TSH. We described demographic and metabolic features in each quartile and compared means using one-way ANOVA and medians using Kruskal-Wallis test, respectively. We investigated the association of TSH categories and microalbuminuria by using univariable and multivariable adjusted logistic regression models using UACR as the dependent variable and TSH categories as the independent variable. In multivariate logistic regression model, we adjusted for potential confounding factors like age, sex, BMI, type of diabetes, SBP, FT4 and high lipids. We also confirmed the findings of logistic regression models by performing additional bootstrap analysis.
We also studied if the association of serum TSH and microalbuminuria was more prominent in certain subgroups by performing stratified analyses on the association between TSH and the risk of microalbuminuria by the prominent risk factors like gender, age, BMI, hypertension, eGFR and hyperlipidaemia. Adjusted odds ratio (OR) was calculated for increase of each 1 SD in log TSH concentration in subgroups of different variables. A P value for interaction was calculated using likelihood ratio tests in each subgroup to evaluate their impact on the association of serum log TSH and microalbuminuria risk. For all statistical analyses, a P value of < 0.05 was statistically significant. All statistical analyses were undertaken using STATA version 12 (STATACORP, College Station, TX, USA).
Results
Characteristics of the study population
Table 1 shows the baseline characteristics of the entire study population which had a mean age of 60 ± 15.5 years with males in the majority (63.1%). Most of our patients had type 2 diabetes (87.5%) and the overall glycaemic control was suboptimal (HbA1c– 8.8 ± 1.9%; (72.5 ± 21.0) mmol/moL). The overall prevalence of microalbuminuria was 36.3% (157/433 patients) and majority were in males (69.5%).
Baseline characteristics of the total group.
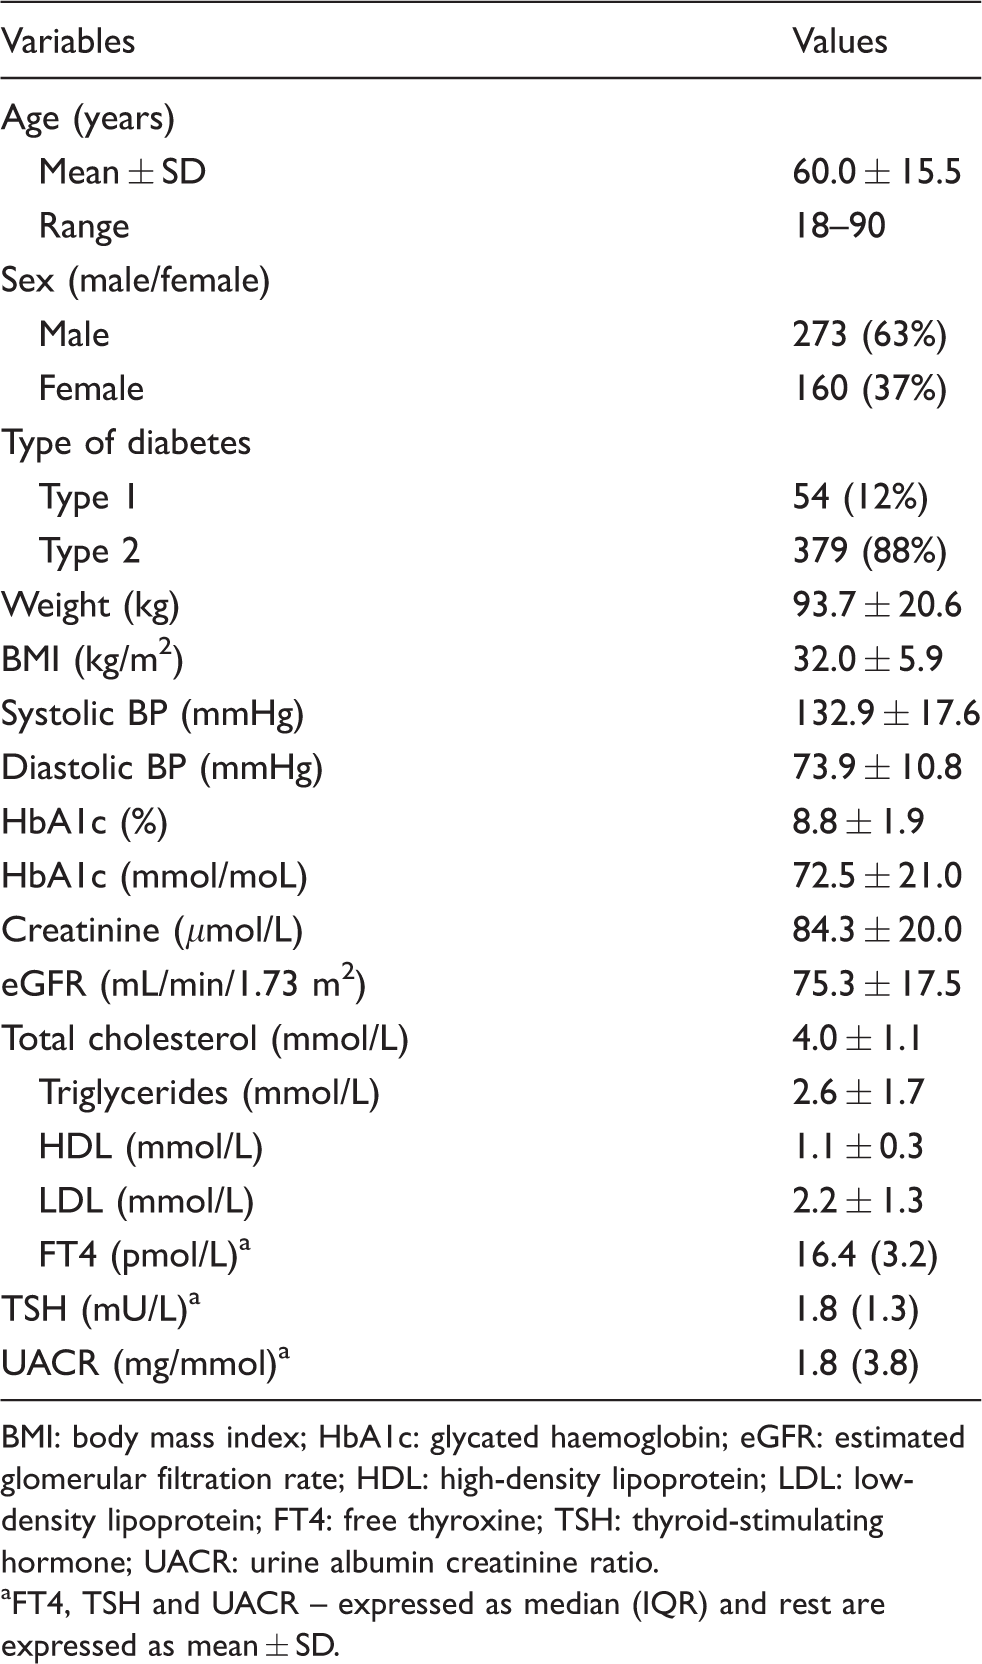
BMI: body mass index; HbA1c: glycated haemoglobin; eGFR: estimated glomerular filtration rate; HDL: high-density lipoprotein; LDL: low-density lipoprotein; FT4: free thyroxine; TSH: thyroid-stimulating hormone; UACR: urine albumin creatinine ratio.
aFT4, TSH and UACR – expressed as median (IQR) and rest are expressed as mean ± SD.
Table 2 demonstrates the general characteristics and metabolic parameters of the study population when they were divided into four groups according to quartiles of TSH with the first quartile representing the lowest one and fourth quartile representing the highest one (Q1: 0.46 to <1.28; Q2: 1.28 to < 1.81; Q3: 1.81 to < 2.58; Q4: > 2.58 mU/L). There was no statistically significant difference in age, weight, BMI, DBP, HbA1c, creatinine, eGFR, FT4 and lipid profile with the increment in TSH, but an association was noted with risk factors including male gender, SBP and prevalence of type 2 diabetes across different groups (P < 0.05). In comparison to the patients in the lowest quartile of TSH (reference category), those in the second, third and highest quartiles had higher concentrations of UACR (1.6 [0.9–3.2]; 1.7 [1.0–4.3]; 2.1 [0.8–4.4] and 2.4 [0.9–8.5] mg/mmoL) and comparison across groups was statistically significant.
Characteristics of the study population according to TSH quartiles.
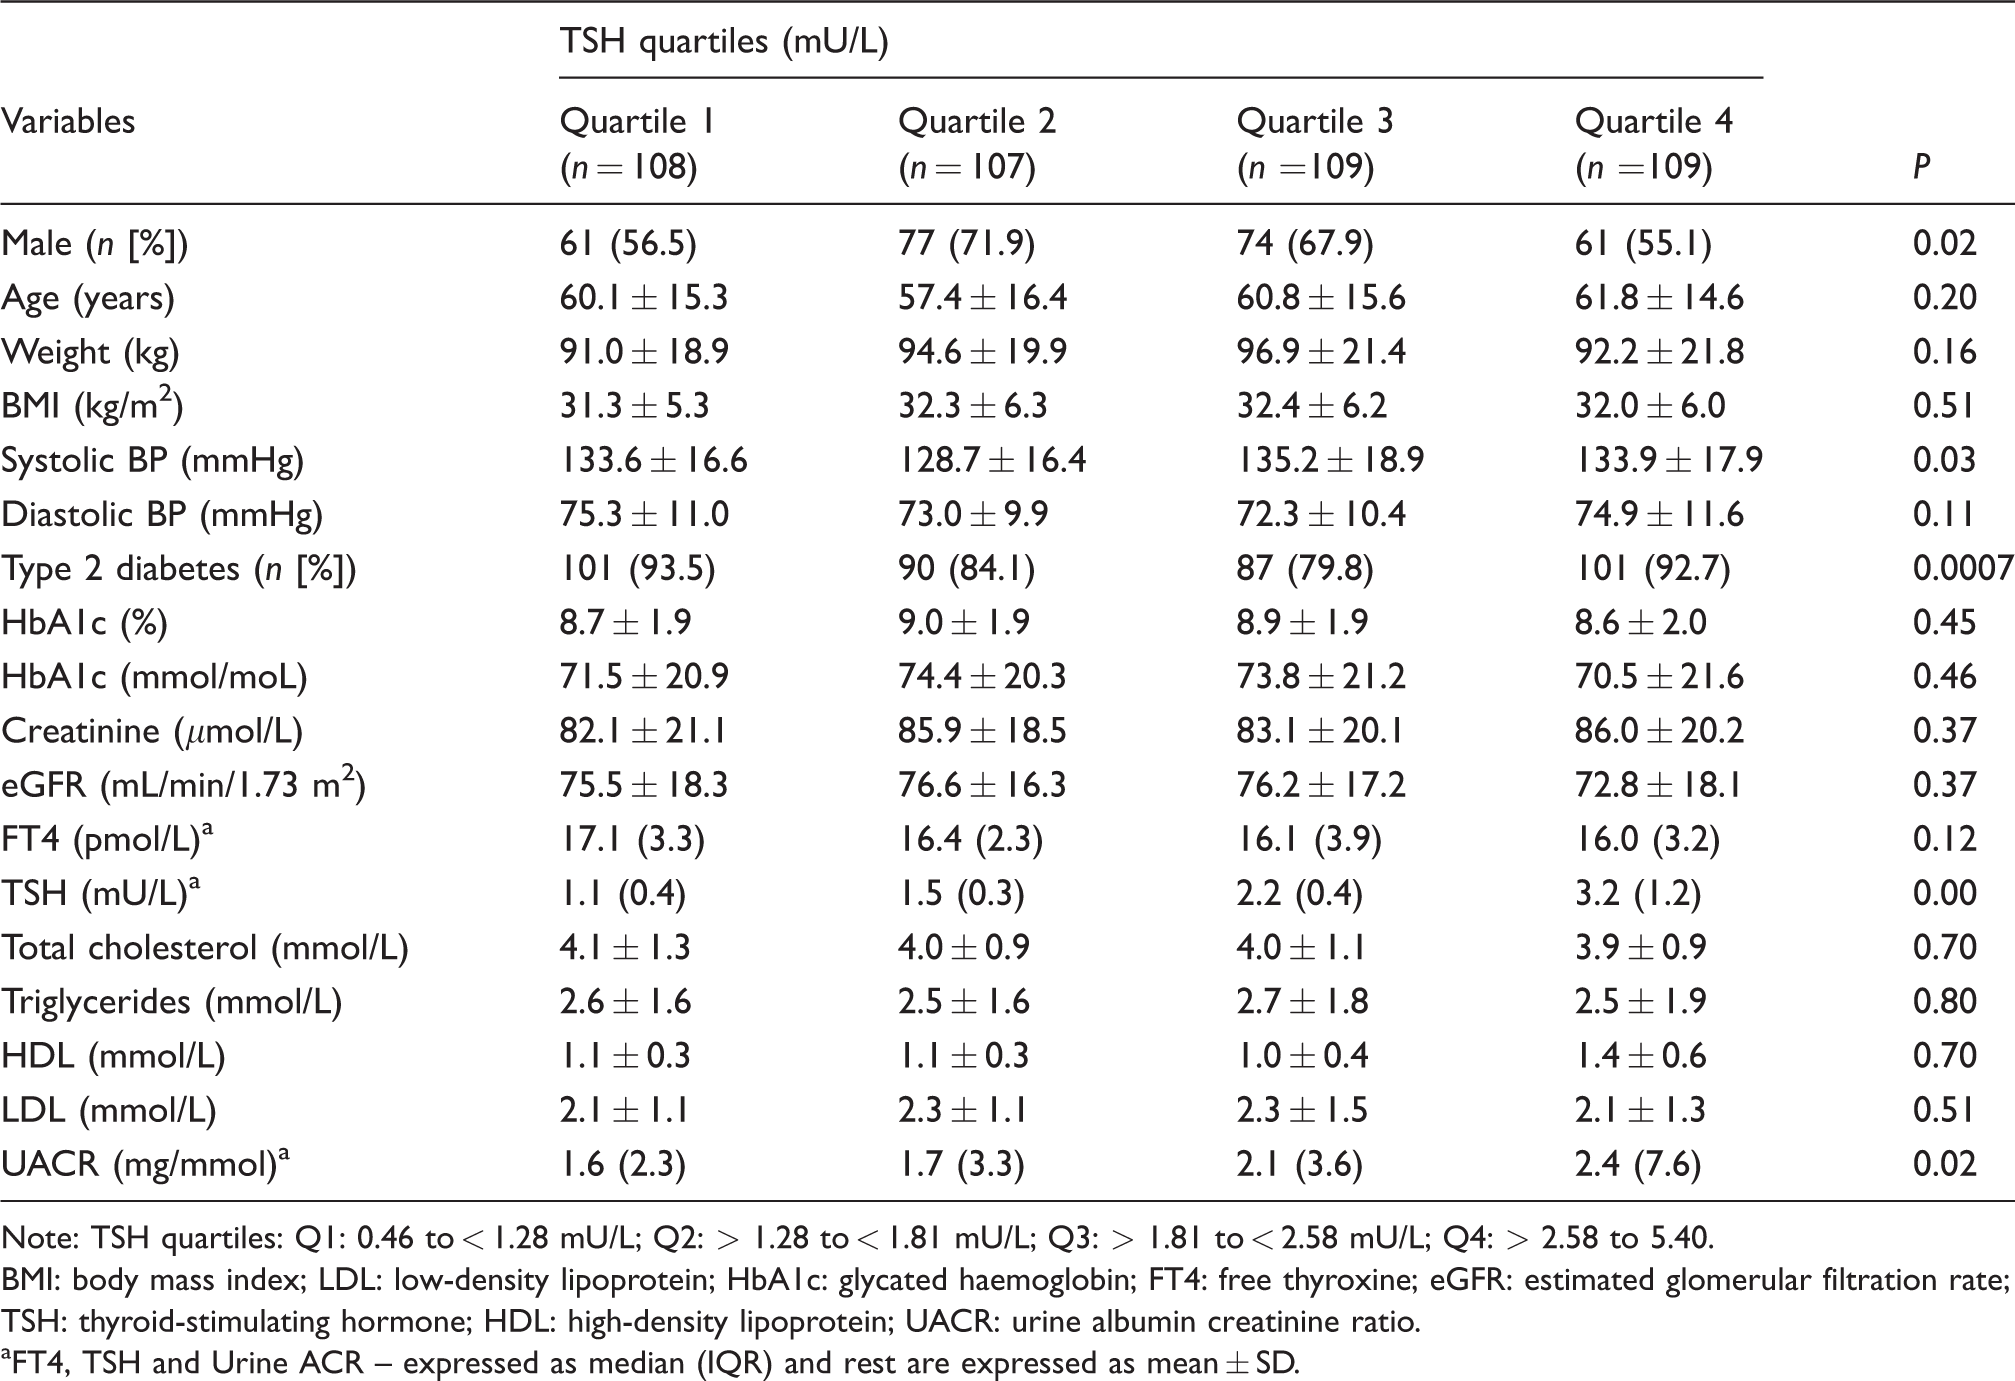
Note: TSH quartiles: Q1: 0.46 to < 1.28 mU/L; Q2: > 1.28 to < 1.81 mU/L; Q3: > 1.81 to < 2.58 mU/L; Q4: > 2.58 to 5.40.
BMI: body mass index; LDL: low-density lipoprotein; HbA1c: glycated haemoglobin; FT4: free thyroxine; eGFR: estimated glomerular filtration rate; TSH: thyroid-stimulating hormone; HDL: high-density lipoprotein; UACR: urine albumin creatinine ratio.
aFT4, TSH and Urine ACR – expressed as median (IQR) and rest are expressed as mean ± SD.
Prevalence of microalbuminuria in different TSH concentrations
The prevalence of microalbuminuria was different in the TSH quartiles. From the lowest quartile of TSH across to the highest one, the prevalence of microalbuminuria increased from 26.9% to 34.6%, 38.5% and 44.9%, respectively (P for trend = 0.02) (Figure 2). In comparison to the highest TSH quartile, UACR in the second and lowest TSH quartiles showed a significant decrease (P = 0.03 and 0.005, respectively), but the difference in UACR between third and highest quartile was not statistically significant (P = 0.16).
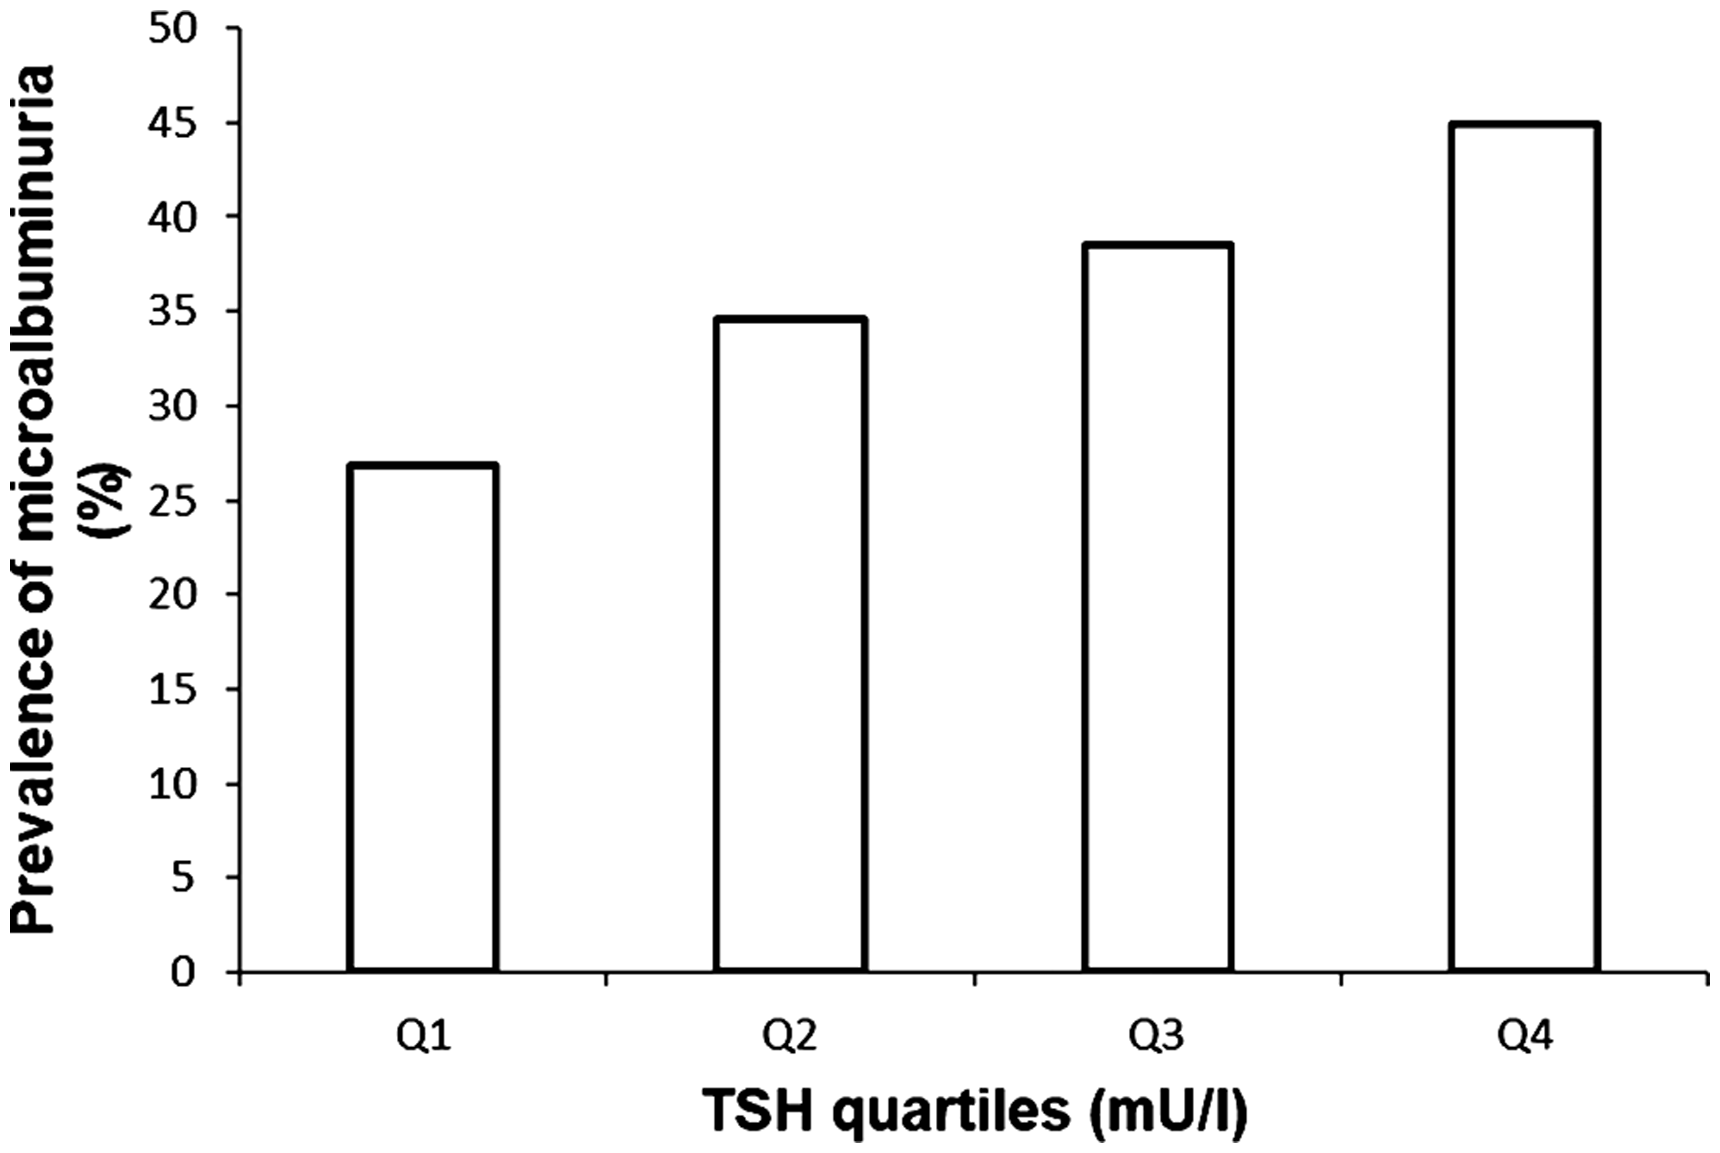
Prevalence of microalbuminuria in different TSH quartiles. Quartile 1 (Q1, n = 29), 0.46 to <1.28 mU/L; Quartile 2 (Q2, n = 37), 1.28 to < 1.81 mU/L; Quartile 3 (Q3, n = 42), 1.81 to < 2.58 mU/L; Quartile 4 (Q4, n = 49), 2.58 to < 5.50 mU/L. Q4 vs. Q3, P = 0.16; Q4 vs. Q2, P = 0.03; Q4 vs. Q1, P = 0.005; P trend = 0.02.
Association between TSH and microalbuminuria
In the logistic regression model, the risk of microalbuminuria increased across TSH quartiles. The OR for the highest TSH quartile compared with the lowest quartile was 1.98 (95% CI [1.12–3.49]; P = 0.01), while those in the second and third quartile were also more likely to have microalbuminuria although this did not reach significance (OR–1.48, 95% CI [0.83–2.65]; P = 0.17) and (OR–1.58, 95% CI [0.89–2.80]; P = 0.11). We used two different models to adjust for potential confounding factors. In Model 2 (Table 3), we adjusted for age, sex, BMI and type of diabetes, and a logistic regression analysis showed similar association that the patients in the second, third and highest quartiles had a trend towards having microalbuminuria compared to those in the lowest quartile (adjusted OR 1.45, 95% CI [0.8–2.63]; P = 0.21), (adjusted OR 1.56, 95%CI [0.86–2.81]; P = 0.13) and (adjusted OR 1.95, 95% CI [1.09–3.48]; P = 0.02), respectively with a statistically significant P for trend = 0.03. In Model 3, we adjusted for age, sex, BMI, type of diabetes, SBP, FT4 and high lipids and the association remained similar. In the adjusted models, patients again were more likely to develop microalbuminuria when their TSH was in the highest quartile in comparison to the lowest quartile (adjusted OR 2.06, 95% CI [1.14–3.72]; P = 0.01), and the trend was identical in the second (adjusted OR 1.67, 95% CI [0.91–3.07]; P = 0.09) and in the third quartile (adjusted OR 1.67, 95% CI [0.92–3.05]; P = 0.09) with the test for trend being statistically significant (P for trend = 0.02). We also performed a simple and multivariate adjusted linear regression analyses and found TSH concentrations to be positively and significantly associated with UACR (β = 0.007, t = 2.03 and P = 0.04).
The risk of microalbuminuria according to TSH quartiles.
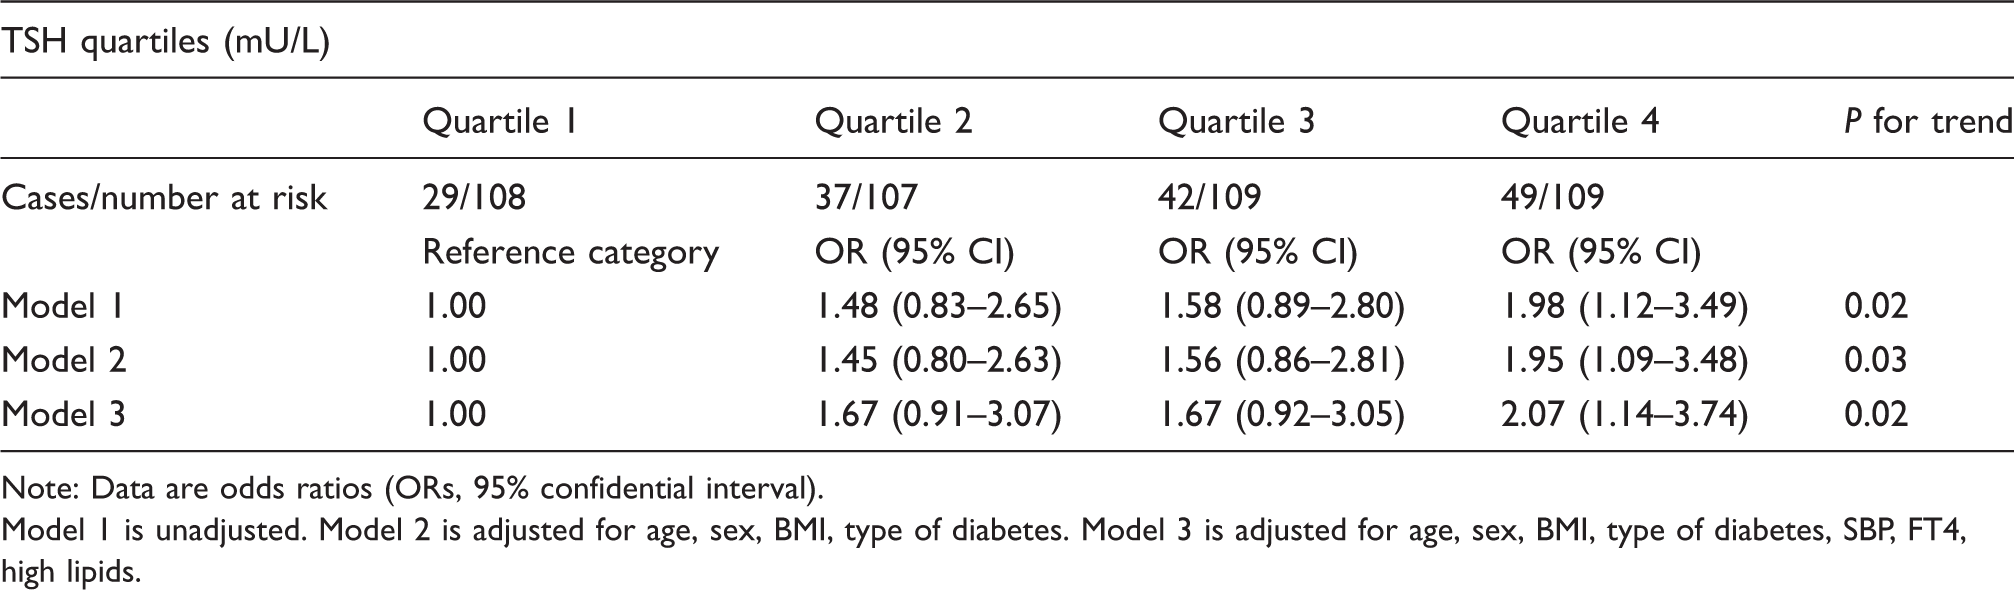
Note: Data are odds ratios (ORs, 95% confidential interval).
Model 1 is unadjusted. Model 2 is adjusted for age, sex, BMI, type of diabetes. Model 3 is adjusted for age, sex, BMI, type of diabetes, SBP, FT4, high lipids.
We also performed stratified analyses for multivariate adjusted OR of microalbuminuria with each 1 SD increment in log TSH concentration in different subgroups (Table 4) and we found that the associations between microalbuminuria and TSH were not consistent. We observed positive and significant association between TSH and microalbuminuria in the following subgroups of different strata: female population, age < 65 years, BMI ≥ 25 kg/m2, patients with hypertension, type 2 diabetes and patients with dyslipidaemia. We did not observe any significant association in the remaining subgroups of different strata. The interactions between TSH and the risk factors were only significant in the age category (P = 0.02) (Table 4).
Adjusted odds ratio (OR) for each 1 SD increase in log TSH concentration associated with the risk of microalbuminuria.
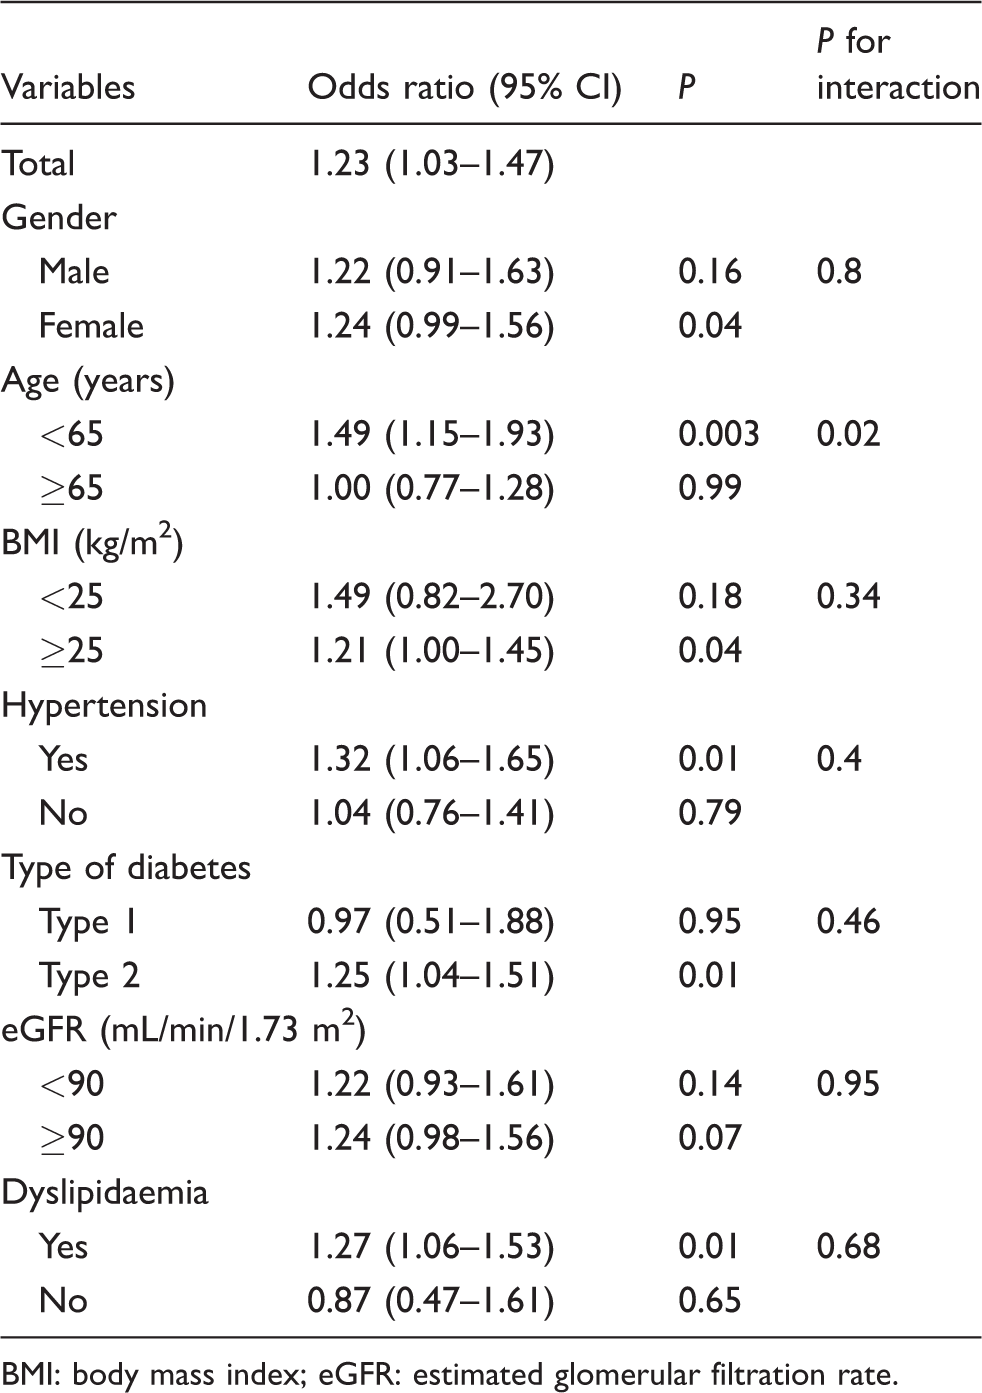
BMI: body mass index; eGFR: estimated glomerular filtration rate.
Discussion
In the present study, we clearly demonstrated that high serum TSH, even within reference range is associated with increased UAE in patients with diabetes. We also observed, that with incremental rise in TSH, the risk of microalbuminuria is higher when patients are younger (<65 years) and have features of metabolic syndrome (MetS) like type 2 diabetes, raised BMI, hypertension and dyslipidaemia. Our findings echoes with the observations made by Zhou et al. who established a similar but inverse relationship between FT3 and microalbuminuria in a normoglycaemic euthyroid Chinese cohort and also found that participants with microalbuminuria were more likely to have higher BMI, SBP and DBP, and higher concentrations of fasting and postprandial glucose, total cholesterol and CRP. 17 Similarly, Wu et al. established an inverse association between serum FT3 concentrations and DN in euthyroid patients with type 2 diabetes which was independent of traditional risk factors. 18 Authors have also reported association between SCH and microalbuminuria in prediabetic subjects, 20 and in patients with type 2 diabetes where SCH was independently associated with prevalence of microalbuminuria 21 and high risk of DN.24,25 In patients with type 1 diabetes, Rodacki et al. 26 found that patients with high normal TSH concentrations (2.5–4.4 mU/L) and SCH (TSH ≥ 4.5 mU/L) had a greater risk of renal failure as compared with patients with low normal TSH concentrations (0.4–2.5 mU/L). To our knowledge, no studies have reported the association between serum TSH and albumin excretion in euthyroid patients with either type 1 or 2 diabetes as yet.
The exact mechanisms for a positive independent association between serum TSH and microalbuminuria are not defined very well. Thyroid hormones play an important role in the growth, development and physiology of kidneys, 27 and crucially it also exerts significant effect on vascular and endothelial functions. 28 Alteration in thyroid function causes changes in RBF, GFR, tubular secretory and absorptive capacity, electrolyte pumps and structure of glomerular barrier, 19 which may significantly influence renal handling of albumin and related proteins. Serum TSH have been shown to be an independent factor for determining renal function and CKD in normoglycaemic euthyroid subjects,19,29 whereas others have found that serum TSH concentrations in the upper reference range are also associated with impaired endothelial function measured through flow-mediated dilation. 30 Endothelial dysfunction have been reported in patients with Hashimoto’s thyroiditis 31 and patients with SCH have been also identified with endothelial dysfunction characterized by reduced endothelium-dependent vasodilatation and impaired nitric oxide availability which is partially independent of dyslipidaemia and can be reversed through levothyroxine replacement. 10 As microalbuminuria is well recognized in diabetes and usually represents endothelial dysfunction, 32 endothelial dysfunction could be a possible link between higher concentration of TSH and albuminuria. Whether high concentrations of TSH still within the euthyroid range can contribute to increase in systemic vascular resistance and arterial stiffness needs to be confirmed by experimental studies but such trends have been already noted in patients with SCH.10,30
Thyroid function has a substantial impact on glucose and lipid metabolism and has been linked to components of insulin resistance (fasting insulin and HOMA-IR). 33 Insulin resistance, in fact, underpins MetS 34 and both have been strongly linked to microalbuminuria.35,36 Our observation suggest that elevated TSH in euthyroid range can increase risk of microalbuminuria in patients with components of MetS (manifested by type 2 diabetes, raised BMI, hypertension and dyslipidaemia) and similar links have been also observed by others where strong association have been found between components of MetS with low normal thyroid function (euthyroid state) 33 and in patients with subclinical thyroid disease. 37 We also showed that the risk of microalbuminuria was higher if patients were younger (<65 years) and females and the reasons for such increased risk in these groups will require further exploration.
Our study has limitations. First, it has a cross-sectional design which does not establish a causal relationship between TSH and microalbuminuria; hence, prospective, longitudinal studies are needed to clarify this relationship. Second, duration of diabetes and medications like metformin and SGLT2 (sodium glucose transporter 2) inhibitors can potentially influence UAE, but these were not included for statistical analysis due to lack of reliable information for all patients. Third, we also did not have information about smoking status of individual patients which may impact on thyroid function, kidney function and UAE and may be a key confounder. Finally, we did not include thyroid autoantibody status in our assessment as antithyroperoxidase antibody might be responsible for endothelial dysfunction and subsequent microalbuminuria in euthyroid patients with Hashimoto’s disease as reported by other authors. 31 However, our study offers new insights into the relationship between early stage kidney disease and variations in thyroid function within the reference range in patients with diabetes. By evaluating patients without thyroid dysfunction, we have eliminated the confounding effect of treatment with thyroid hormones. Furthermore, stratified analysis reveals a stronger relationship between TSH and microalbuminuria in patients with components of MetS. Thus, taken together with data from patients with SCH, it would be of interest in future studies to investigate whether lowering TSH with thyroxine, at least in patients with SCH, would slow development and progression of microalbuminuria in patients with diabetes.
Conclusion
In summary, our study shows an association between microalbuminuria, a surrogate marker of endothelial dysfunction and serum TSH in a euthyroid diabetic population. Our findings suggest that high TSH, even within the euthyroid range, could be an additional risk factor for microalbuminuria beyond the traditional risk factors in diabetic subjects. Further studies are needed to explore the clinical implications of this relationship.
Footnotes
Declaration of conflicting interests
The authors declared no potential conflicts of interest with respect to the research, authorship, and/or publication of this article.
Funding
The authors received no financial support for the research, authorship, and/or publication of this article.
Ethical approval
The study was approved by the Research and Development department of Cwm Taf University Health board (approval no: CT/580/15).
Guarantor
GD.
Contributorship
GD and OO conceived the article. GD, HA, AA and OO were involved in collection of data. JG and BPT were involved with biochemical analysis. GD, PNT and OO analysed the data and researched the literature. GD wrote the first draft of the article which was modified and edited at different stages by PNT, JG and OO. All authors reviewed and approved the final version of the manuscript.