
Abstract
Background
Urinary dopamine, homovanillic acid and 4-hydroxy-3-methoxymandelic acid are established tests for diagnosis and monitoring of neuroblastic disease. We compared the diagnostic performance of total urinary 3-methoxytyramine, the O-methylated product of dopamine, to these three established tumour markers.
Methods
Urinary 3-methoxytyramine, dopamine, homovanillic acid and 4-hydroxy-3-methoxymandelic acid were measured by high-performance liquid chromatography with electrochemical detection on consecutive urine samples from histologically proven neuroblastic patients and controls. Patients with neuroblastic disease were further classified as untreated, advancing, residual or absent disease based on clinical and radiological criteria. Receiver operating characteristic curve analysis was used to compare the diagnostic performance of the four tumour markers.
Results
Urinary 3-methoxytyramine was well correlated with established tumour markers and its concentration correlated with disease activity. It was the most commonly elevated tumour marker in neuroblastic disease and showed similar sensitivity to dopamine and homovanillic acid. The diagnostic utility of urinary 3-methoxytyramine as measured by area under the receiver operating characteristic curve was similar to dopamine and homovanillic acid.
Conclusion
Our results support the use of urinary 3-methoxytyramine as a tumour marker in the diagnosis and the monitoring of neuroblastoma disease.
Introduction
Neuroblastic (NB) disease is a neoplasm of the neural crest cells which retain the ability to produce catecholamines and their metabolites. This disease encompasses a spectrum of tumours of different maturity with varying clinical outcomes; the most commonly encountered is neuroblastoma which is also the most aggressive. In contrast, ganglioneuroblastoma and ganglioneuroma are spontaneous or treatment-induced tumours with less malignant potential. Ganglioneuroma, the most mature tumour on the spectrum, accounts for 1–5% of NB disease and is not associated with tumour-related deaths.1,2 NB disease accounts for 7.8% of all childhood cancers and is the most common form of malignancy in infancy. 3 The diagnosis of NB disease is complicated by a broad spectrum of symptoms and more than half of patients will have metastatic disease at time of diagnosis.4–7 While the five-year mortality rate for patients with neuroblastoma has improved from 35% in 1975–1984 to 78% in 2005–2011, the five-year overall survival rate from progression/relapse remains poor at 20%.3,8,9 Catecholamines and their metabolites including urinary dopamine (DA), homovanillic acid (HVA) and 4-hydroxy-3-methoxymandelic acid (HMMA) are established tests that are used for two purposes: to support the diagnosis of NB disease and to monitor disease activity following treatment. It is therefore important that the diagnostic performance of any new tumour marker is evaluated for both diagnosis and monitoring.
Both free and total 3-methoxytyramine (MTY), the O-methylated product of dopamine, have previously been studied as potential markers of neuroblastoma.10–13 O-methylated products of epinephrine (metanephrine) and norepinephrine (normetanephrine) have demonstrated diagnostic superiority compared with their catecholamine counterparts in the diagnosis of phaeochromocytoma and paragangliomas; and because of this have been recommended as first line biochemical tests for these tumours.14,15 Plasma MTY has been demonstrated as the most commonly elevated catecholamine-related tumour marker in patients with head and neck paragangliomas.16,17 In NB disease, the diagnostic utility of catecholamine-related tumour markers correlates with the stage of disease and the combination of multiple tumour markers significantly improves diagnostic utility, achieving an overall sensitivity of 80–90% and specificity of >95%.5,6
There is currently no published direct comparison of the diagnostic utility of urinary total MTY with all three conventional urinary markers in the monitoring of NB disease. In the present study, we have compared the diagnostic performance of all four biomarkers in consecutive patients being investigated for NB disease and those being monitored for recurrence.
Materials and methods
Patient recruitment
Urinary MTY, DA, HVA and HMMA were measured in all patients being investigated for suspected NB disease or followed up for histologically proven disease between December 2013 and September 2015, yielding a total of 338 consecutive urinary samples from 194 patients. As our laboratory provides the only service for these analytes for the upper half of the North Island of New Zealand, we included patients in both inpatient and outpatient settings and the patient mix is likely to be typical for many routine diagnostic laboratories. No advice was given to patients with regard to withdrawal of medications or dietary restrictions prior to testing. Results for 24-h urine samples (33 samples) were combined with random urine samples (305 samples), biomarkers being expressed as creatinine ratios in both types of sample.
Results from patients were excluded where (a) all four tumour markers could not be performed on the urine sample as a result of insufficient or unsuitable sample (27 samples), (b) the diagnosis was unclear at the time of data collection (four samples), (c) the sample had been taken in patients with extreme stress or interfering medications, e.g. an intensive care setting, dopamine infusion or active psychosis on antipsychotics (five samples), (d) the urine sample was very dilute (creatinine <0.2 mmol/L) (one sample), (e) the patient was older than 15 years (three samples) or (f) a diagnosis of phaeochromocytoma was determined on histology (four samples).
Following exclusion criteria, 294 urine samples from 170 patients were available for study (Figure 1).
Classification of urine samples according to clinical disease status.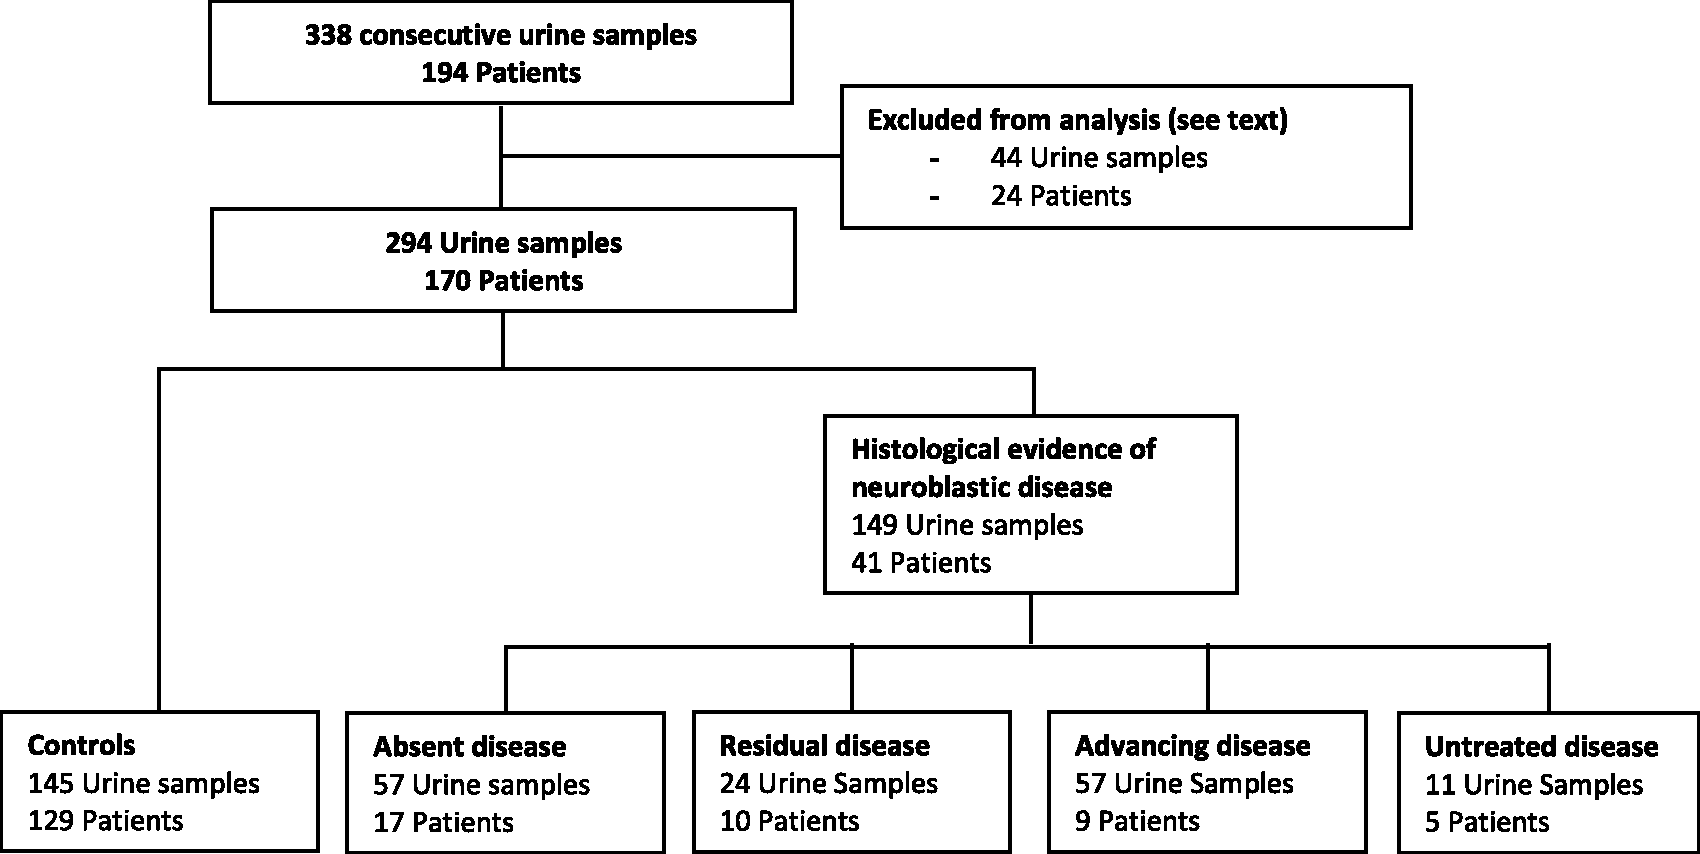
Classification of patients in relation to clinical findings
Clinical documentation of each patient was reviewed retrospectively. This included radiology reports, clinic letters, histology reports and minutes from multidisciplinary meetings. Patients were classified into five groups as follows: (1) no histological or other evidence of neuroblastoma (hereafter termed ‘controls’); (2) patients with histologically proven NB disease who had completed treatment with no radiological evidence of residual disease (‘absent disease’); (3) patients with histologically proven NB disease who had completed treatment, with radiological evidence of residual disease that was not reported to be increasing in size (‘residual disease’); (4) patients with histologically proven NB disease who had received treatment but had radiological evidence of progressive disease, or patients undergoing any active treatment (‘advancing disease’); (5) patients with histologically proven NB disease where tumour marker measurements were performed prior to treatment (‘untreated disease’). In cases where biomarker levels were rapidly fluctuating with active clinical management, the earliest set of biomarkers available was used to calculate the overall diagnostic performance.
Results for DA, HVA and HMMA but not MTY were reported to clinicians. The study received institutional approval from the Auckland District Health Board (A + 6619) and was exempted from further review by the New Zealand Health and Disability Ethics Committees.
Laboratory methods
Total urine MTY was measured using Clinrep® Metanephrines in Urine kitset (Recipe® Chemicals and Instruments GmBH, Munich, Germany). Acid hydrolysis of conjugated MTY was performed by heating acidified urine (pH 0.5–1.0) at 100℃ for 30 min with methoxyhydroxybenzylamine added as an internal standard prior to extraction. Detection was by coulometry at +450 mV on a Coulochem III (Thermo Scientific). This method was tested to a linear range up to 10,000 nmol/L with absolute analytical recovery 70–80% and LOQ of 5 nmol/L (CV > 20%). Patients on dopamine or antipsychotics which may affect dopamine secretion were excluded. Free DA was measured by reverse phase ion-pair HPLC with coulometric detection following extraction using a weak cationic exchange column. 18 HMMA and HVA were measured by reverse phase HPLC with amperometric detection following extraction on a strong anion exchange column. 19 Interbatch analytical imprecision expressed as coefficients of variation for typical reported ranges were 5.5%, 7.5%, 6% and 5% for DA, HVA, HMMA and MTY, respectively. Creatinine was measured by the Roche Jaffé method on a Cobas c702 analyser. All tumour markers were expressed as ratios to creatinine. Our laboratory is accredited by International Accreditation New Zealand and participates in the Royal College of Pathologists of Australasia external quality assurance program for these analytes and the assays performed within acceptable limits.
Statistical analysis
Because all urinary biomarker/creatinine ratios showed a marked dependence on age, the biomarkers were expressed as multiples of median (MoM) for age. For each biomarker, a curve representing the age-related median was determined by fitting an exponential decay curve with the equation:
Comparisons of age and MoMs were determined using the Mann-Whitney U test and correlations between biomarkers were determined using Pearson’s correlation coefficient. Comparisons between the sensitivity of each biomarker were performed using McNemar’s test. The pROC package from the Comprehensive R Archive Network was used to determine receiver operating characteristic (ROC) analysis and 95% confidence intervals by DeLong’s method. The associated 95% confidence intervals for sensitivity and specificity were calculated by bootstrap with 2000 repetitions using the same package. 20 Comparison between areas under the curve (AUC) was determined by DeLong’s test for paired ROC curves. All statistical analyses were carried out on R (version 3.1.1) (R Foundation for Statistical Computing, Vienna, Austria). Results are considered statistically significant when P < 0.05 using a two-tailed assumption.
Results
Correlation of MTY with DA, HVA and HMMA
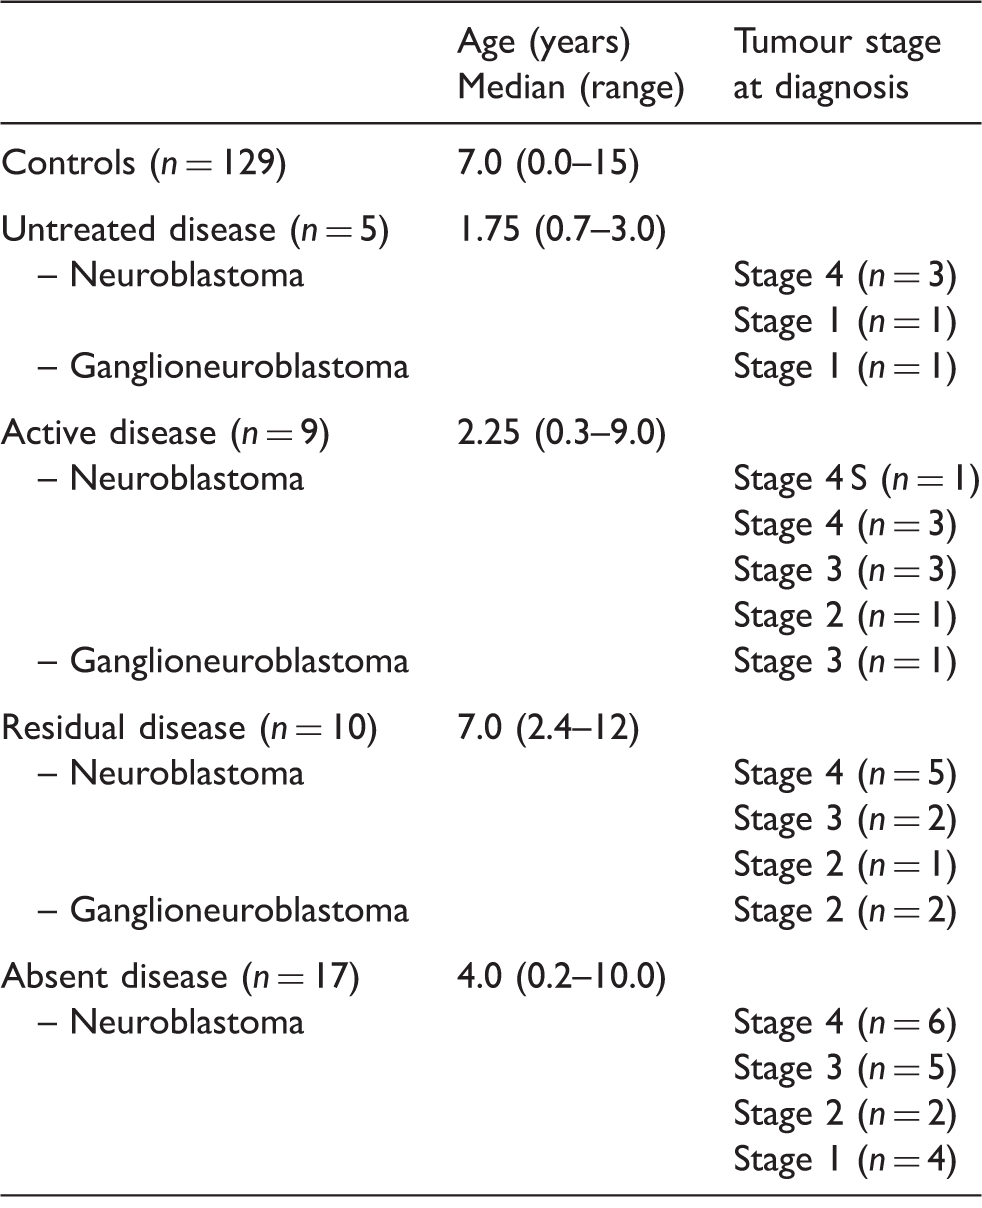
Biomarker levels in controls showed marked age dependence (Figure 2; Supplementary Table 1). Of the 41 patients with NB disease, five patients had samples collected prior to any treatment, while the remaining 36 patients were being monitored for disease activity during or after treatment. For patients with NB disease, the biomarker to creatinine ratios can be found in Supplementary Figure 1. The clinical characteristics of the NB disease subgroups are shown in Table 1.
Variation of tumour markers with age in controls. Clinical characteristics of NB disease patients. Note: Patients were classified into subgroups on clinical criteria as described in Methods. There were no significant differences in age between each subgroup and controls.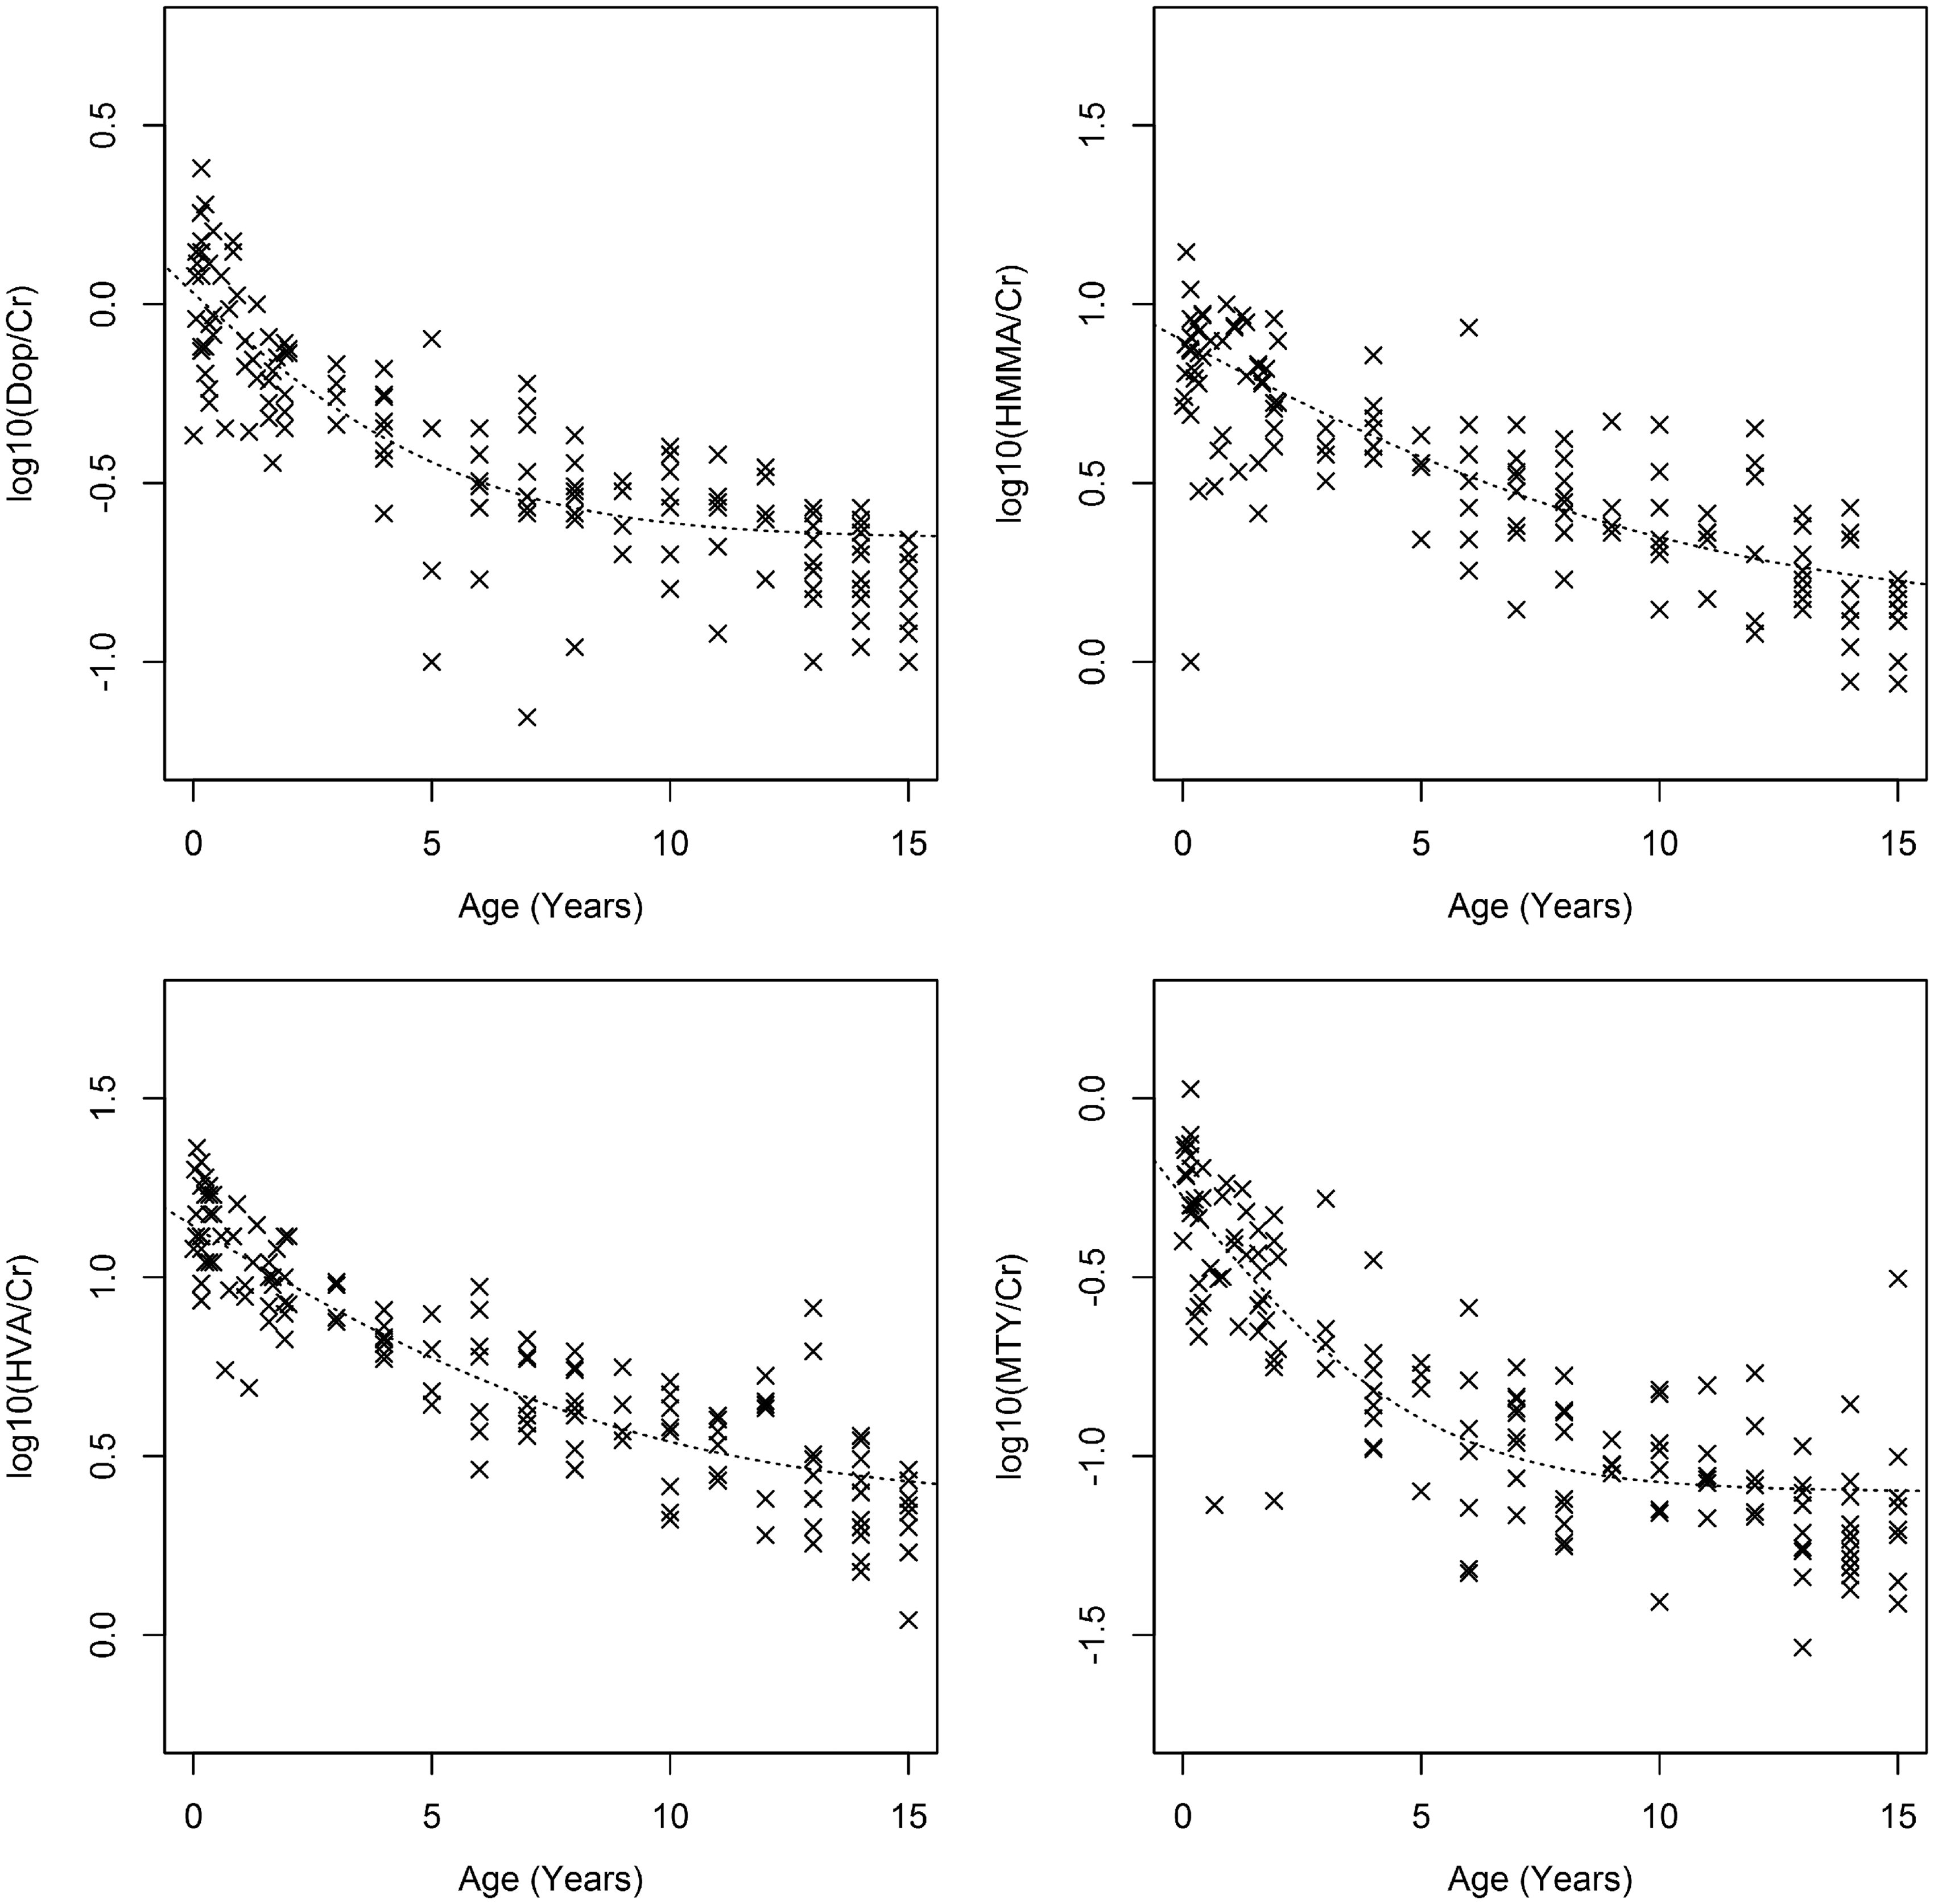
MTY was significantly correlated with DA (r = 0.70), HVA (r = 0.63) and HMMA (r = 0.66) (P < 0.0001 in all cases) in patients with NB disease. Using the 90th percentile of MoM in controls as the decision-making threshold, MTY was elevated in 51%, DA in 39%, HVA in 39% and HMMA in 34% of samples from NB disease patients. The percentages of samples with elevated MTY were significantly higher than that of DA (P = 0.003), HVA (P = 0.010) and HMMA (P < 0.001). These data raised the possibility that MTY is a more sensitive biomarker than conventional tumour markers.
Subgroup analysis and overall diagnostic performance of biomarkers
All untreated patients were symptomatic except one who had a background history of H-RAS mutation, and was found to have an incidental tumour on radiology confirmed as neuroblastoma on histology. Using the 90th percentile of MoM in controls as a decision-making threshold, all untreated patients exhibited elevations in all tumour markers including MTY. The number of untreated patients was not large enough to allow any conclusions as to the superiority of one tumour marker over another in this patient subgroup.
Figure 3 shows the median tumour marker levels in each NB disease subgroup and controls. In NB patients with untreated and advancing disease, median levels of all four tumour markers were significantly elevated (P < 0.001). In patients with residual disease, smaller but statistically significant elevations were observed for DA (P < 0.001), HVA (P < 0.001) and MTY (P = 0.005) but not for HMMA (P = 0.09). In patients with clinically absent disease, small but significant elevations were observed for DA (P < 0.001), HVA (P = 0.005) and MTY (P < 0.001) but not for HMMA (P > 0.05). Median levels of MTY were highest in untreated patients, and the elevation was the smallest in those with absent disease consistent with MTY as a marker of disease activity.
Biomarkers of patients with NB disease in different categories of disease status.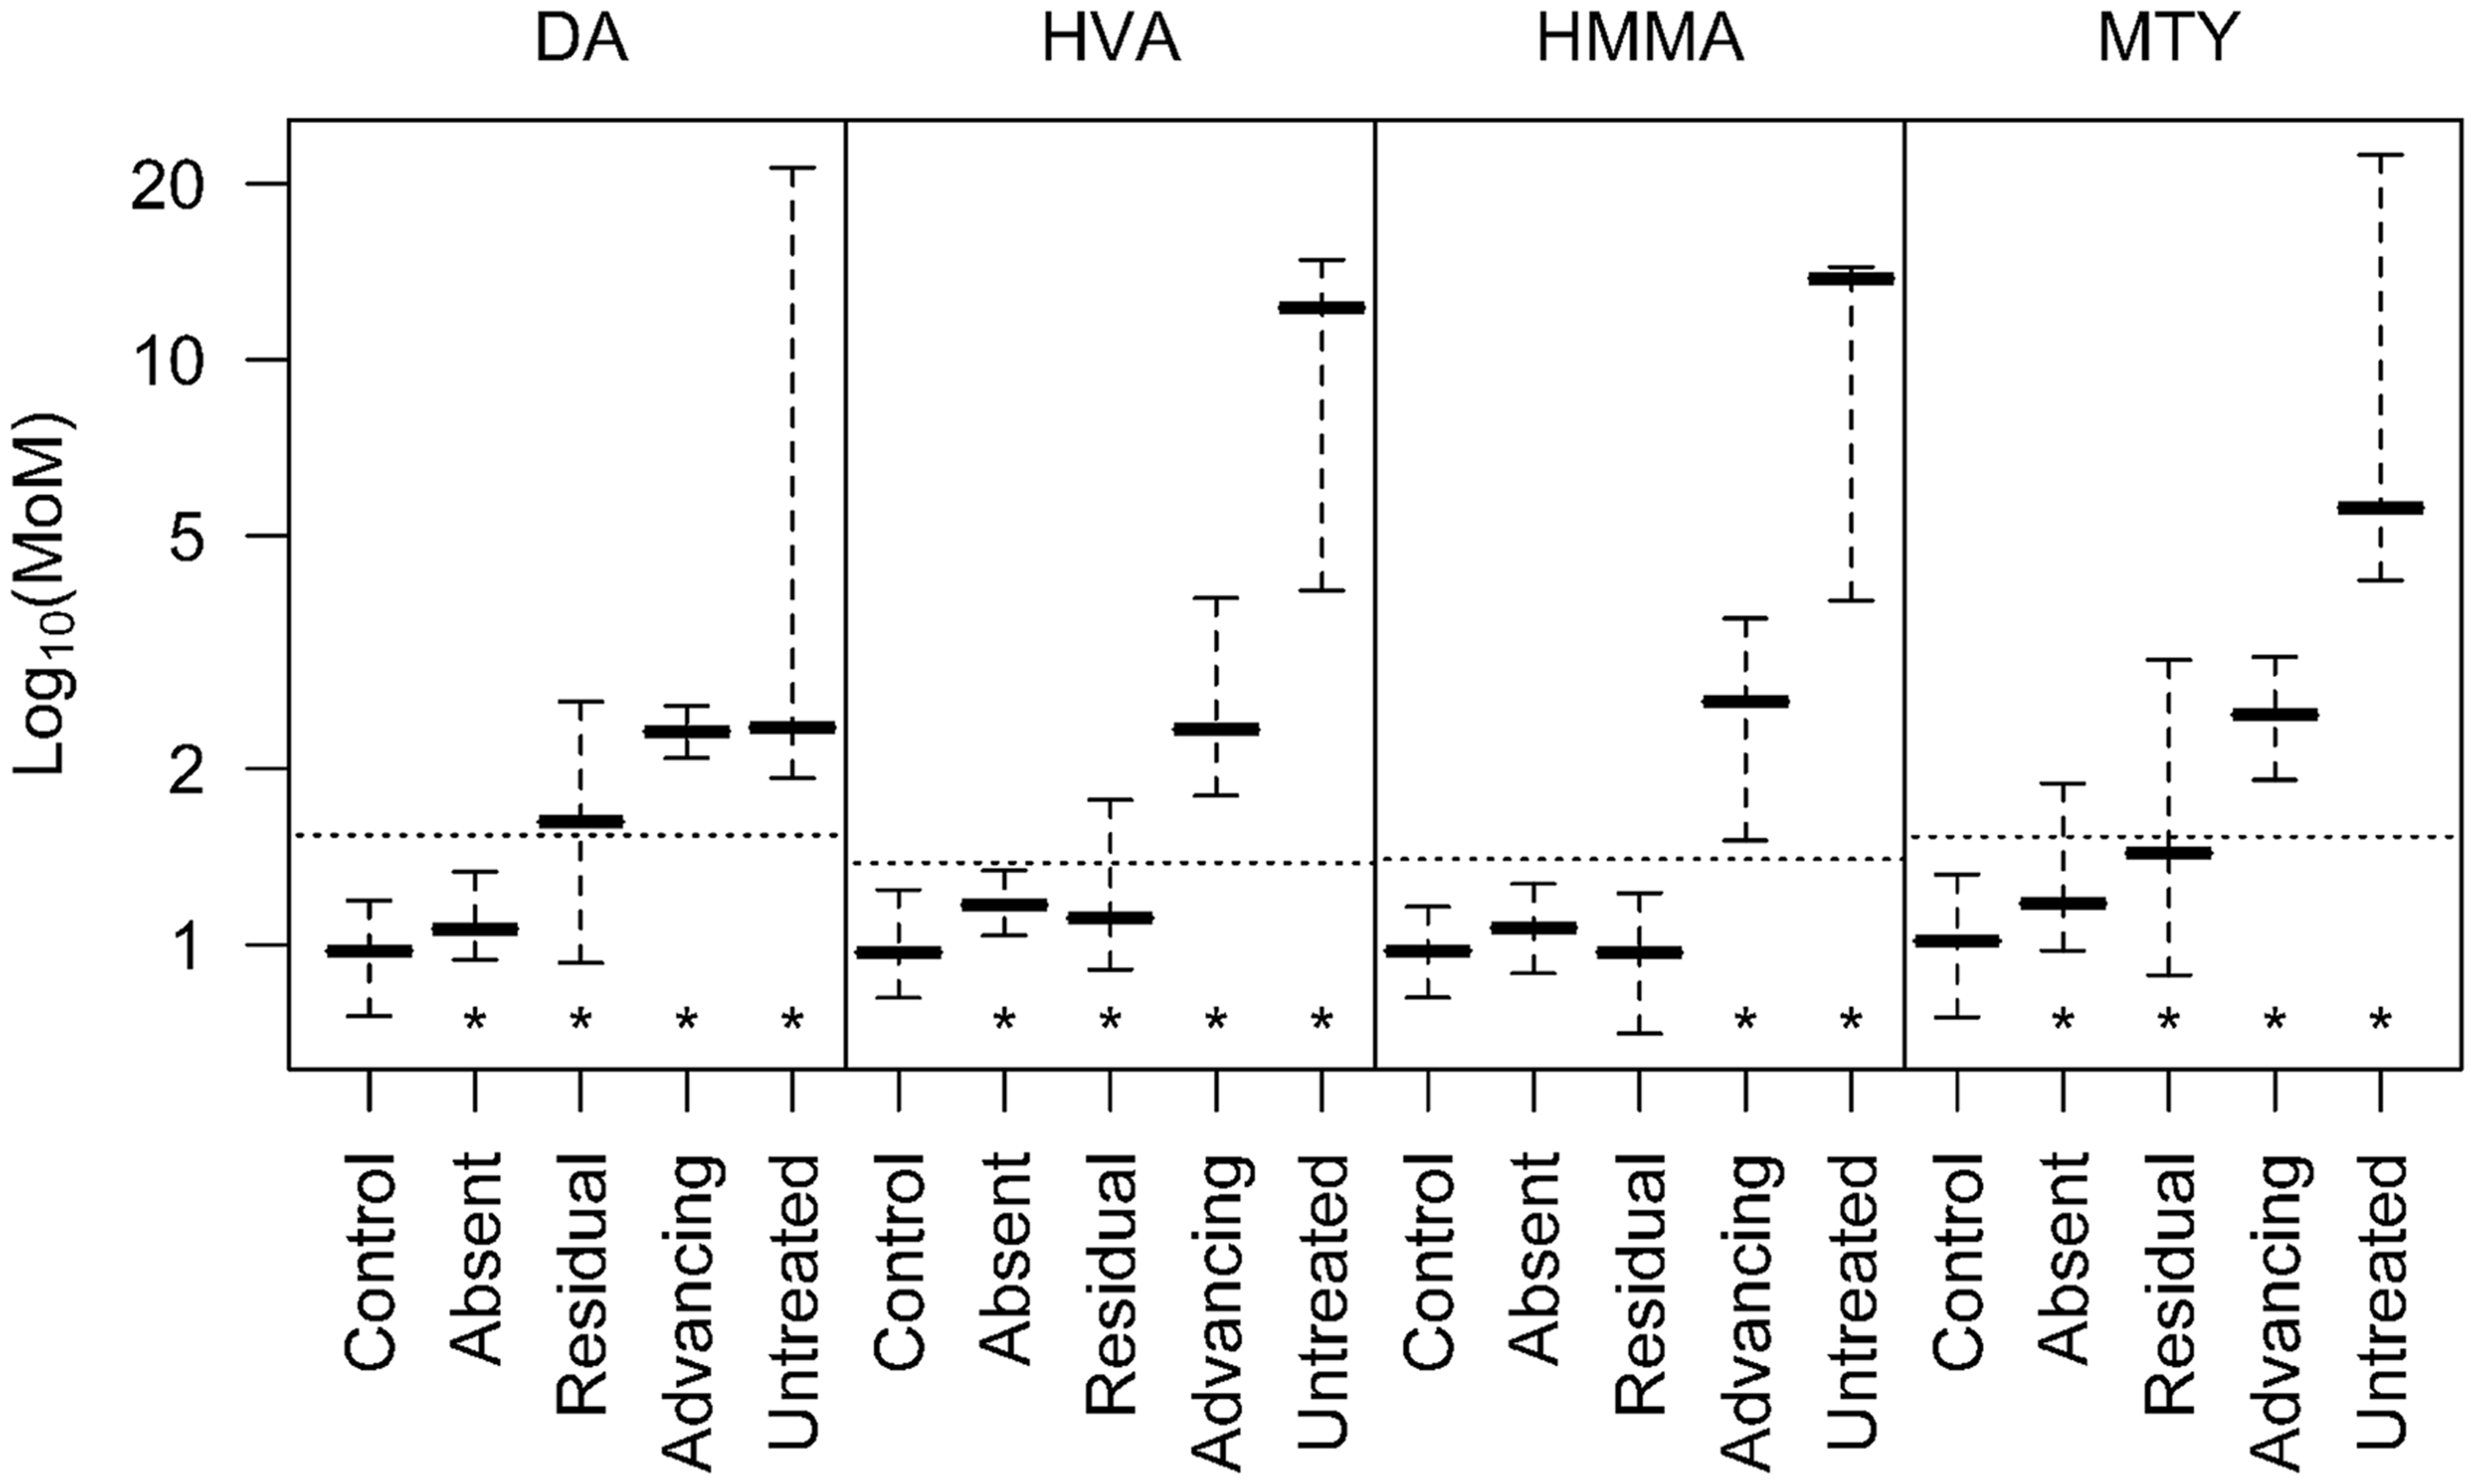
The diagnostic utility of the four tumour markers was compared by constructing ROC curves for each NB disease subgroup compared with controls (Figure 4). For all the biomarkers, diagnostic utility as measured by AUC was highest for untreated patients, followed by those with advancing disease. In patients with residual or clinically absent disease, the AUCs were less impressive. While DA, HVA and MTY achieved diagnostic utility (AUC > 0.5) in patients with residual disease and absent disease, HMMA did not.
ROC curves for paired biomarkers expressed in MoM for age were constructed by comparing NB patients in each subgroup to controls.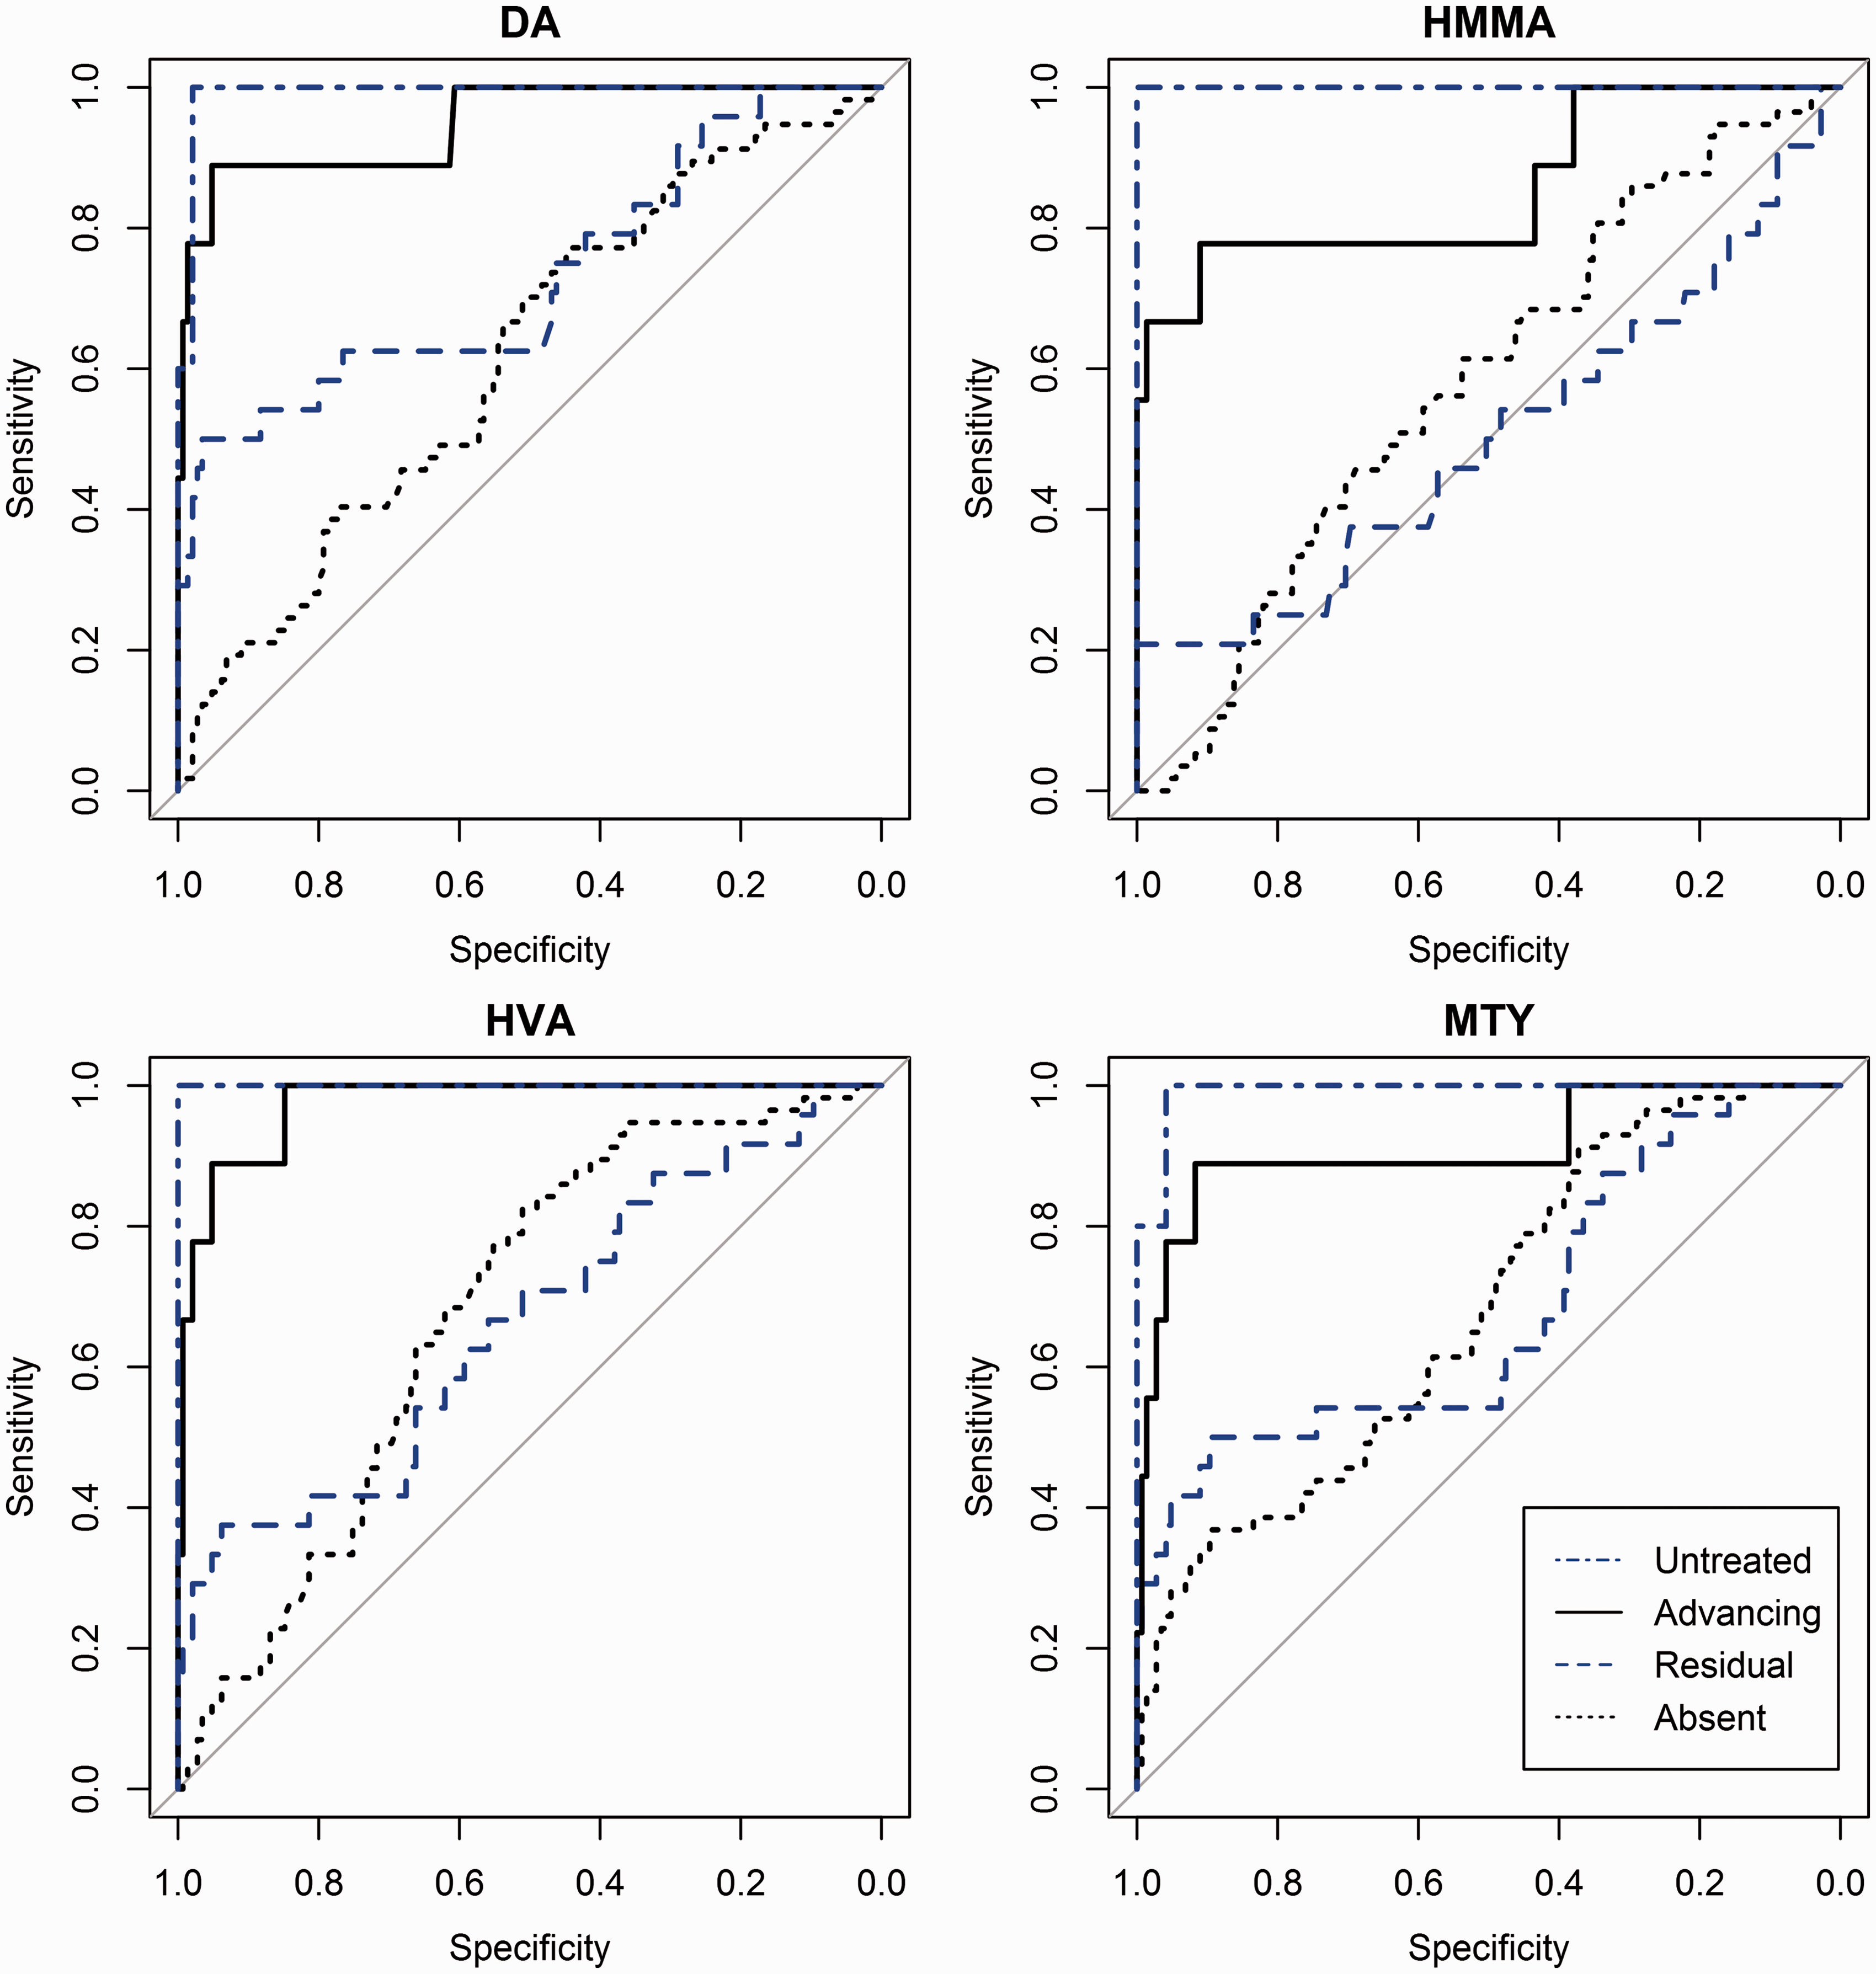
Overall diagnostic performance of the four biomarkers in NB disease.
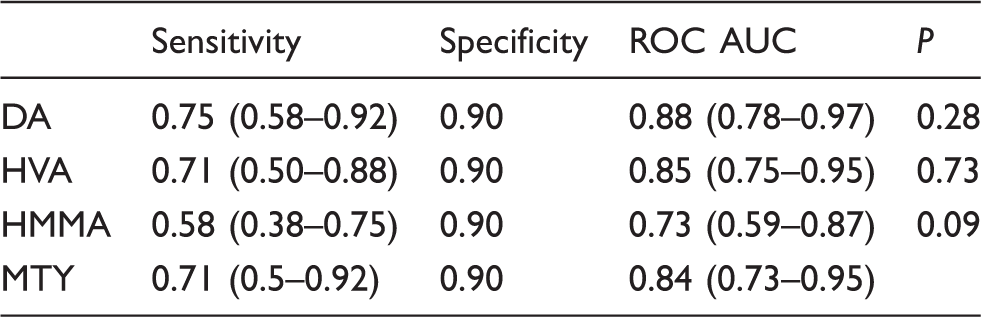
Note: Overall diagnostic performance was calculated by combining the untreated, advancing and residual disease subgroups of NB disease and comparing this group to controls. Sensitivity was computed at a cut-off representing the 90th centile of controls. Figures in brackets show the 95% confidence intervals. AUC comparisons demonstrate no statistical difference between the diagnostic utility of MTY and conventional tumour markers (P values >0.05).
DA: dopamine; MTY: 3-methoxytyramine; HMMA: 4-hydroxy-3-methoxymandelic acid; HVA: homovanillic acid; ROC: receiver operating characteristic; AUC: areas under the curve.
Discussion
In this study, we compared the diagnostic performance of urinary total MTY against three conventional tumour markers in consecutive patients being investigated for suspected NB disease or monitored for proven disease. While most reports only examined catecholamine and related tumour markers collected prior to treatment for the diagnosis of NB disease,5,6 the most common indication for testing in our series was for the monitoring of disease activity in patients with treated NB disease.
We demonstrated correlations between MTY and DA, HVA and HMMA and found that MTY was the most commonly elevated tumour marker in NB patients. MTY was elevated in all patients with untreated NB disease and ROC curve analysis demonstrated that MTY was able to differentiate treated patients with advancing or residual disease from controls. As expected, like the other biomarkers, MTY has a low sensitivity to distinguish treated patients with radiologically absent disease from controls. The ROC curve analyses indicate that MTY has similar diagnostic performance to DA and HVA. Taken together, our results support the use of MTY in both the diagnosis and monitoring of NB disease.
The strengths of the present study included the availability of full clinical information to allow accurate clinical classification of patients and measurement of all four biomarkers on the same sample, allowing direct comparisons of their diagnostic performance, thereby avoiding bias or data distortions due to differences in patient or control populations. In addition, the use of unselected consecutive samples from all patients being investigated for suspected NB disease or monitored for proven disease avoids selection bias and ensures that both the patient and control groups are representative of the mix of patients likely to be tested in routine laboratories. The blinding of MTY results to clinicians allows for a fair comparison with the other tumour markers examined and avoids reporting bias in the setting of increased positive MTY results. ROC curve analysis is a powerful method for evaluating tests as it compares test performance across the entire range of possible diagnostic cut-off points, thereby maximizing the extraction of useful information from the data. However, ROC curve analysis is problematic where the analyte(s) show a marked age dependence, because abnormal values for one age group overlap with reference values for another age group. We overcame this by expressing all the biomarkers as MoM for age. This allowed the use of data across all ages to be combined in a single ROC curve analysis.
Our results are consistent with previous studies. Candito et al compared all four urine biomarkers in 18 patients with NB disease prior to treatment. 13 However, their evaluation was limited to comparing the sensitivities at a single cut-off point, and they did not include treated patients. Monsaingeon et al. 11 compared all four tumour markers with ROC analysis; however, the overall clinical utility of each biomarker could not be determined in their evaluation of 29 untreated patients following subsequent stratification of patients into four age groups. Urinary free MTY, although theoretically increases clinical sensitivity by the removal of gastro-enteric source of conjugated MTY, is analytically challenging, and evidence for diagnostic utility in the clinical setting is currently limited. 10 Similarly, plasma MTY has been suggested as a promising biomarker in the diagnosis of neuroblastoma; however, the need of blood testing in young children may limit the clinical utility. 21 Our findings support MTY as a biomarker in patients with untreated disease and warrants further comparative studies between total and free MTY in urine and serum.
The current guidelines for complete remission or very good partial response require catecholamine tumour markers to be within the reference range. 22 Despite increasing prognostic evidence for the detection of minimal residual disease by bone marrow nucleic acid marker panels, the use of catecholamine-related tumour markers in the monitoring of disease are limited to small case series. 23 Our findings indicate at every cut-off point, the sensitivity and specificity of individual tumour markers are lower following treatment. This observation parallels previous description of reduced sensitivity of HVA and HMMA in the detection of neuroblastoma relapse. 24 In contrast to previous studies which demonstrate the superiority of imaging techniques compared with tumour markers,24,25 our study demonstrates a small but statistically significant increase in diagnostic utility for DA and HVA in patients with radiologically absent disease. While at commonly used cut-off points >90th percentile, the sensitivity is less than 10% for DA and HVA, the sensitivity of MTY was the highest ∼20–30%. Although we were unable to identify any statistical significance between MTY, DA and HVA, this is reminiscent of increased clinical sensitivity in the transition to O-methylated products observed for phaeochromocytomas.14,15 Although further studies are warranted, our findings suggest that MTY may be a more sensitive marker in instances where conventional tumour markers are not elevated.
In this study, HMMA had significantly lower diagnostic utility in patients treated for neuroblastoma compared with other tumour markers examined. One possibility for this observation is the maturation of neuroblastoma with treatment which is associated with a change in catecholamine profile.12,26 Consistent with this hypothesis is the significantly lowered sensitivity of HVA and HMMA encountered in patients with untreated ganglioneuromas where elevations are observed in only one-third of cases. 27 Changes in nucleic acid tumour marker patterns have also been observed in patients with relapse and treatment. 23 While HVA and HMMA are as sensitive as DA in the detection of untreated neuroblastoma,6,21,28 our data suggest patients with residual disease may benefit from monitoring with DA and MTY.
The limitations of our study include the absence of non-secretory NB disease patients. Although our study design is based on consecutive urinary samples, patients with non-secretory NB disease may not have been monitored with tumour marker levels. It is also likely patients with residual disease have been over represented in our study, as these patients are often followed up in the outpatient setting for a longer period. In the monitoring of patients, individual cut-off points may potentially be improved by observing the rate at which individual tumour markers change over time or combining tumour marker levels; however, this was not explored in this study. Our study design is limited in establishing temporal associations, as comparisons between groups are inevitably not from the same individuals. Similarly, no prognostic information could be concluded from this data.
In conclusion, these results clinically validate total urinary MTY as a tumour marker in the diagnosis and the monitoring of NB disease, with diagnostic performance similar to DA, HVA and HMMA.
Footnotes
Declaration of conflicting interests
The author(s) declared no potential conflicts of interest with respect to the research, authorship, and/or publication of this article.
Funding
The author(s) received no financial support for the research, authorship, and/or publication of this article.
Ethical approval
The study was approved by the Auckland District Health Board (A + 6619).
Guarantor
LL.
Contributorship
LL, GAW and JSD designed and performed the study; LL obtained ethics approval, analysed the data and wrote the first draft of the manuscript. LT was responsible for clinical oversight of the patients. GAW was responsible for biochemical analyses. All authors reviewed, edited and approved the final version of the manuscript.
References
Supplementary Material
Please find the following supplemental material available below.
For Open Access articles published under a Creative Commons License, all supplemental material carries the same license as the article it is associated with.
For non-Open Access articles published, all supplemental material carries a non-exclusive license, and permission requests for re-use of supplemental material or any part of supplemental material shall be sent directly to the copyright owner as specified in the copyright notice associated with the article.